
The Air Quality during the Confinement and Coronavirus 2020–2021 Period: The Case of Tunisia †


Abstract
:1. Introduction
2. Methods
3. Results and Discussion
4. Conclusions
Funding
Acknowledgments
References
- Huang, C.; Wang, Y.; Li, X.; Ren, L.; Zhao, J.; Hu, Y.; Zhang, L.; Fan, G.; Xu, J.; Gu, X.; et al. Clinical features of patients infected with 2019 novel coronavirus in Wuhan, China. Lancet 2020, 395, 497–506. [Google Scholar] [CrossRef] [Green Version]
- Chan, J.F.-W.; Yuan, S.; Kok, K.-H.; To, K.K.-W.; Chu, H.; Yang, J.; Xing, F.; Liu, J.; Yip, C.C.-Y.; Poon, R.W.-S.; et al. A familial cluster of pneumonia associated with the 2019 novel coronavirus indicating person-to-person transmission: A study of a family cluster. Lancet 2020, 395, 514–523. [Google Scholar] [CrossRef] [Green Version]
- WHO. Novel Coronavirus (2019-nCoV) Situation Report—1 (21 January 2020); World Health Organization: Geneva, Switzerland, 2020. [Google Scholar]
- Wilder-Smith, A.; Freedman, D.O. Isolation, quarantine, social distancing and community containment: pivotal role for old-style public health measures in the novel coronavirus (2019-nCoV). J. Travel Med. 2020, 1–4. [Google Scholar] [CrossRef] [PubMed]
- Wang, Q.; Su, M. A preliminary assessment of the impact of COVID-19 on environment—A case study of China. Sci. Total Environ. 2020, 728, 138915. [Google Scholar] [CrossRef] [PubMed]
- Arif, A. Confinement and Coronavirus: Falling Air Pollution in Tunisia; Technical Report; National Institute of Meteorology: Tunis, Tunisia, 2020; 32p, Available online: https://www.meteo.tn/sites/default/files/2020-05/Rapport-18-05-2020_en.pdf (accessed on 9 September 2021).
- Crouse, D.L.; Peters, P.A.; Hystad, P.; Brook, J.R.; van Donkelaar, A.; Martin, R.V.; Villeneuve, P.J.; Jerrett, M.; Goldberg, M.S.; Pope, C.A.; et al. Ambient PM2.5, O3, and NO2 exposures and associations with mortality over 16 Years of follow-up in the Canadian census health and environment cohort (CanCHEC). Environ. Health Perspect. 2015, 123, 1180–1186. [Google Scholar] [CrossRef] [PubMed] [Green Version]
- He, L.; Zhang, S.; Hu, J.; Li, Z.; Zheng, X.; Cao, Y.; Xu, G.; Yan, M.; Wu, Y. On-road emission measurements of reactive nitrogen compounds from heavy-duty diesel trucks in China. Environ. Pollut. 2020, 262, 114280. [Google Scholar] [CrossRef] [PubMed]
- He, M.Z.; Kinney, P.L.; Li, T.; Chen, C.; Sun, Q.; Ban, J.; Wang, J.; Liu, S.; Goldsmith, J.; Kioumourtzoglou, M.-A. Short- and intermediate-term exposure to NO2 and mortality: A multi-county analysis in China. Environ. Pollut. 2020, 261, 114165. [Google Scholar] [CrossRef] [PubMed]
- Ortiz, C.; Linares, C.; Carmona, R.; Díaz, J. Evaluation of short-term mortality attributable to particulate matter pollution in Spain. Environ. Pollut. 2017, 224, 541–551. [Google Scholar] [CrossRef] [PubMed]
- Gope, S.; Dawn, S.; Das, S.S. Effect of COVID-19 pandemic on air quality: A study based on Air Quality Index. Environ. Sci. Pollut. Res. 2020, 28, 35564–35583. [Google Scholar] [CrossRef] [PubMed]
- Brauer, M. How much, how long, what, and where: Air pollution exposure assessment for epidemiologic studies of respiratory disease. Proc. Am. Thorac. Soc. 2010, 7, 111–115. [Google Scholar] [CrossRef] [PubMed]
- Chen, S.; Bloom, D.E. The macroeconomic burden of noncommunicable diseases associated with air pollution in China. PLoS ONE 2019, 14, e0215663. [Google Scholar] [CrossRef] [PubMed]
- Cohen, A.J.; Brauer, M.; Burnett, R.; Anderson, H.R.; Frostad, J.; Estep, K.; Balakrishnan, K.; Brunekreef, B.; Dandona, L.; Dandona, R.; et al. Estimates and 25-year trends of the global burden of disease attributable to ambient air pollution: An analysis of data from the Global Burden of Diseases Study 2015. Lancet 2017, 389, 1907–1918. [Google Scholar] [CrossRef] [Green Version]
- European Environment Agency. Communication from the Commission to the Council and the European Parliament—Thematic Strategy on Air Pollution. (COM(2005) 0446 Final); European Environment Agency: Copenhagen, Denmark, 2005. [Google Scholar]
- Rohde, R.A.; Muller, R.A. Air Pollution in China: Mapping of Concentrations and Sources. Berkeley Earth 2015, 10, e0135749. [Google Scholar] [CrossRef] [PubMed]
- Wang, H.; Dwyer-Lindgren, L.; Lofgren, K.T.; Rajaratnam, J.K.; Marcus, J.R.; Levin-Rector, A.; Levitz, C.E.; Lopez, A.D.; Murray, C.J.L. Age-specific and sex-specific mortality in 187 countries, 1970–2010: A systematic analysis for the Global Burden of Disease Study 2010. Lancet 2012, 380, 2071–2094. [Google Scholar] [CrossRef]
- Chiusolo, M.; Cadum, E.; Stafoggia, M.; Galassi, C.; Berti, G.; Faustini, A.; Bisanti, L.; Vigotti, M.A.; Dessì, M.P.; Cernigliaro, A.; et al. EpiAir Collaborative Group Short-Term effects of nitrogen dioxide on mortality and susceptibility factors in 10 Italian cities: The EpiAir study. Environ. Health Perspect. 2011, 119, 1233–1238. [Google Scholar] [CrossRef] [PubMed] [Green Version]
- Hoek, G.; Krishnan, R.M.; Beelen, R.; Peters, A.; Ostro, B.; Brunekreef, B.; Kaufman, J.D. Long-term air pollution exposure and cardio respiratory mortality: A review. Environ. Health 2013, 12, 43. [Google Scholar] [CrossRef] [PubMed] [Green Version]
- Arif, A. Lightning Activity and Climate Change with NCEP and CRCM Data: Canada and Northern United States Regions; Editions Universitaires Européennes: Saarbrücken, Germany, 2012; 136p, ISBN 978-3-8417-9647-9. [Google Scholar]


| SO2 | NO2 | O3 | CO | |||||||||
|---|---|---|---|---|---|---|---|---|---|---|---|---|
| 2019 | 2020 | 2021 | 2019 | 2020 | 2021 | 2019 | 2020 | 2021 | 2019 | 2020 | 2021 | |
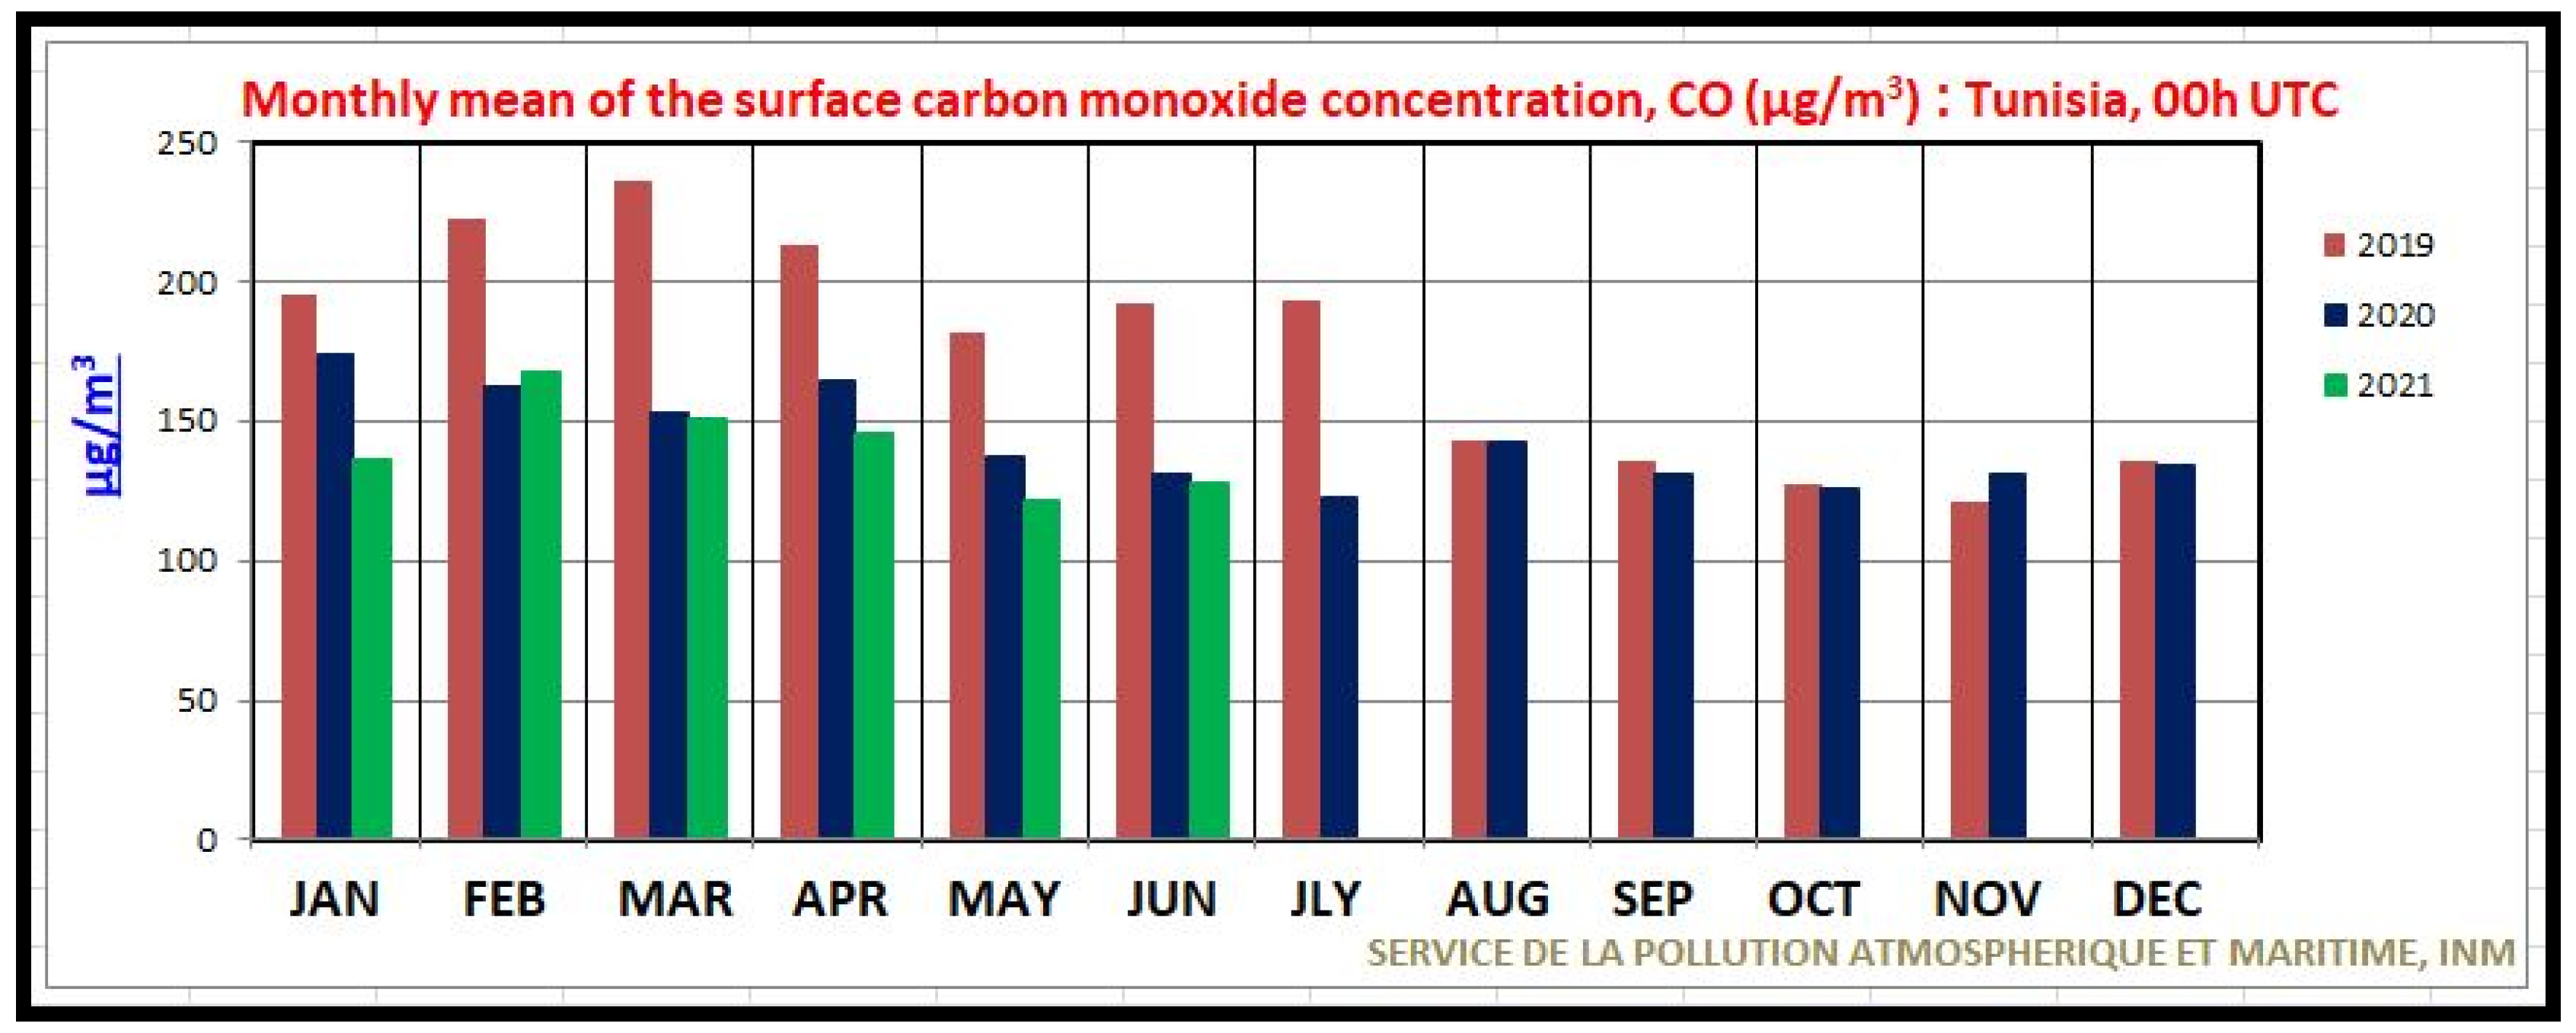
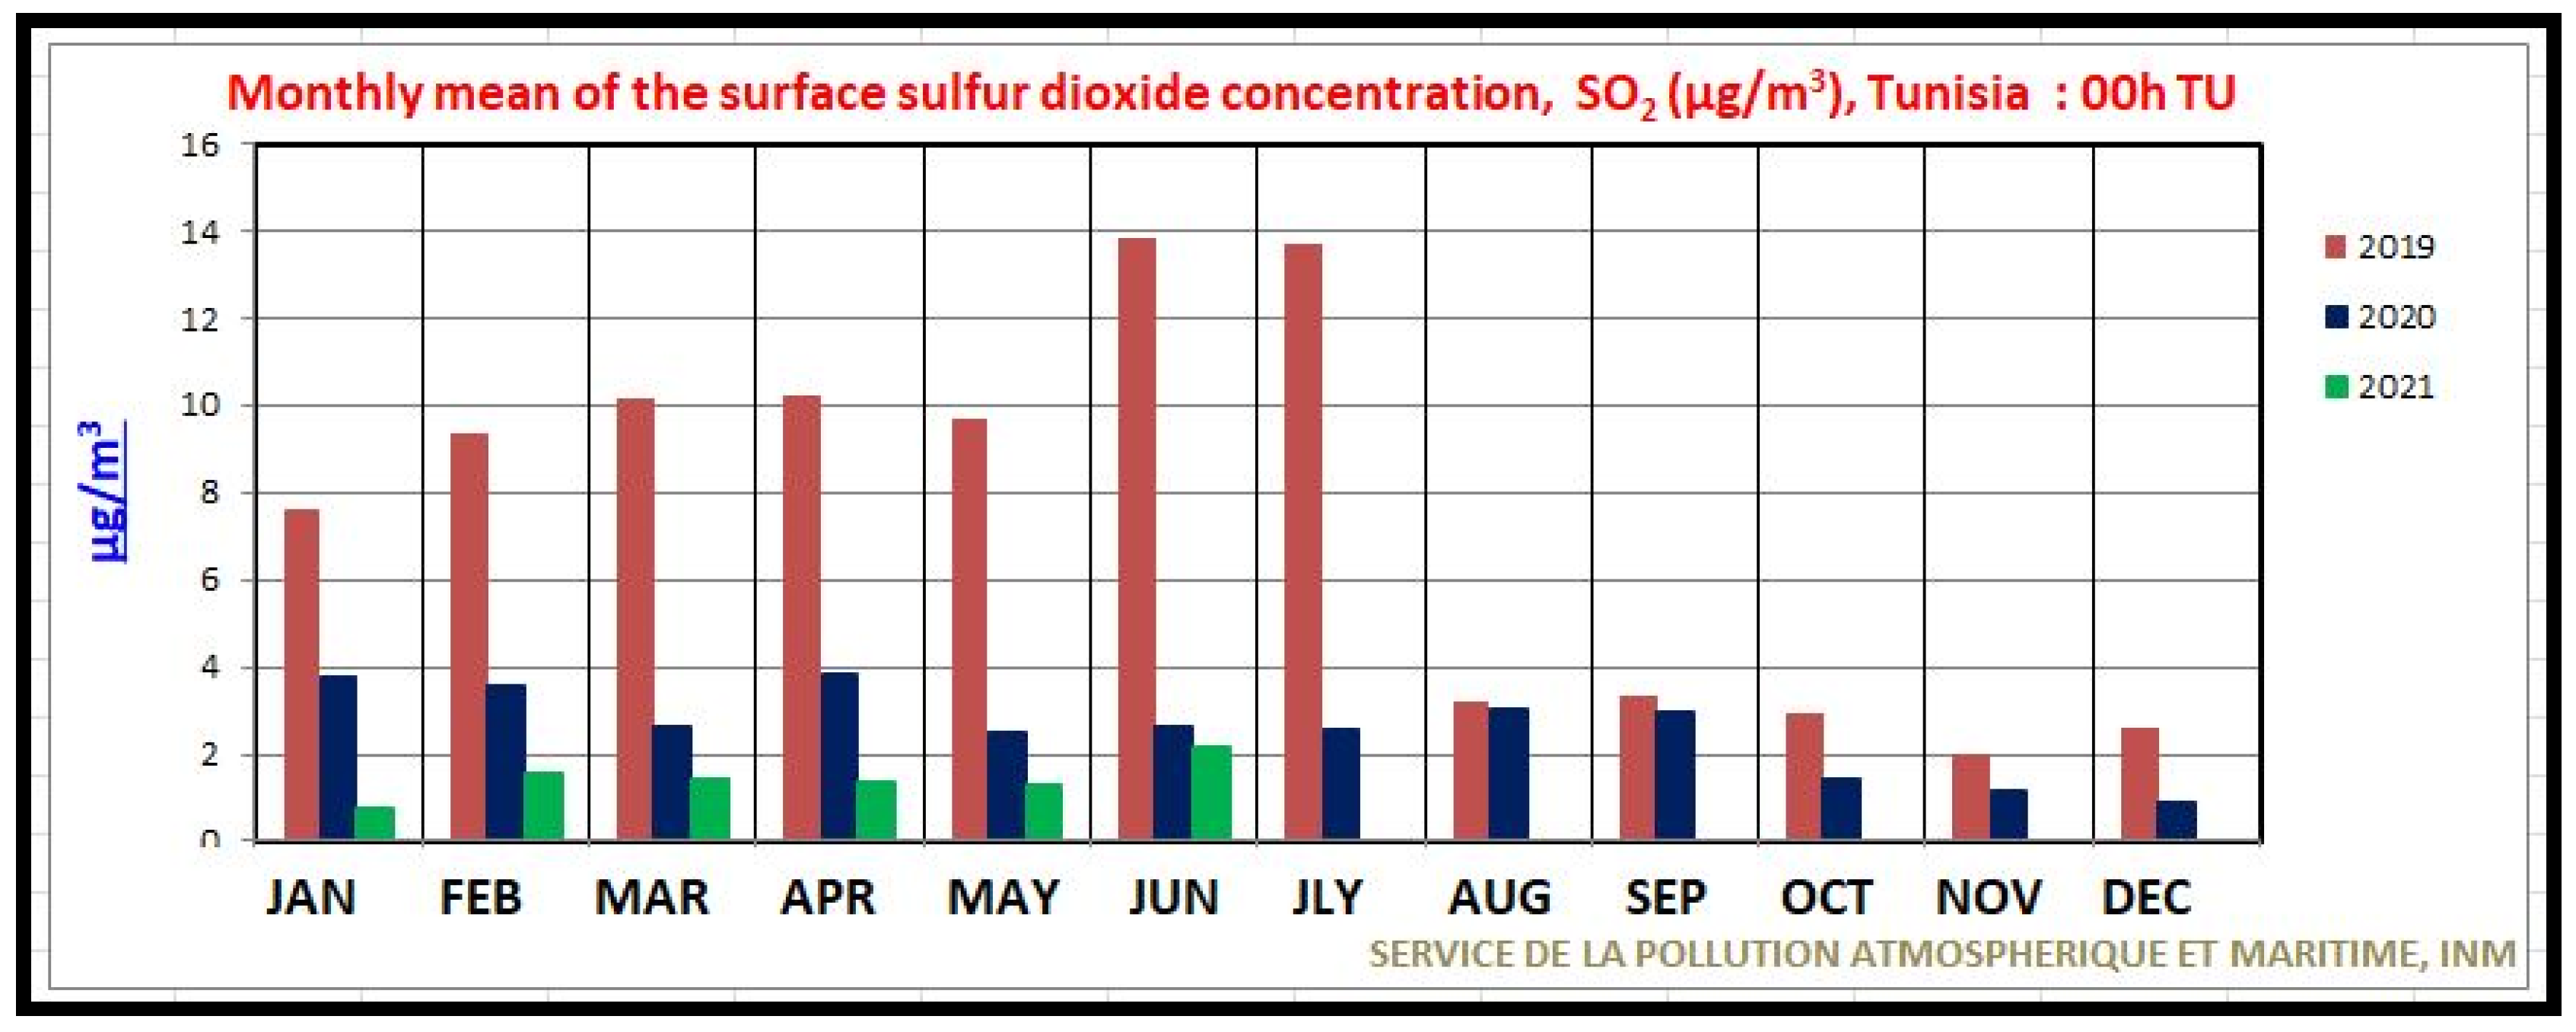
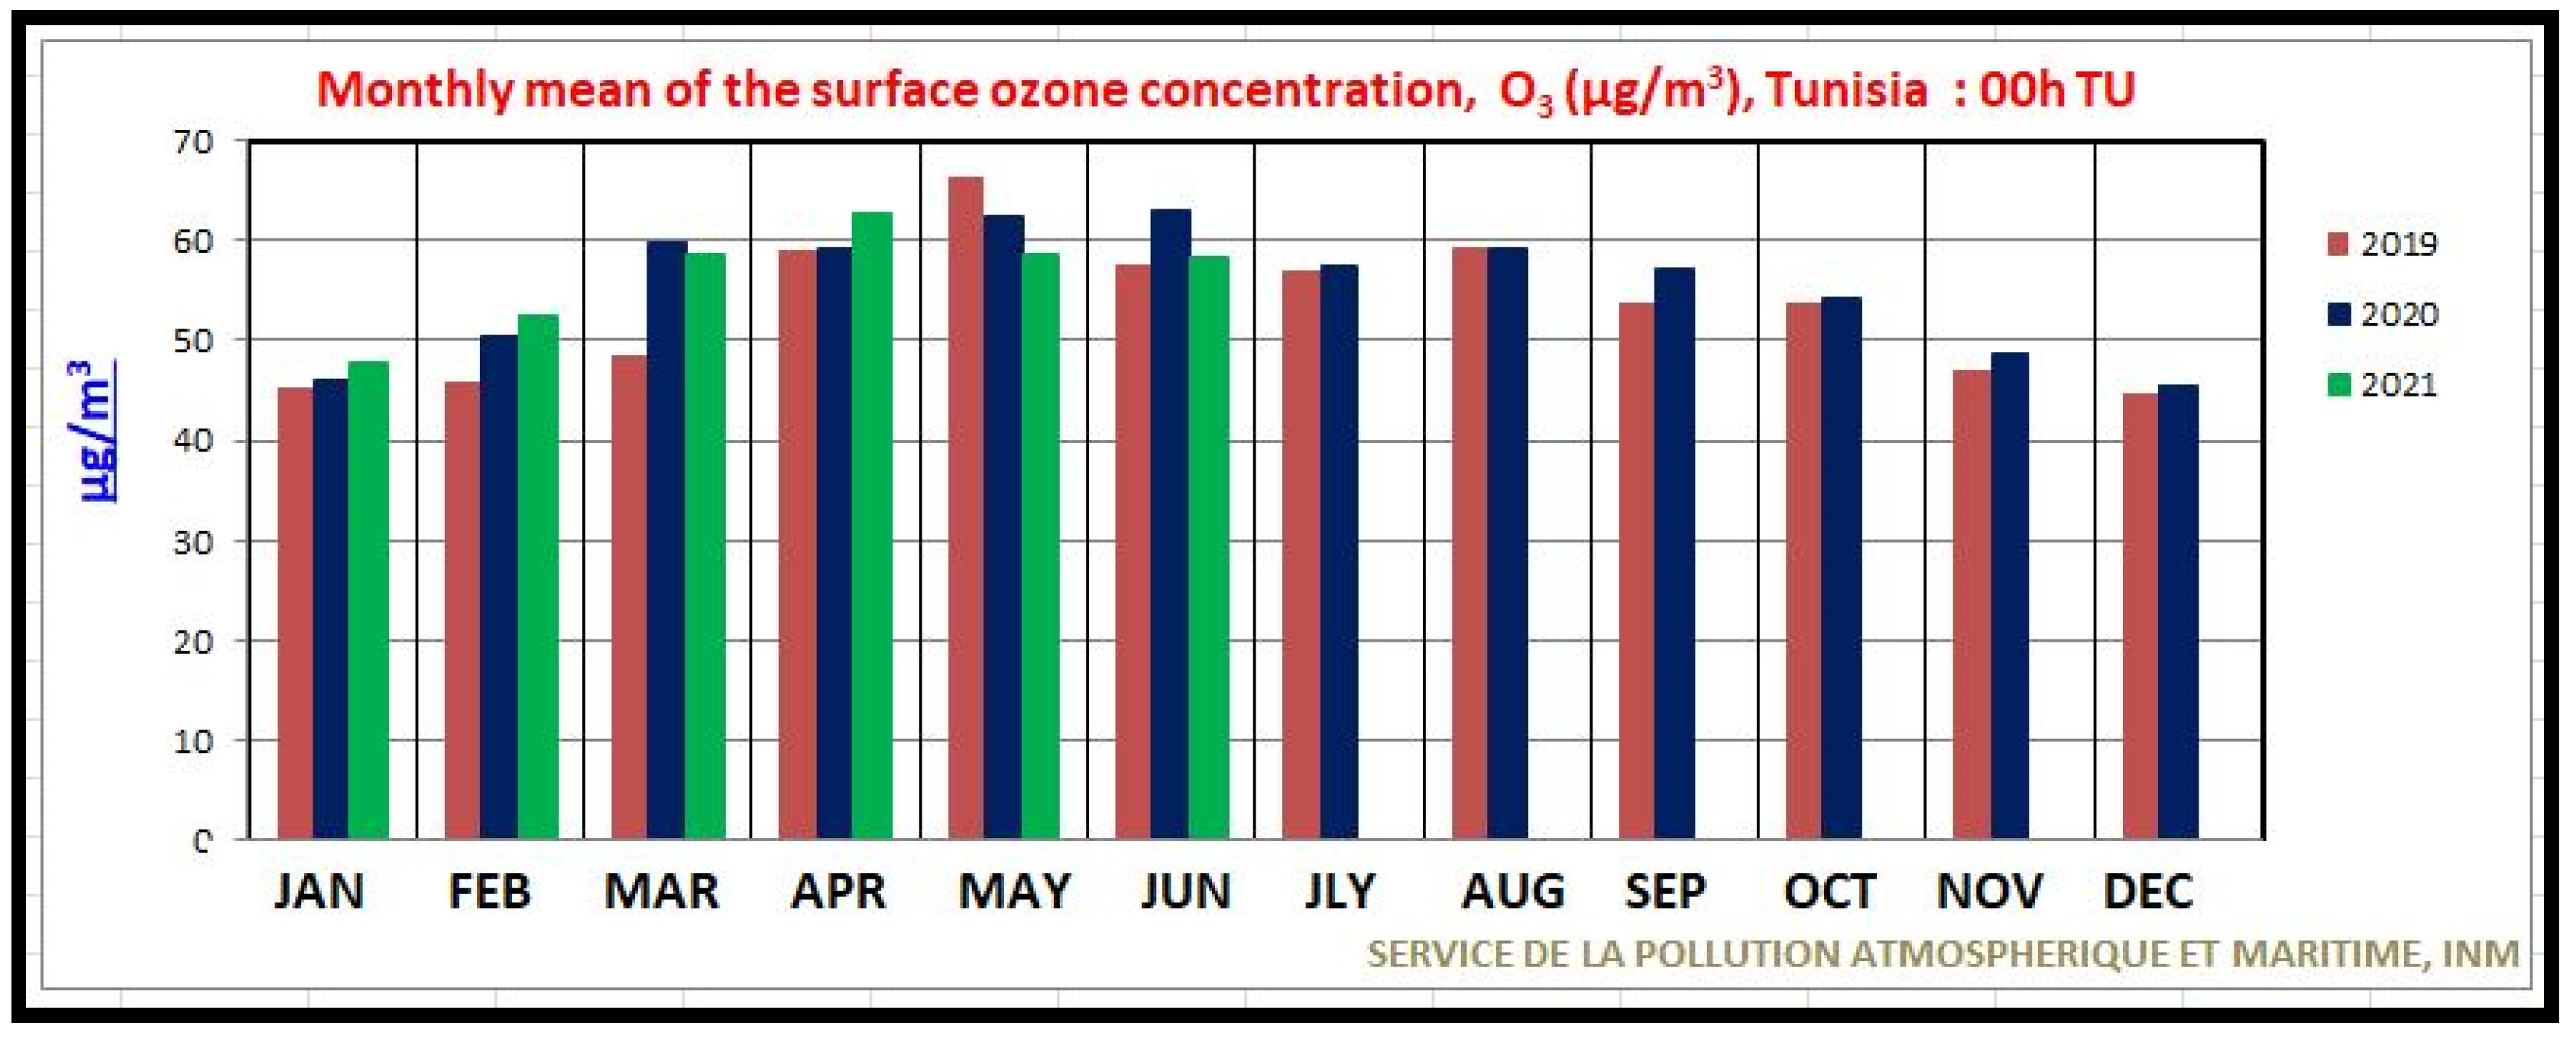
| January | 7.62 | 3.79 | 0.76 | 7.35 | 5.61 | 2.66 | 45.45 | 46.01 | 47.8 | 195.08 | 173.32 | 136.09 |
| February | 9.38 | 3.54 | 1.57 | 9.28 | 6.61 | 3.95 | 45.84 | 50.47 | 52.57 | 222.91 | 162.72 | 167.85 |
| March | 10.14 | 2.62 | 1.42 | 10.43 | 4.05 | 2.93 | 48.67 | 59.8 | 58.49 | 235.81 | 152.92 | 151.24 |
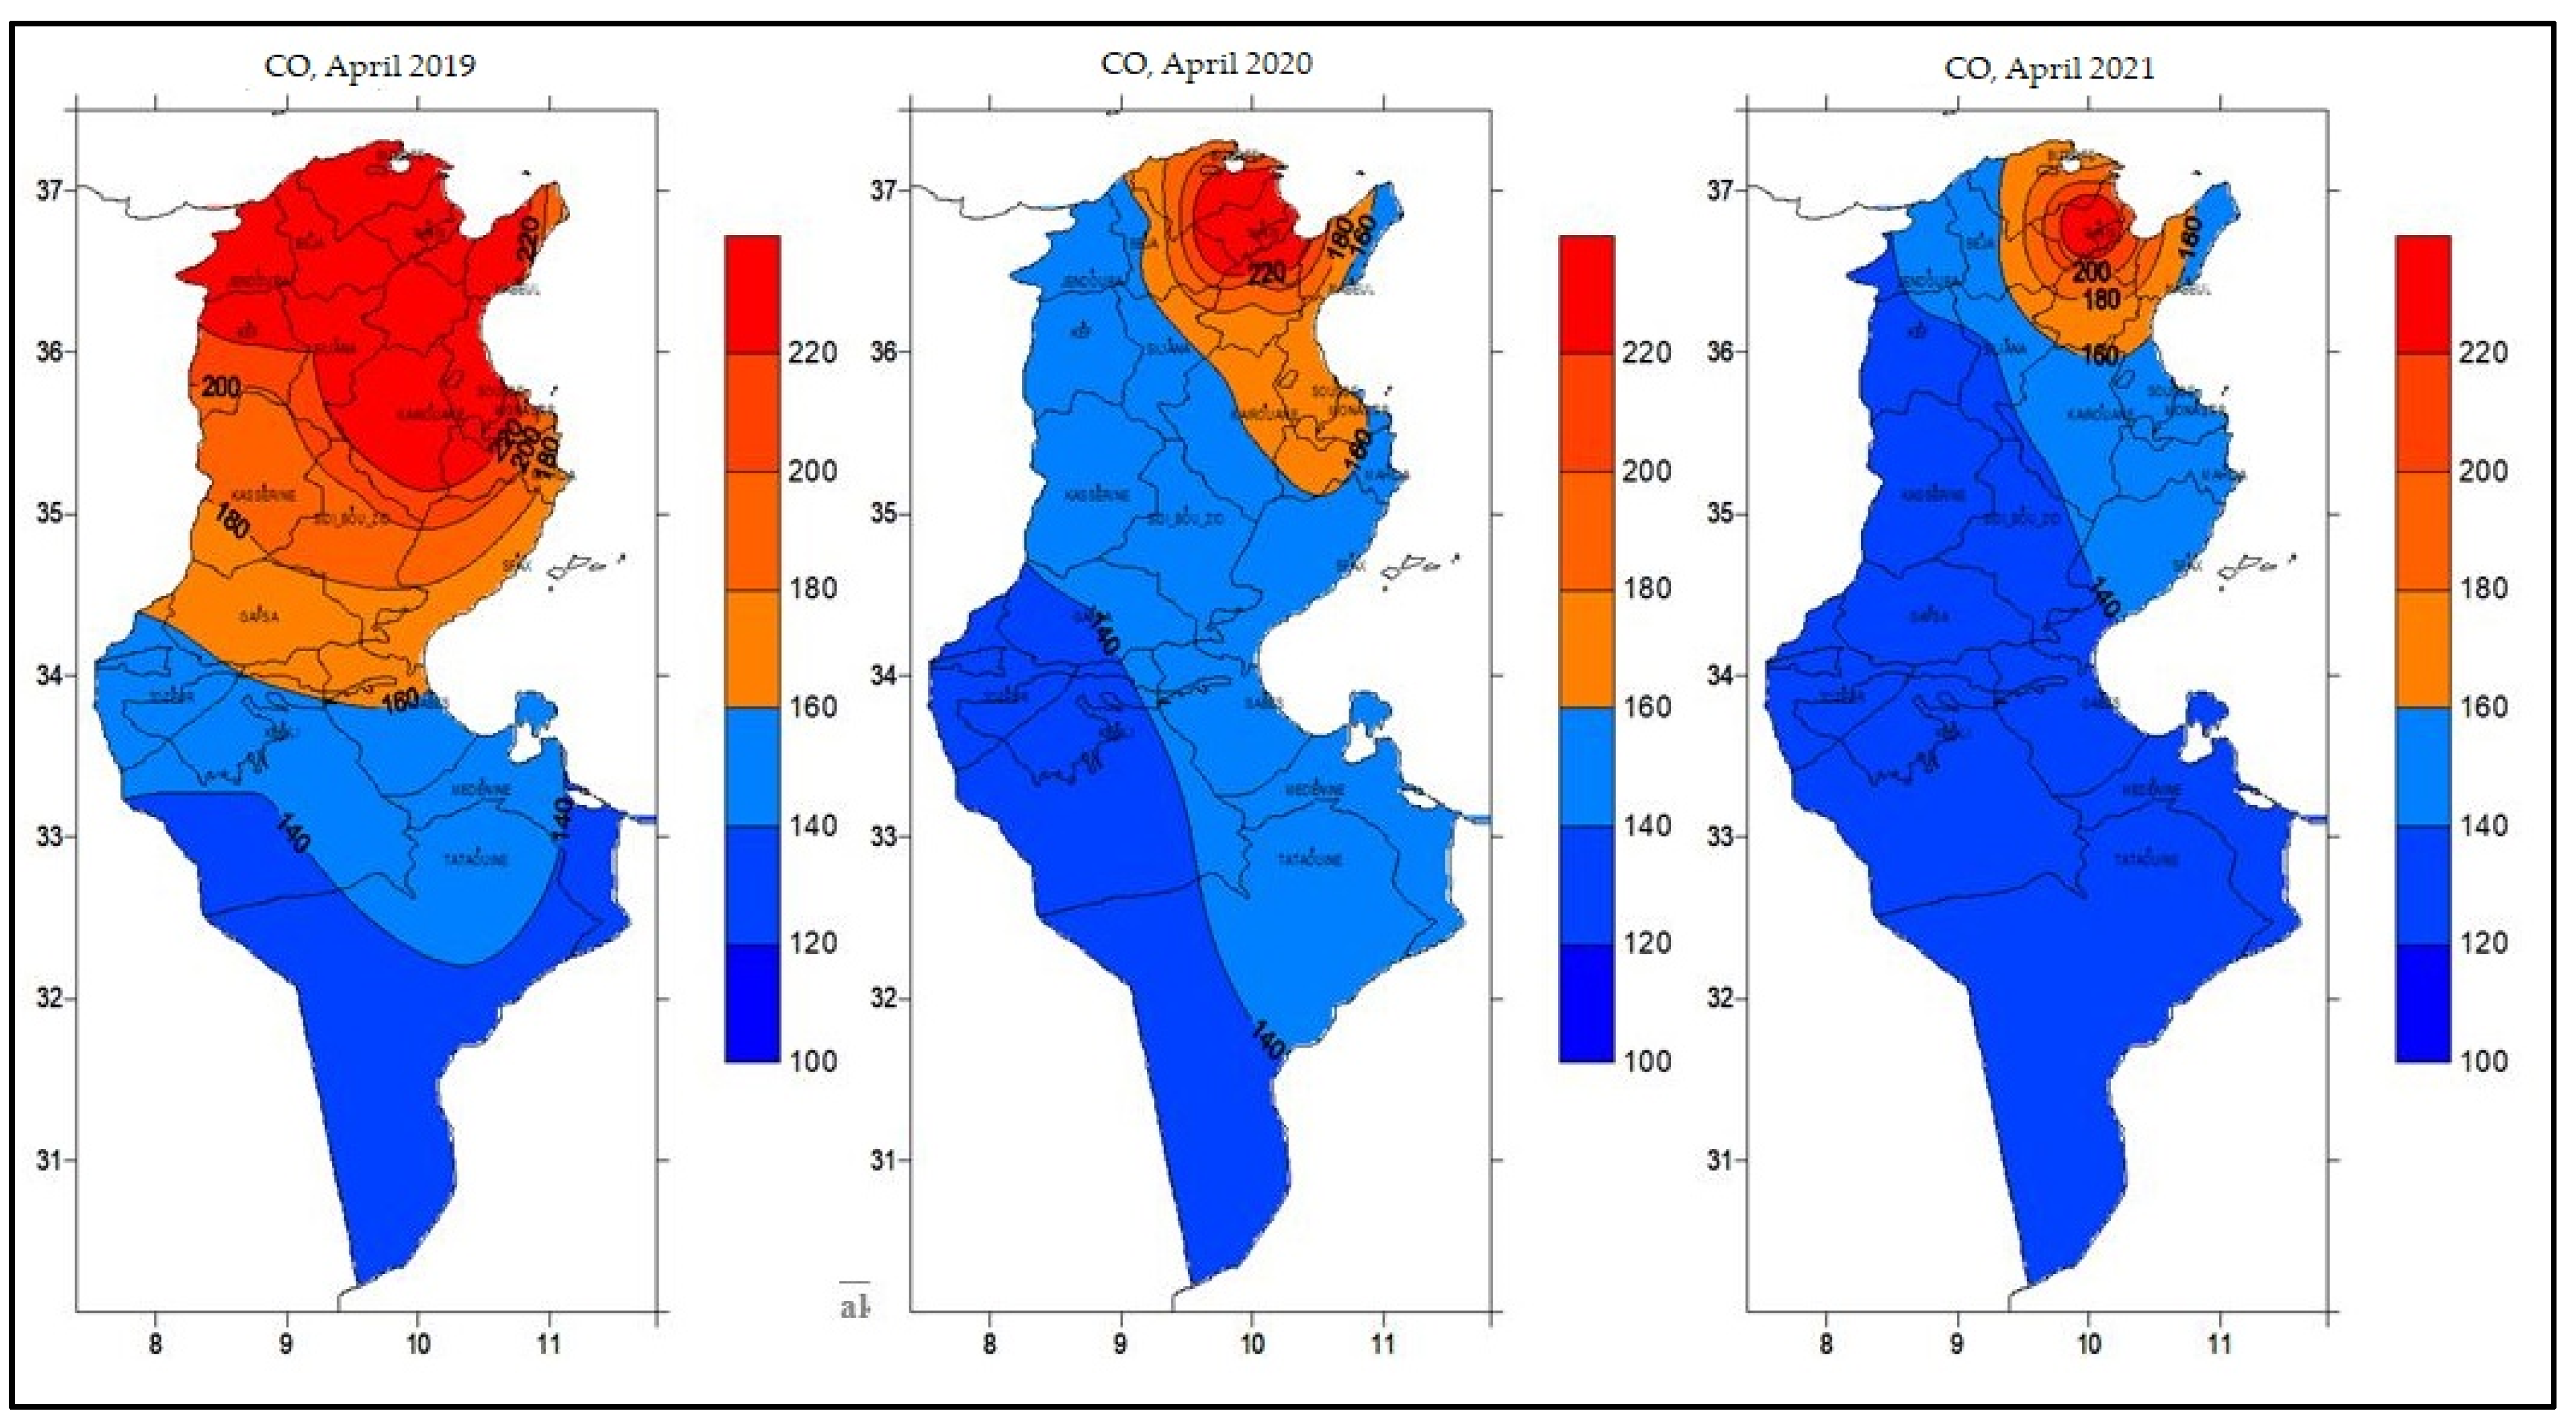
| April | 10.21 | 3.85 | 1.35 | 9.03 | 4.69 | 2.49 | 58.93 | 59.26 | 62.77 | 212.67 | 164.86 | 145.94 |
| May | 9.7 | 2.49 | 1.31 | 8.78 | 3.96 | 2.65 | 66.47 | 62.38 | 58.7 | 181.44 | 136.81 | 121.48 |
| June | 13.84 | 2.66 | 2.14 | 11.28 | 4.02 | 2.93 | 57.54 | 63 | 58.38 | 192 | 131.24 | 127.64 |
| July | 13.73 | 2.56 | 11.07 | 4.09 | 57.03 | 57.45 | 192.8 | 122.63 | ||||
| August | 3.22 | 3.04 | 3.95 | 4.4 | 59.47 | 59.2 | 142.95 | 142.9 | ||||
| September | 3.33 | 2.96 | 4.68 | 4.4 | 53.65 | 57.14 | 135.4 | 131.05 | ||||
| October | 2.91 | 1.44 | 4.23 | 2.87 | 53.92 | 54.22 | 127.73 | 125.85 | ||||
| November | 2.02 | 1.19 | 3.99 | 3.37 | 47.18 | 48.57 | 120.68 | 131.28 | ||||
| December | 2.58 | 0.91 | 4.51 | 2.99 | 44.86 | 45.59 | 135.44 | 133.94 | ||||
| SO2 | NO2 | O3 | CO | |||||||||
|---|---|---|---|---|---|---|---|---|---|---|---|---|
| 2019 | 2020 | 2021 | 2019 | 2020 | 2021 | 2019 | 2020 | 2021 | 2019 | 2020 | 2021 | |
| Tunis | 44.87 | 22.49 | 3.66 | 36.99 | 16.57 | 11.10 | 38.48 | 48.53 | 47.59 | 469.04 | 361.00 | 265.43 |
| Bizerte | 17.99 | 7.35 | 1.99 | 19.58 | 7.39 | 4.16 | 55.38 | 65.30 | 65.54 | 264.03 | 191.28 | 165.62 |
| Nabeul | 10.11 | 2.81 | 1.69 | 10.90 | 3.90 | 3.23 | 61.05 | 76.35 | 73.58 | 212.36 | 143.54 | 149.84 |
| Kelibia | 4.98 | 1.60 | 0.96 | 6.19 | 1.17 | 1.07 | 73.48 | 80.92 | 80.74 | 161.83 | 133.34 | 136.13 |
| Ain Drahem | 12.06 | 1.45 | 1.03 | 11.52 | 3.68 | 3.03 | 52.60 | 55.18 | 49.02 | 250.39 | 153.73 | 143.26 |
| Jendouba | 15.04 | 1.34 | 0.76 | 14.23 | 3.92 | 3.41 | 39.15 | 52.91 | 42.00 | 268.28 | 151.54 | 143.40 |
| Le Kef | 10.84 | 1.81 | 0.72 | 9.58 | 3.14 | 2.63 | 44.69 | 62.22 | 53.78 | 214.40 | 142.76 | 135.91 |
| Siliana | 10.13 | 1.40 | 0.75 | 9.43 | 2.49 | 1.92 | 50.13 | 70.64 | 66.26 | 219.45 | 141.40 | 136.16 |
| Kairouane | 16.93 | 2.33 | 0.99 | 13.21 | 4.45 | 2.70 | 42.91 | 57.80 | 52.79 | 278.84 | 162.69 | 148.39 |
| Kasserine | 8.31 | 1.84 | 0.58 | 6.21 | 2.99 | 1.71 | 47.30 | 70.25 | 66.95 | 186.41 | 145.34 | 134.41 |
| Mahdia | 3.58 | 1.62 | 0.74 | 3.12 | 0.89 | 1.10 | 77.53 | 79.12 | 77.59 | 157.13 | 134.51 | 136.22 |
| Sousse | 8.44 | 3.38 | 1.57 | 9.06 | 11.27 | 3.51 | 64.34 | 68.36 | 73.68 | 199.62 | 147.11 | 143.14 |
| Gafsa | 5.80 | 1.86 | 0.74 | 3.87 | 1.50 | 1.04 | 58.91 | 72.56 | 68.17 | 175.37 | 140.03 | 132.99 |
| Sfax | 5.54 | 4.28 | 1.49 | 4.02 | 2.63 | 1.54 | 74.57 | 77.84 | 72.38 | 167.58 | 155.66 | 142.81 |
| Gabes | 4.10 | 3.92 | 1.62 | 2.49 | 2.40 | 1.52 | 72.19 | 73.44 | 68.00 | 162.43 | 149.64 | 138.85 |
| Jerba | 1.50 | 2.12 | 1.17 | 0.95 | 1.04 | 0.88 | 75.93 | 81.84 | 77.52 | 143.26 | 143.90 | 138.52 |
| Tataouine | 2.38 | 3.52 | 2.59 | 1.54 | 1.62 | 1.49 | 73.35 | 71.89 | 63.71 | 147.91 | 149.08 | 138.53 |
| Kebili | 1.88 | 1.51 | 1.52 | 0.59 | 0.39 | 0.61 | 72.37 | 68.18 | 63.90 | 138.33 | 131.06 | 132.72 |
| El Borma | 0.89 | 1.65 | 1.50 | 0.60 | 0.51 | 0.47 | 68.71 | 70.23 | 59.61 | 126.32 | 128.65 | 120.57 |
Publisher’s Note: MDPI stays neutral with regard to jurisdictional claims in published maps and institutional affiliations. |
© 2021 by the author. Licensee MDPI, Basel, Switzerland. This article is an open access article distributed under the terms and conditions of the Creative Commons Attribution (CC BY) license (https://creativecommons.org/licenses/by/4.0/).
Share and Cite
Arif, A. The Air Quality during the Confinement and Coronavirus 2020–2021 Period: The Case of Tunisia. Environ. Sci. Proc. 2021, 8, 9. https://doi.org/10.3390/ecas2021-10328
Arif A. The Air Quality during the Confinement and Coronavirus 2020–2021 Period: The Case of Tunisia. Environmental Sciences Proceedings. 2021; 8(1):9. https://doi.org/10.3390/ecas2021-10328
Chicago/Turabian StyleArif, Abderrazak. 2021. "The Air Quality during the Confinement and Coronavirus 2020–2021 Period: The Case of Tunisia" Environmental Sciences Proceedings 8, no. 1: 9. https://doi.org/10.3390/ecas2021-10328
APA StyleArif, A. (2021). The Air Quality during the Confinement and Coronavirus 2020–2021 Period: The Case of Tunisia. Environmental Sciences Proceedings, 8(1), 9. https://doi.org/10.3390/ecas2021-10328