Abstract
The aim of this study was to evaluate the carbon dioxide (CO2) and methane (CH4) emissions during the composting and vermicomposting of sewage sludge under the effect of different proportions of straw pellets. Four treatments, including a control with three replicates, were designed to mix the initial sewage sludge with varying rates of pelletized wheat straw (0, 25%, 50%, and 75% (w/w)). Over a 60-day period, vermicomposting with Eisenia andrei treatments and composting were carried out. The results indicated that both composting and vermicomposting produce a significant (p < 0.001) amount of CO2 and CH4 emissions from all treatments. Vermicomposting significantly reduced CH4 emissions by 18%, 34%, and 38% and increased CO2 emissions by 75%, 64%, and 89% for the treatments containing 25%, 50%, and 75% straw pellets, respectively, compared to composting. However, CO2 emissions decreased and CH4 emissions increased during composting compared to vermicomposting. As a result of this finding, both composting and vermicomposting processes are recommended as an additive of pelletized wheat straw, depending on the target gas to be reduced.
1. Introduction
Sewage sludge is the residual, semi-solid material that is produced as a by-product during the process of biological wastewater treatment or municipal wastewater. The large amounts produced in recent decades represent an increasing trend, and improper disposal or management has resulted in serious environmental pollution due to the putrescible nature of sewage sludge and waste management challenges [1]. The improper management of sewage sludge causes secondary pollution such as pathogenic microbes, organic micro-pollutants, and toxic heavy metals. Therefore, sustainable and eco-friendly sewage sludge management is urgently required [2]. According to He et al. [3], currently, the annual production of sewage sludge in the European Union reaches over 10.96 million tons per year and 40 million tons in China [4]. This amount is increasing due to expedited urbanization and the increasing capacity of municipal wastewater treatment facilities [5].
Composting and vermicomposting are effective techniques and low cost methods to manage and reuse sewage sludge due to its safe and stable products that can be used as an organic fertilizer or soil conditioner for farming [6]. However, harmful gases such as ammonia (NH3), nitrous oxide (N2O), and methane (CH4) are emitted due to the mismanagement of sewage sludge. CH4 and CO2 are two of the most important greenhouse gases in the atmosphere. CH4 is radiatively stronger than CO2 on a mass basis and it is reported that the current global warming potential of CH4 is 25 times higher than that of CO2 over a 100 year period [7]. Most previous studies on composting and vermicomposting have focused on the feasibility of different organic wastes and the factors affecting the growth and reproduction rate of earthworms as well as the quality of the compost and vermicompost [8]. However, little is known about the emissions of CO2 and CH4 during the composting and vermicomposting of sewage sludge. Therefore, the aim of this study was to evaluate the carbon dioxide (CO2) and methane (CH4) emissions during the composting and vermicomposting of sewage sludge under the effect of different proportions of straw pellets.
2. Materials and Methods
2.1. Raw Materials
The experiment was carried out at the experimental station of the Faculty of Agrobiology, Food and Natural Resources, Czech University of Life Science, Prague, in Cerveny Ujezd. The sewage sludge used in the experiments was collected from a wastewater treatment plant in the Czech Republic. Dried pelletized wheat straw was provided by the Granofyt Ltd. Company (Chrášťany, Czechia) with a diameter of 10 mm. The selected chemical properties of the sewage sludge and pelletized wheat straw are listed in Table 1 and the treatments on the initial day (day 0) are listed in Table 2. Eisenia andrei was used in this study for the vermicomposting.

Table 1.
Selected chemical properties of the initial materials.
Table 2.
Selected chemical properties of the treatments on the initial day (day 0).
2.2. Experimental Design
The experiment included four treatments with three replications: T1 (100% sewage sludge (control)), T2 (75% sewage sludge (SS) + 25% pelletized wheat straw (PWS)), T3 (50% SS + 50% PWS), and T4 (25% SS + 75% PWS) (w/w). The pelletized wheat straw was applied on a wet weight basis. In all the treatments, the substrate was homogenized and transferred to fermenter barrels for 60 days for composting and the same treatments were also transferred to worm-bins for vermicomposting. Each worm-bin received 377 (57.4 g) pieces of adult earthworms (Eisenia andrei). The moisture level of the material was maintained at about 70–80% of wet mass throughout the vermicomposting stage by spraying the surface with water at two-day intervals.
2.3. Measurements of Carbon Dioxide (CO2) and Methane (CH4) during Composting and Vermicomposting
The concentrations of CO2 and CH4 during both composting and vermicomposting were measured by a closed chamber technique. A tight-fitting lid with two ports for headspace gas sampling and air temperature measurement was used to connect one side tip of a plastic tube to closed barrels for composting and a worm-bin for vermicomposting, and the other side tip of a plastic tube was connected with instruments during the data recording. The measurements were taken twice a day within 12 hour intervals for 60 days by using a Gasko Infrared Gas Analyzer [9].
To calculate the cumulative CO2 and CH4 emissions, we summed the daily values to obtain the total cumulative gas emissions during the whole experimental period [9].
where At(ab) is the cumulative emission between the measurement days (between ta and tb), ta and tb are the measurement dates, and Fta and Ftb are the gas fluxes on the two measurement dates. Therefore, the total cumulative emissions were calculated as the sum of the cumulative emissions on each day using Equation (2):
2.4. Analysis of Total Carbon (TOC), Total Nitrogen (TN), pH, and EC
The samples were taken for the determination of TOC, TN, pH, and EC using standard methods. The pH and electrical conductivity (EC) were measured in distilled water at 1:5 (w/v). The values of total carbon (TOC) and total nitrogen (TN) were acquired with an elemental analyzer (Elemental Vario EL, Germany).
2.5. Statistical Analyses
The statistical analyses were carried out using the R version 4.0.2 statistical package. An ANOVA was used to test the significant sources of variation and the following Tukey HSD test was used to compare the treatment means if the effect of the factors was significant at p < 0.05. A two-way analysis of variance (ANOVA) was performed to analyze the significant differences between the treatment and composting process methods.
3. Results and Discussions
3.1. Temperature during Composting
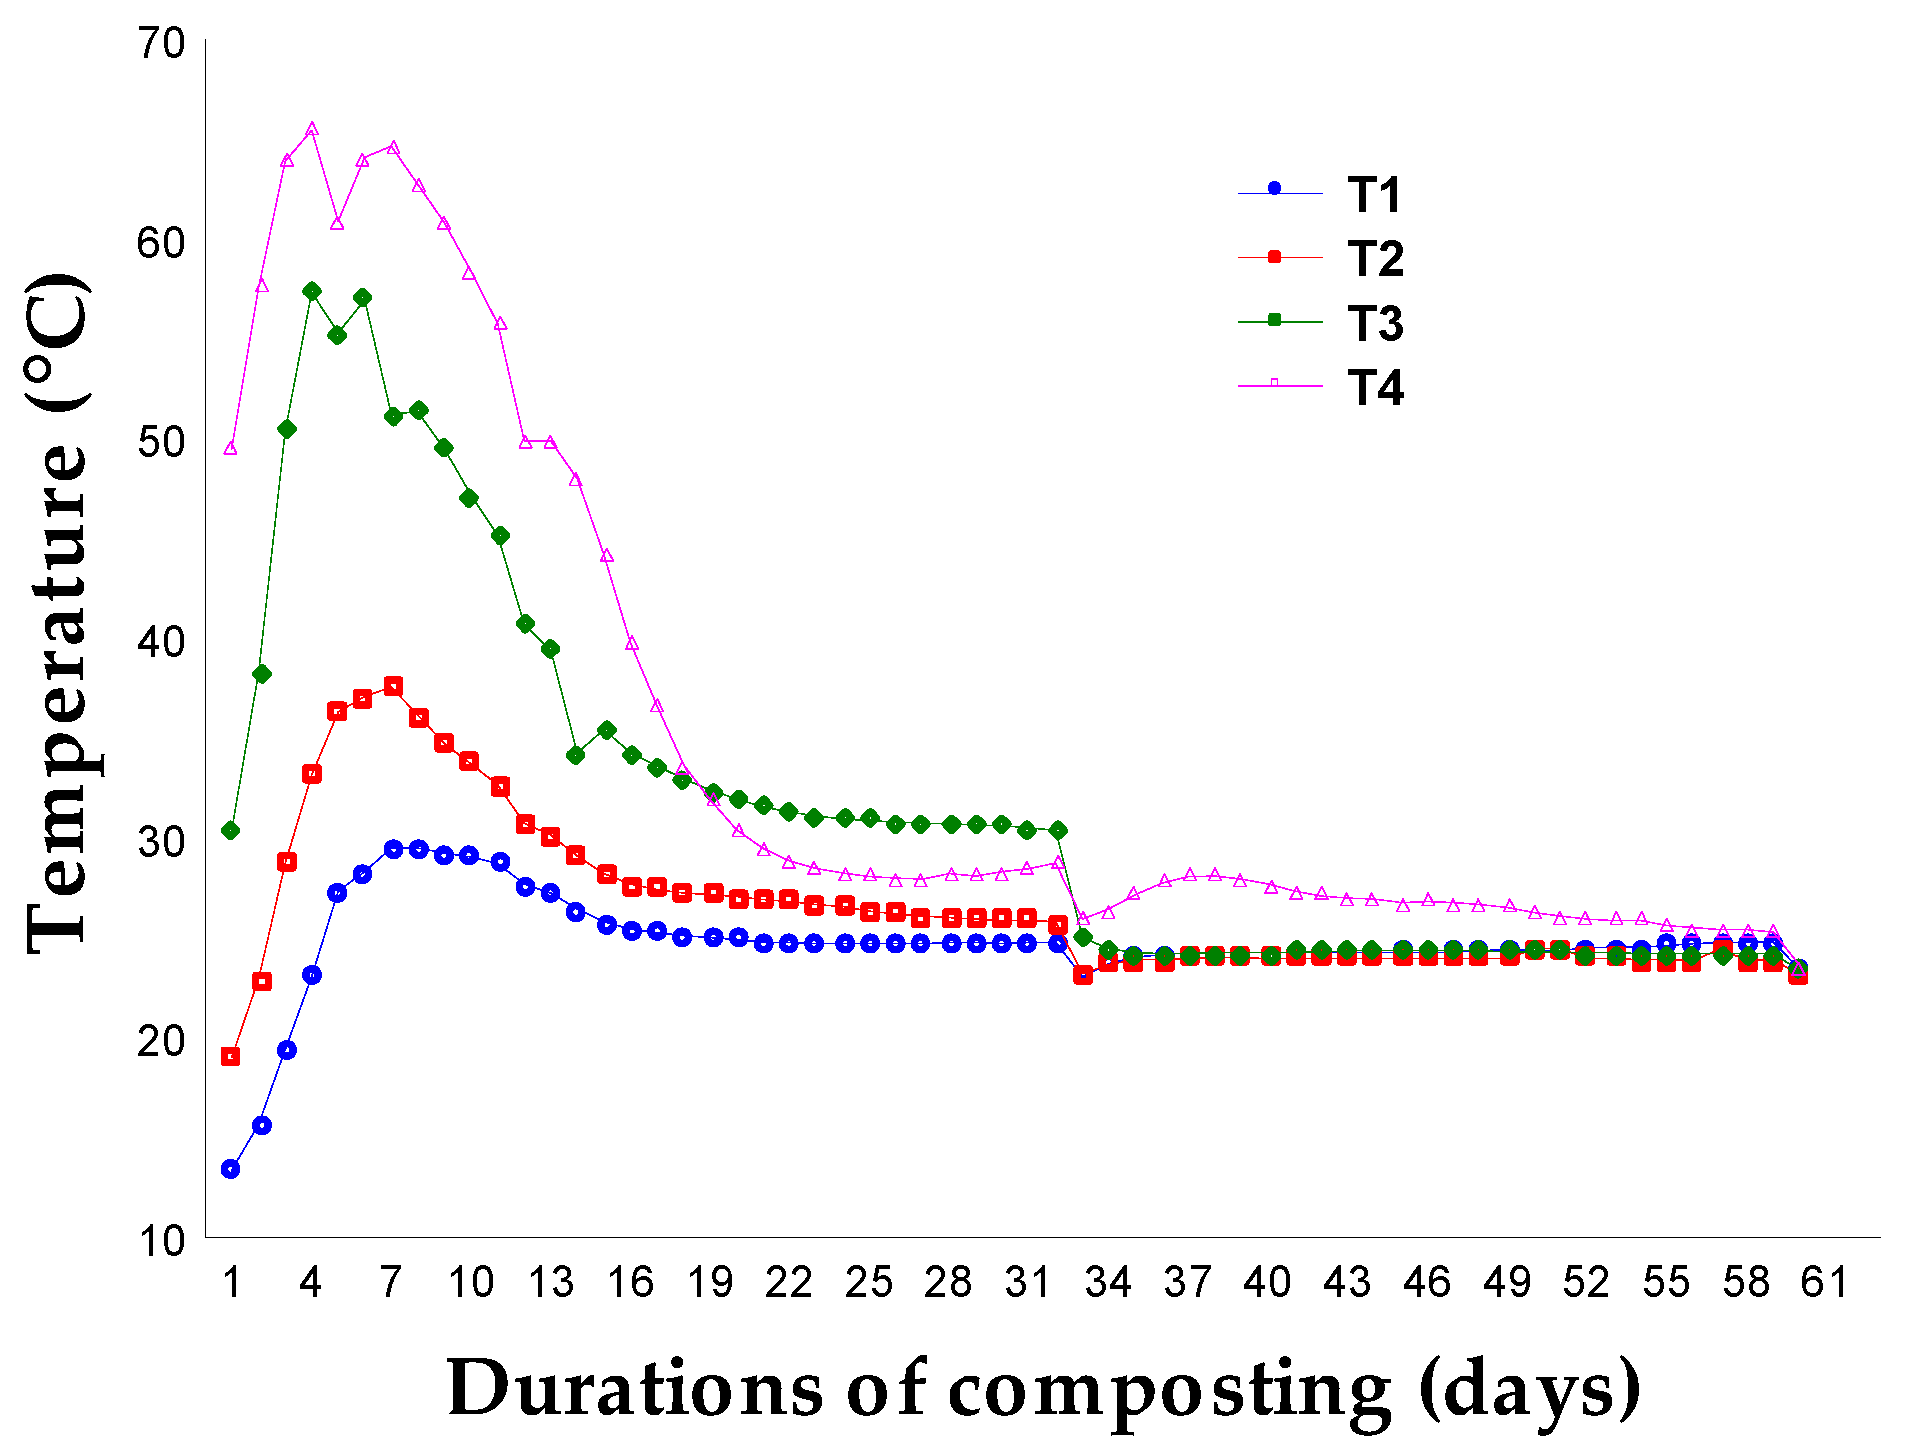
The temperature in each treatment reached its maximum during the composting process with significant differences between the treatments (Figure 1). Variations in the temperature were the result of mixing with different percentages of pelletized wheat straw. The temperature of two treatments (T3 and T4) rapidly reached the thermophilic stage (>50 °C) on days 3 and 2, respectively. T4 reached the maximum thermophilic phase of 65.5 °C in four days and 57.4 °C for T3. The thermophilic phase lasted for 14 days in T4 and 10 days in T3. The maximum temperature for the remaining treatments was 37.6 °C for T2 and 29.55 °C for T1; the temperatures gradually declined until the end of the experiments. Thus, the addition of pelletized wheat straw resulted in more intensive decomposition in the thermophilic phase, but in the cooling phase, the degradation process resulted in less heat in these mixtures due to the depletion of easily degradable organic compounds [10]). T1 (control) and T2 (25% PWS) delayed reaching the thermophilic stage and had no thermophilic phase at all; the maximum temperature was 37.6 °C for T2 and 29.55 °C for the control and lasted to maturity within the mesophilic temperatures. This may have been due to the high moisture in these treatments.
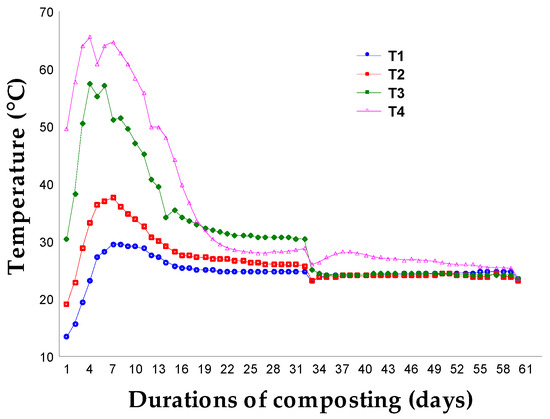
Figure 1.
Evolution of temperatures during the composting processes.
3.2. pH and EC
The pH of the final compost and vermicompost for all treatments is shown in Table 3. The proportions of pelletized wheat straw in the mixtures resulted in lower pH values during vermicomposting. This was probably due to the high content of organic acids (e.g., succinic and maleic acid) and was directly proportional to the amount of straw in the treatments [11]. The pH of the compost (T1, T2, T3, and T4) was higher than the vermicompost. However, the pH in the vermicompost decreased significantly (p < 0.05). A similar pH behavior during the vermicomposting of sewage sludge, crop straw, municipal solid waste, and livestock manure was also reported by other researchers [11]. The release of low molecular weight organic acids from organic decomposition and the increase in nitrification could decrease the pH during vermicomposting [12]. A decrease in the pH during the vermicomposting of different feeding materials has been reported [13,14]. The lower pH of the vermicompost might indicate that a more intense decomposition reaction occurs during vermicomposting than in composting.
Table 3.
Selected chemical properties of the end product compost and vermicompost.
The EC value was higher in the compost than in the vermicompost made from the same raw material and treatments (Table 3). The EC gradually increased in all of the treatments, which could be explained by the release of bonded elements during earthworm digestion [15,16] and the release of minerals during the decomposition of organic matter in the form of cations in the vermicompost [17]. The final EC was within the recommended limit of 2 dS/m [18] for all the treatments, which indicated an ideal vermicompost/compost for an application to plants. The increased EC during the period of the vermicomposting process was consistent with those reported in earlier works [19,20], which was probably due to the degradation of organic matter-releasing minerals such as exchangeable Ca, Mg, K, and P in their available forms; that is, in the form of cations in the vermicompost and the compost [17].
3.3. Emissions of CO2 and CH4 during Composting and Vermicomposting
3.3.1. Carbon Dioxide (CO2)
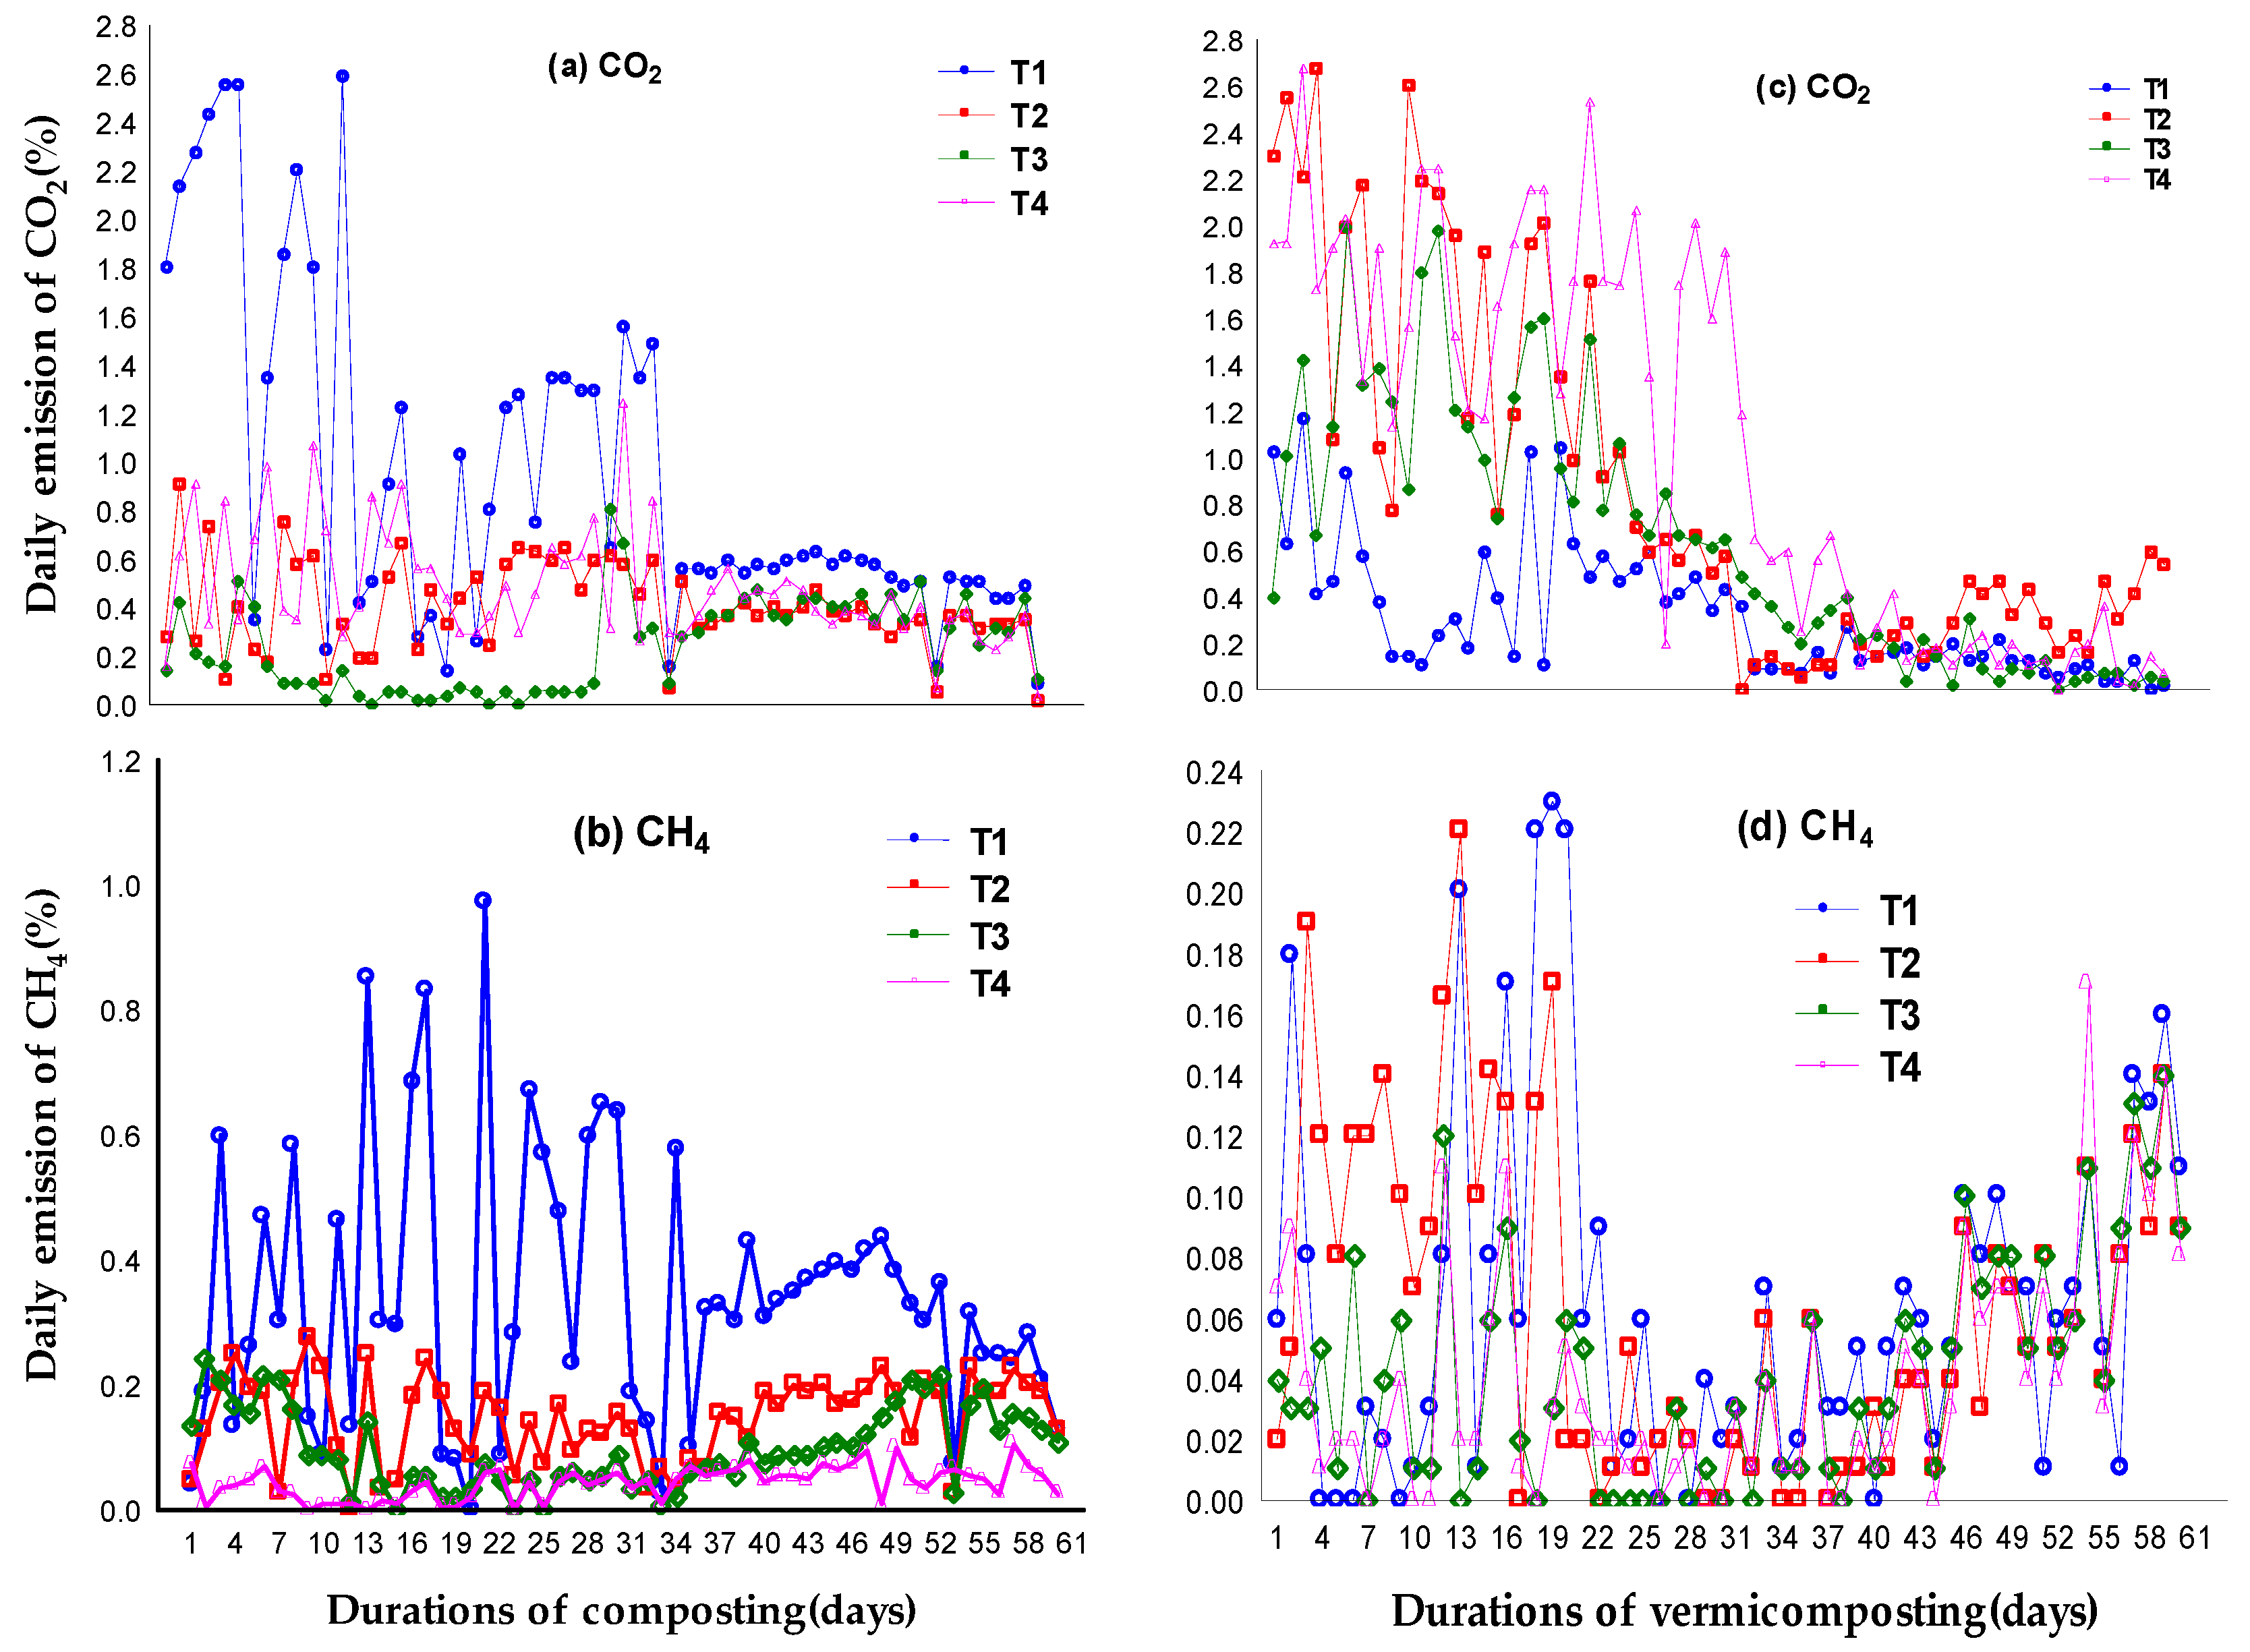
The CO2 emissions increased at the beginning of composting and vermicomposting (Figure 2a,c) because of the rapid degradation of easily degradable organic matter, and thereafter gradually decreased until the end of composting/vermicomposting. This finding echoed the findings reported by Awasthi et al. [21] and Meng et al. [6] during the composting of sewage sludge. During the first 13 days, the CO2 emissions in the control (T1) were higher than the other treatments (T2, T3, and T4) during composting. However, the CO2 emissions in T1 were lower during vermicomposting. This result was possibly because the earthworms inhibited the microbial activity and reduced the readily available OM [22]. Significant differences were found between the four treatments and the composting/vermicomposting process (p < 0.001). These findings indicated that pelletized wheat straw may be lost in the inhibition after the thermophilic stage, most likely due to self-degradation at a high temperature [23]. The temperature and pH of T1, T2, T3, and T4 also supported this conclusion. A sharp drop in CO2 emissions on day 14 and a small peak on day 20 appeared in all treatments (Figure 2a).

Figure 2.
Daily emissions of CO2 and methane CH4 during composting (a,b) and vermicomposting (c,d).
This observation could be attributed to the anaerobic environment caused by the strong degradation of OM during the first 14 days. The subsequent turn on day 10 destroyed the anaerobic conditions. Similar results were also reported in previous studies [21] for sewage sludge composting.
3.3.2. Methane (CH4)
CH4 from all treatments during the composting and vermicomposting processes is displayed in Figure 2b,d. The results of this study showed that the CH4 concentrations for all treatments peaked relatively early in both the composting and vermicomposting processes within 1–3 weeks, after which the emission rates gradually declined until the end of the experiment. Therefore, it could also be assumed that the CH4 emissions should also be the highest during the start of the process. Several researchers reported similar findings, namely, that the highest levels of CH4 emissions occur at the start of the composting and vermicomposting processes [24]. CH4, a major GHG generated during composting and vermicomposting, is a significant contributor to global warming. The production of CH4 is attributed to the methanogen deoxidization of CO2/H2 and acetic acid under low oxygen conditions [25].
Thereafter, as the organic matter (OM) decomposed and oxygen was replenished through turning, the CH4 emissions of all treatments declined sharply and remained at a low level during the maturation phase of composting and vermicomposting. The pattern of CH4 emissions observed resembled the patterns reported by Ma et al. [26] and Wang et al. [27]. As micro-organisms can rapidly degrade organics in the thermophilic phase, a dramatic reduction in O2 levels could be observed in the compost [28]. In all treatments, the emission of CH4 was higher during composting than vermicomposting, and the higher results were measured in the control area.
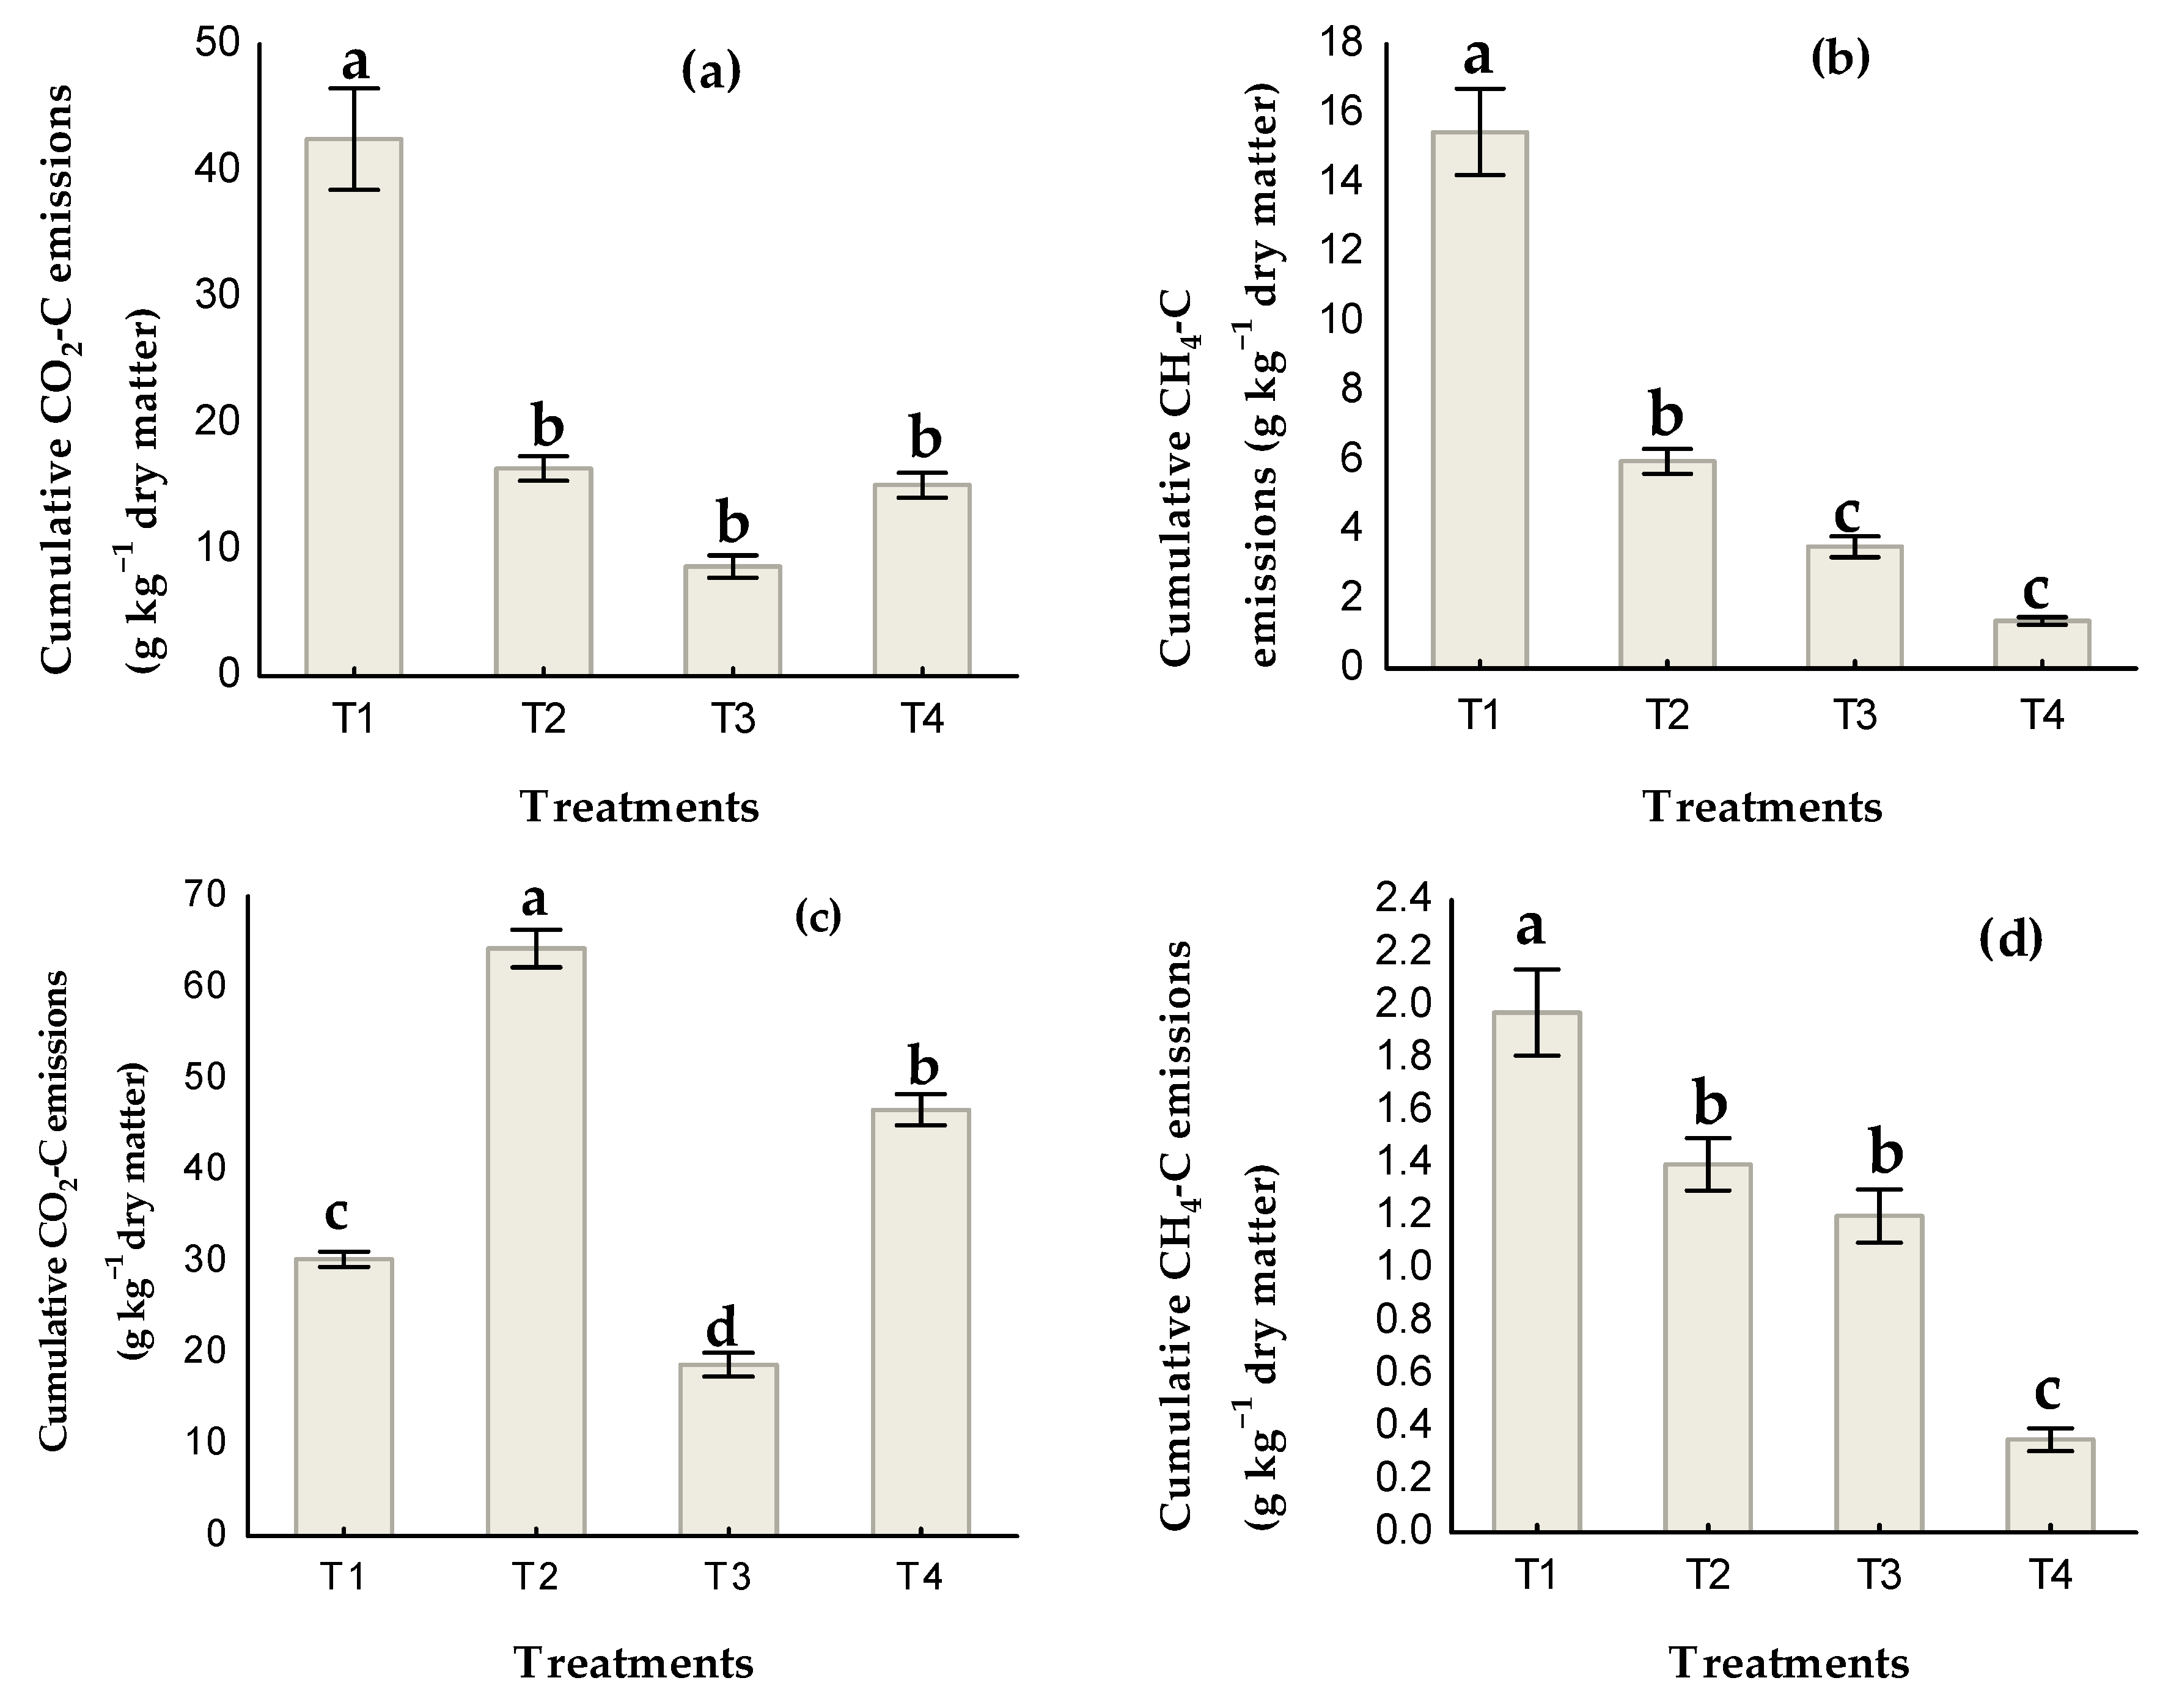
The total cumulative CO2 differed by the composting method (p < 0.001), as did their interaction (p < 0.001) (Figure 3). Vermicomposting increased the total cumulative CO2 emissions when compared to thermophilic composting. Composting had an effect on the total cumulative CH4 emissions (p < 0.001). Vermicomposting decreased CH4 emissions by 74.5% from a high proportion of pelletized wheat straw in T4 compared to thermophilic composting.
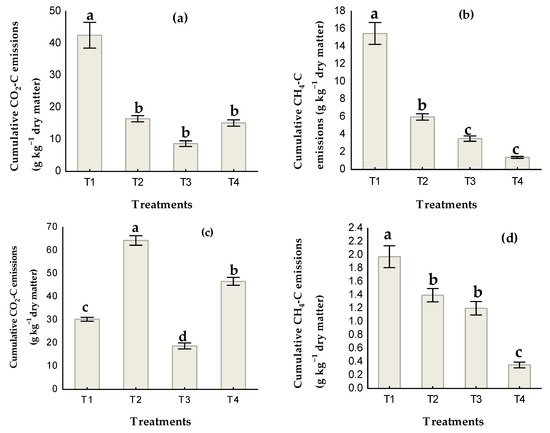
Figure 3.
Total cumulative emissions of CO2-C (a) and CH4-C (b) after 60 days of composting, and CO2-C (c) and CH4-C (d) during vermicomposting. The bars indicate the standard error of the mean (n = 3). Different letters indicate significant differences among the treatments (p < 0.05).
3.4. Total Organic Carbon (TOC), Total Nitrogen (TN) and the C:N Ratio
The TOC, TN, and C:N ratio content for all treatments is presented in Table 3. It can be seen that the TOC and C:N contents decreased in both the compost and the vermicompost compared to the initial treatments. However, the TN content increased in both the compost and the vermicompost. The increase in TN content was caused by the loss of ammonia volatilization at relatively high temperatures and a pH that was not suitable for nitrification and denitrification [29]. Zhang et al. [30] attributed the increase in TN during the vermicomposting of sludge to the activity of worms. The C:N ratio for all treatments decreased with both the composting and vermicomposting processes. The C:N ratio indicates the maturity of the compost/vermicompost as it reflects the stabilization and mineralization rates during vermicomposting [31]. Our results were corroborated by a previous study [32], which reported up to a 50.86% and 48.8% reduction in the C:N ratio during the vermicomposting of cow dung and cow dung with vegetable waste, respectively. The final C:N ratio recorded for all the treatments was within the recommended value for soil applications (<20) [33].
4. Conclusions
The composting and vermicomposting processes of sewage sludge emitted a considerable amount of CH4 and CO2, the main environmental threat to global climate change. The highest values were at the beginning of the experiment and gradually decreased. The emission of CH4 and CO2 during composting and vermicomposting is linked to the fate of C present in the waste substrate. Vermicomposting reduced CH4 emissions and accelerated the decomposition process. The addition of different proportions of pelletized wheat straw increased the CO2 and CH4 emissions during composting. Vermicomposting increased the CO2 emissions, implying that the vermicompost was at a more advanced stage of decomposition than the thermophilic compost. From this finding, as an additive of pelletized wheat straw, both composting and vermicomposting processes are recommended depending on the target gas to be reduced.
Institutional Review Board Statement
Not applicable.
Informed Consent Statement
Not applicable.
Data Availability Statement
The datasets developed during the current study are available from the corresponding author on reasonable request.
Acknowledgments
Financial support for this work was provided by the Ministry of Agriculture of the Czech Republic under the NAZV project number QK1910095.
Conflicts of Interest
The authors declare no conflict of interest.
References
- Lv, B.; Di, Z.; Cui, Y.; Yin, F. Effects of C/N ratio and earthworms on greenhouse gas emissions during vermicomposting of sewage sludge. Bioresour. Technol. 2018, 268, 408–414. [Google Scholar] [CrossRef]
- Sadef, Y.; Poulsen, T.G.; Habib, K.; Iqbal, T.; Nizami, A.S. Uncertainty in degradation rates for organic micro-pollutants during full-scale sewage sludge composting. Waste Manag. 2016, 56, 396–402. [Google Scholar] [CrossRef]
- He, C.; Chen, C.L.; Giannis, A.; Yang, Y.; Wang, J.Y. Hydrothermal gasification of sewage sludge and model compounds for renewable hydrogen production: A review. Renew. Sustain. Energy Rev. 2014, 39, 1127–1142. [Google Scholar] [CrossRef]
- NBSC (National Bureau of Statistics of China). China Statistical Yearbook; China Statistics Press: Beijing, China, 2016.
- Jain, M.S.; Jambhulkar, R.; Kalamdhad, A.S. Biochar amendment for batch composting of nitrogen rich organic waste: Effect on degradation kinetics, composting physics and nutritional properties. Bioresour. Technol. 2018, 253, 204–213. [Google Scholar] [CrossRef] [PubMed]
- Meng, L.Q.; Zhang, S.M.; Gong, H.N.; Zhang, X.C.; Wu, C.D.; Li, W.G. Improving sewage sludge composting by addition of spent mushroom substrate and sucrose. Bioresour. Technol. 2018, 253, 197–203. [Google Scholar] [CrossRef] [PubMed]
- IPCC. Climate Change. Mitigation of Climate Change; Cambridge University Press: Cambridge, UK, 2014. [Google Scholar]
- Sun, W.; Deng, L.; Wu, G.; Wu, L.; Han, P.; Miao, Y.; Yao, B. Atmospheric monitoring of methane in Beijing using a mobile observatory. Atmos 2019, 10, 554. [Google Scholar] [CrossRef] [Green Version]
- Wang, J.; Zhang, X.; Xiong, Z. Methane emissions from a rice agroecosystem in South China: Effects of water regime, straw incorporation and nitrogen fertilizer. Nutr. Cycl. Agroecosyst. 2012, 93, 103–112. [Google Scholar] [CrossRef]
- Wu, H.P.; Lai, C.; Zeng, G.M.; Liang, J.; Chen, J.; Xu, J.J.; Dai, J.; Li, X.D.; Liu, J.F.; Chen, M.; et al. The interactions of composting and biochar and their implications for soil amendment and pollution remediation: A review. Critic. Rev. Biotechnol. 2017, 37, 754–764. [Google Scholar] [CrossRef]
- Wang, J.; Hu, Z.; Xu, X.; Jiang, X.; Zheng, B.; Liu, X.; Pan, X.; Kardol, P. Emissions of ammonia and greenhouse gases during combined pre-composting and vermicomposting of duck manure. Waste Manag. 2014, 34, 1546–1552. [Google Scholar] [CrossRef] [PubMed]
- Sharma, K.; Garg, V. Comparative analysis of vermicompost quality produced from rice straw and paper waste employing earthworm Eisenia fetida (Sav.). Bioresour. Technol. 2018, 250, 708–715. [Google Scholar] [CrossRef] [PubMed]
- Balachandar, R.; Baskaran, L.; Yuvaraj, A.; Thangaraj, R.; Subbaiya, R.; Ravindran, B.; Chang, S.W.; Karmegam, N. Enriched pressmud vermicompost production with green manure plants using Eudrilus eugeniae. Bioresour. Technol. 2020, 299, 122578. [Google Scholar] [CrossRef] [PubMed]
- Suthar, S. Pilot-scale vermireactors for sewage sludge stabilization and metal remediation process: Comparison with small-scale vermireactors. Ecol. Eng. 2010, 36, 703–712. [Google Scholar] [CrossRef]
- He, X.; Zhang, Y.; Shen, M.; Zeng, G.; Zhou, M.; Li, M. Effect of vermicomposting on concentration and speciation of heavy metals in sewage sludge with additive materials. Bioresour. Technol. 2016, 218, 867–873. [Google Scholar] [CrossRef] [PubMed]
- Garg, P.; Gupta, A.; Satya, S. Vermicomposting of different types of waste using Eisenia foetida: A comparative study. Bioresour. Technol. 2006, 97, 391–395. [Google Scholar] [CrossRef] [PubMed]
- Tognetti, C.; Laos, F.; Mazzarino, M.J.; Hernandez, M.T. Composting vs. vermicomposting: A comparison of end product quality. Compost Sci. Util. 2005, 13, 6–13. [Google Scholar] [CrossRef]
- El-Haddad, M.E.; Zayed, M.S.; El-Sayed, G.A.M.; Hassanein, M.K.; El-Satar, A.M.A. Evaluation of compost, vermicompost and their teas produced from rice straw as affected by addition of different supplements. Ann. Agric. Sci. 2014, 59, 243–251. [Google Scholar] [CrossRef] [Green Version]
- Ramnarain, Y.I.; Ansari, A.A.; Ori, L. Vermicomposting of different organic materials using the epigeic earthworm Eisenia foetida. Int. J. Recycl. Org. Waste Agric. 2019, 8, 23–36. [Google Scholar] [CrossRef] [Green Version]
- Jadia, C.D.; Fulekar, M.H. Vermicomposting of vegetable wastes: A biophysicochemical process based on hydro-operating bioreactor. Afr. J. Biotechnol. 2008, 7, 3723–3730. [Google Scholar]
- Awasthi, M.K.; Wang, Q.; Huang, H.; Li, R.; Shen, F.; Lahori, A.H.; Wang, P.; Guo, D.; Guo, Z.; Jiang, S.; et al. Effect of biochar amendment on greenhouse gas emission and bio-availability of heavy metals during sewage sludge cocomposting. J. Clean. Prod. 2016, 135, 829–835. [Google Scholar] [CrossRef]
- Zhang, J.Y.; Sui, Q.W.; Li, K.; Chen, M.X.; Tong, J.; Qi, L.; Wei, Y.S. Influence of natural zeolite and nitrification inhibitor on organics degradation and nitrogen transformation during sludge composting. Environ. Sci. Pollut. Res. 2016, 23, 1324–1334. [Google Scholar] [CrossRef] [PubMed]
- Jiang, T.; Ma, X.G.; Tang, Q.; Yang, J.; Li, G.X.; Schuchardt, F. Combined use of nitrification inhibitor and struvite crystallization to reduce the NH3 and N2O emissions during composting. Bioresour. Technol. 2016, 217, 210–218. [Google Scholar] [CrossRef]
- Santos, C.; Fonseca, J.; Aires, A.; Coutinho, J.; Trindade, H. Effect of different rates of spent coffee grounds (SCG) on composting process, gaseous emissions and quality of end-product. Waste Manag. 2017, 59, 37–47. [Google Scholar] [CrossRef]
- Awasthi, M.K.; Wang, Q.; Awasthi, S.K.; Wang, M.J.; Chen, H.Y.; Ren, X.N.; Zhao, J.C.; Zhang, Z.Q. Influence of medical stone amendment on gaseous emissions, microbial biomass and abundance of ammonia oxidizing bacteria genes during biosolids composting. Bioresour. Technol. 2018, 247, 970–979. [Google Scholar] [CrossRef] [PubMed]
- Ma, S.; Fang, C.; Sun, X.; Han, L.; He, X.; Huang, G. Bacterial community succession during pig manure and wheat straw aerobic composting covered with a semi-permeable membrane under slight positive pressure. Bioresour. Technol. 2018, 259, 221–227. [Google Scholar] [CrossRef] [PubMed]
- Wang, Q.; Awasthi, M.K.; Ren, X.N.; Zhao, J.C.; Li, R.H.; Wang, Z.; Wang, M.J.; Chen, H.Y.; Zhang, Z.Q. Combining biochar, zeolite and wood vinegar for composting of pig manure: The effect on greenhouse gas emission and N conservation. Waste Manag. 2018, 74, 221–223. [Google Scholar] [CrossRef]
- Manios, T.; Maniadakis, K.; Boutzakis, P.; Naziridis, Y.; Lasaridi, K.; Markakis, G.; Stentiford, E.I. Methane and carbon dioxide emission in a two-phase olive oil mill sludge windrow pile during composting. Waste Manag. 2007, 27, 1092–1098. [Google Scholar] [CrossRef]
- Awasthi, M.K.; Wang, M.J.; Chen, H.Y.; Wang, Q.; Zhao, J.C.; Ren, X.N.; Li, D.S.; Awasthi, S.K.; Shen, F.; Li, R.H.; et al. Heterogeneity of biochar amendment to improve the carbon and nitrogen sequestration through reduce the greenhouse gases emissions during sewage sludge composting. Bioresour. Technol. 2017, 224, 428–438. [Google Scholar] [CrossRef]
- Zhang, J.; Sugir, M.E.; Li, Y.; Yuan, L.; Zhou, M.; Lv, P.; Yu, Z.; Wang, L.; Zhou, D. Effects of vermicomposting on the main chemical properties and bioavailability of Cd/Zn in pure sludge. Environ. Sci. Pollut. Res. 2019, 26, 20949–20960. [Google Scholar] [CrossRef]
- Srivastava, V.; Goel, G.; Thakur, V.K.; Singh, R.P.; Ferreira de Araujo, A.S.; Singh, P. Analysis and advanced characterization of municipal solid waste vermicompost maturity for a green environment. J. Environ. Manag. 2020, 255, 109914. [Google Scholar] [CrossRef] [PubMed]
- Biruntha, M.; Karmegam, N.; Archana, J.; Karunai Selvi, B.; John Paul, J.A.; Balamuralikrishnan, B.; Chang, S.W.; Ravindran, B. Vermiconversion of biowastes with low-to-high C/N ratio into value added vermicompost. Bioresour. Technol. 2020, 297, 122398. [Google Scholar] [CrossRef]
- Esmaeili, A.; Khoram, M.R.; Gholami, M.; Eslami, H. Pistachio waste management using combined composting-vermicomposting technique: Physico-chemical changes and worm growth analysis. J. Clean. Prod. 2020, 242, 118523. [Google Scholar] [CrossRef]
Publisher’s Note: MDPI stays neutral with regard to jurisdictional claims in published maps and institutional affiliations. |
© 2021 by the authors. Licensee MDPI, Basel, Switzerland. This article is an open access article distributed under the terms and conditions of the Creative Commons Attribution (CC BY) license (https://creativecommons.org/licenses/by/4.0/).