
Spatio-Temporal Assessment of Meteorological Drought in Puerto Rico between 1950 and 2019 †

 ,
,  ,
,  ,
,  ,
,  ,
,  and
and 
Abstract
:1. Introduction
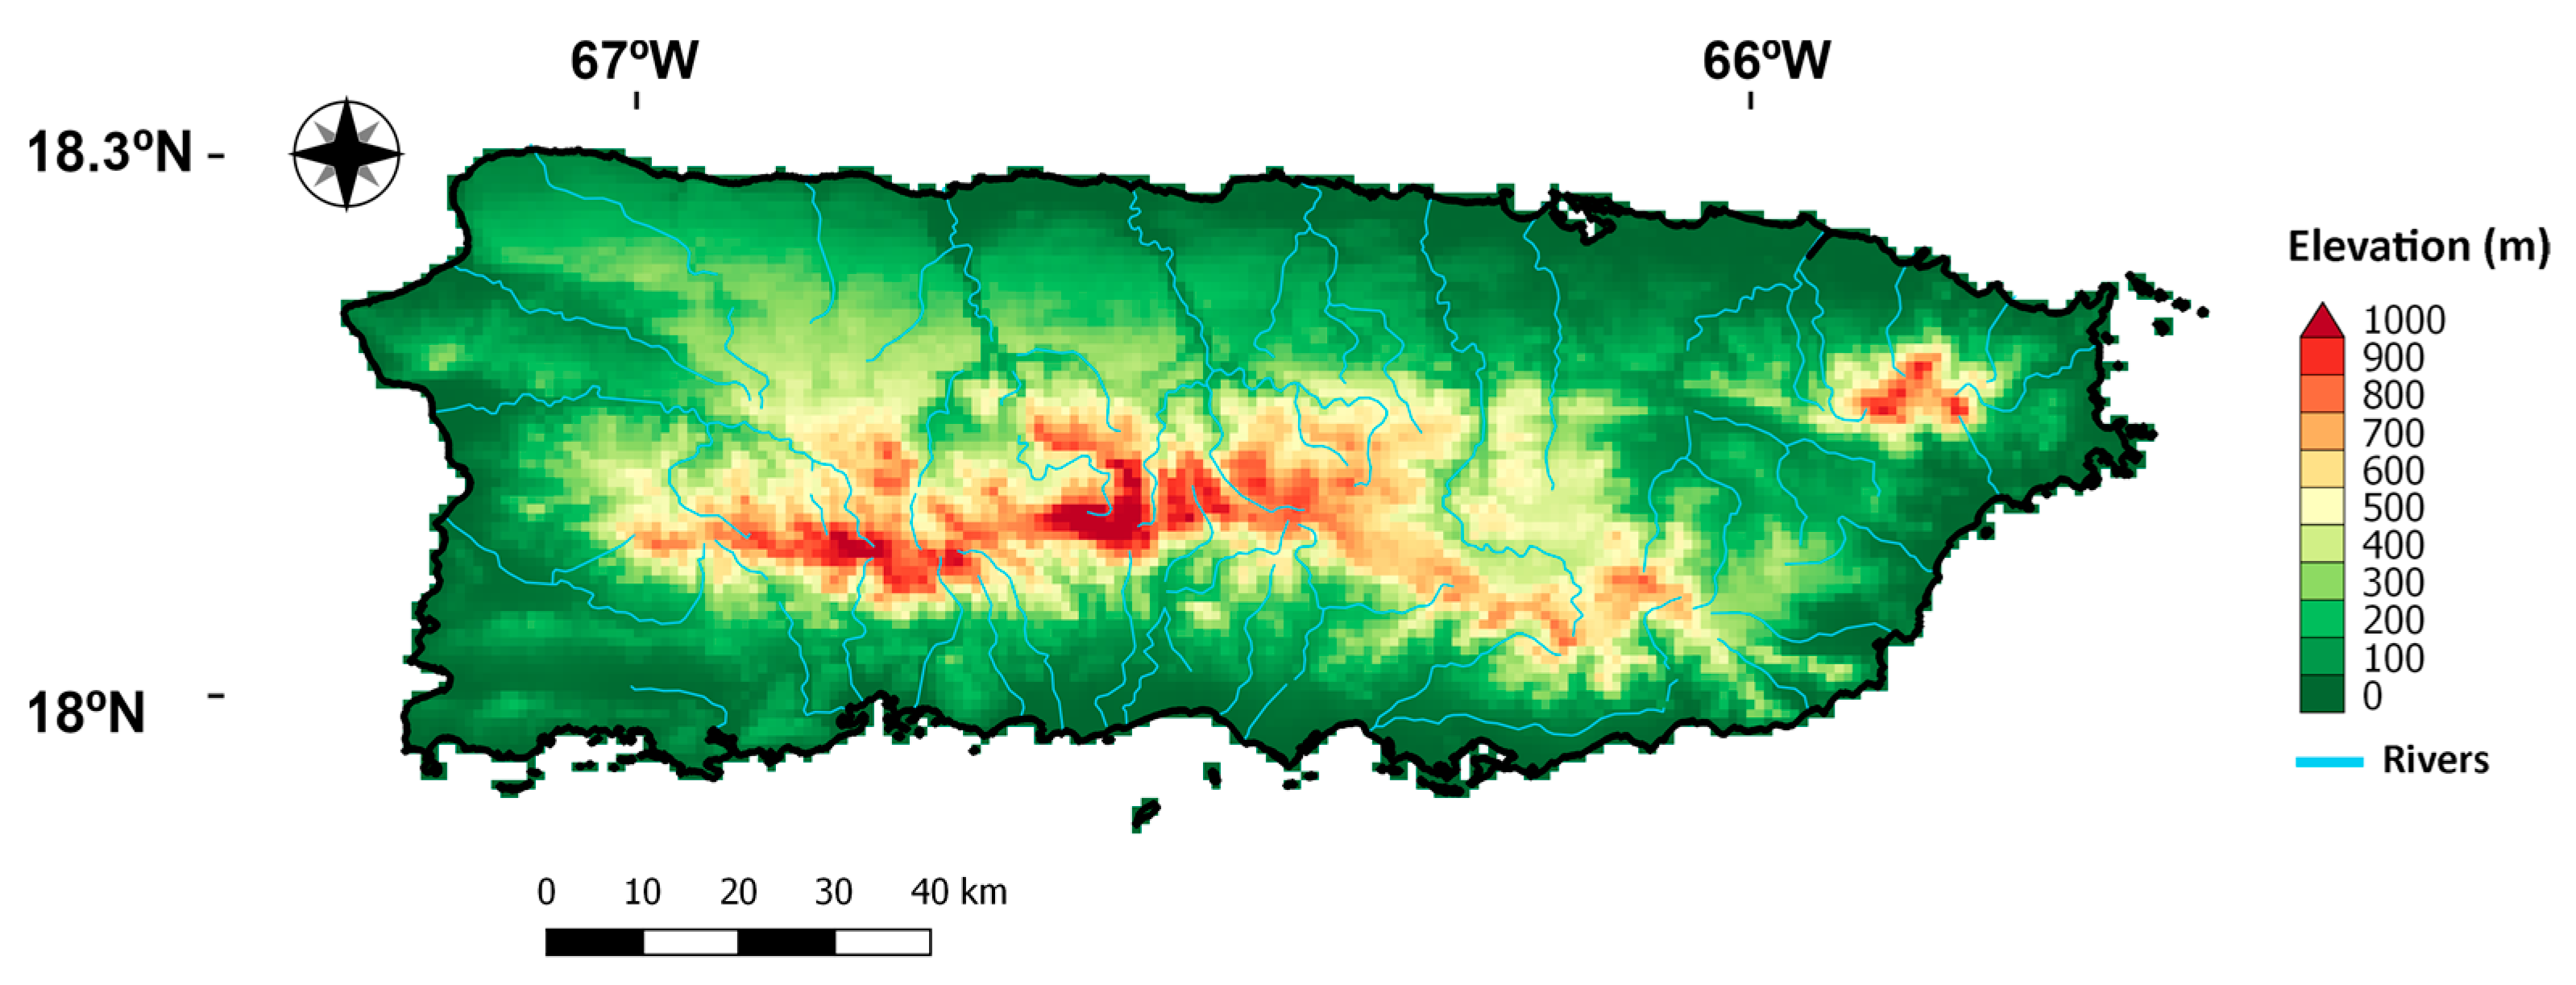
Region of Study
2. Methodology and Data Sets
2.1. Identification of the Drought Episodes: The Standardized Precipitation–Evapotranspiration Index (SPEI)
2.2. Data Sets
3. Results and Discussion
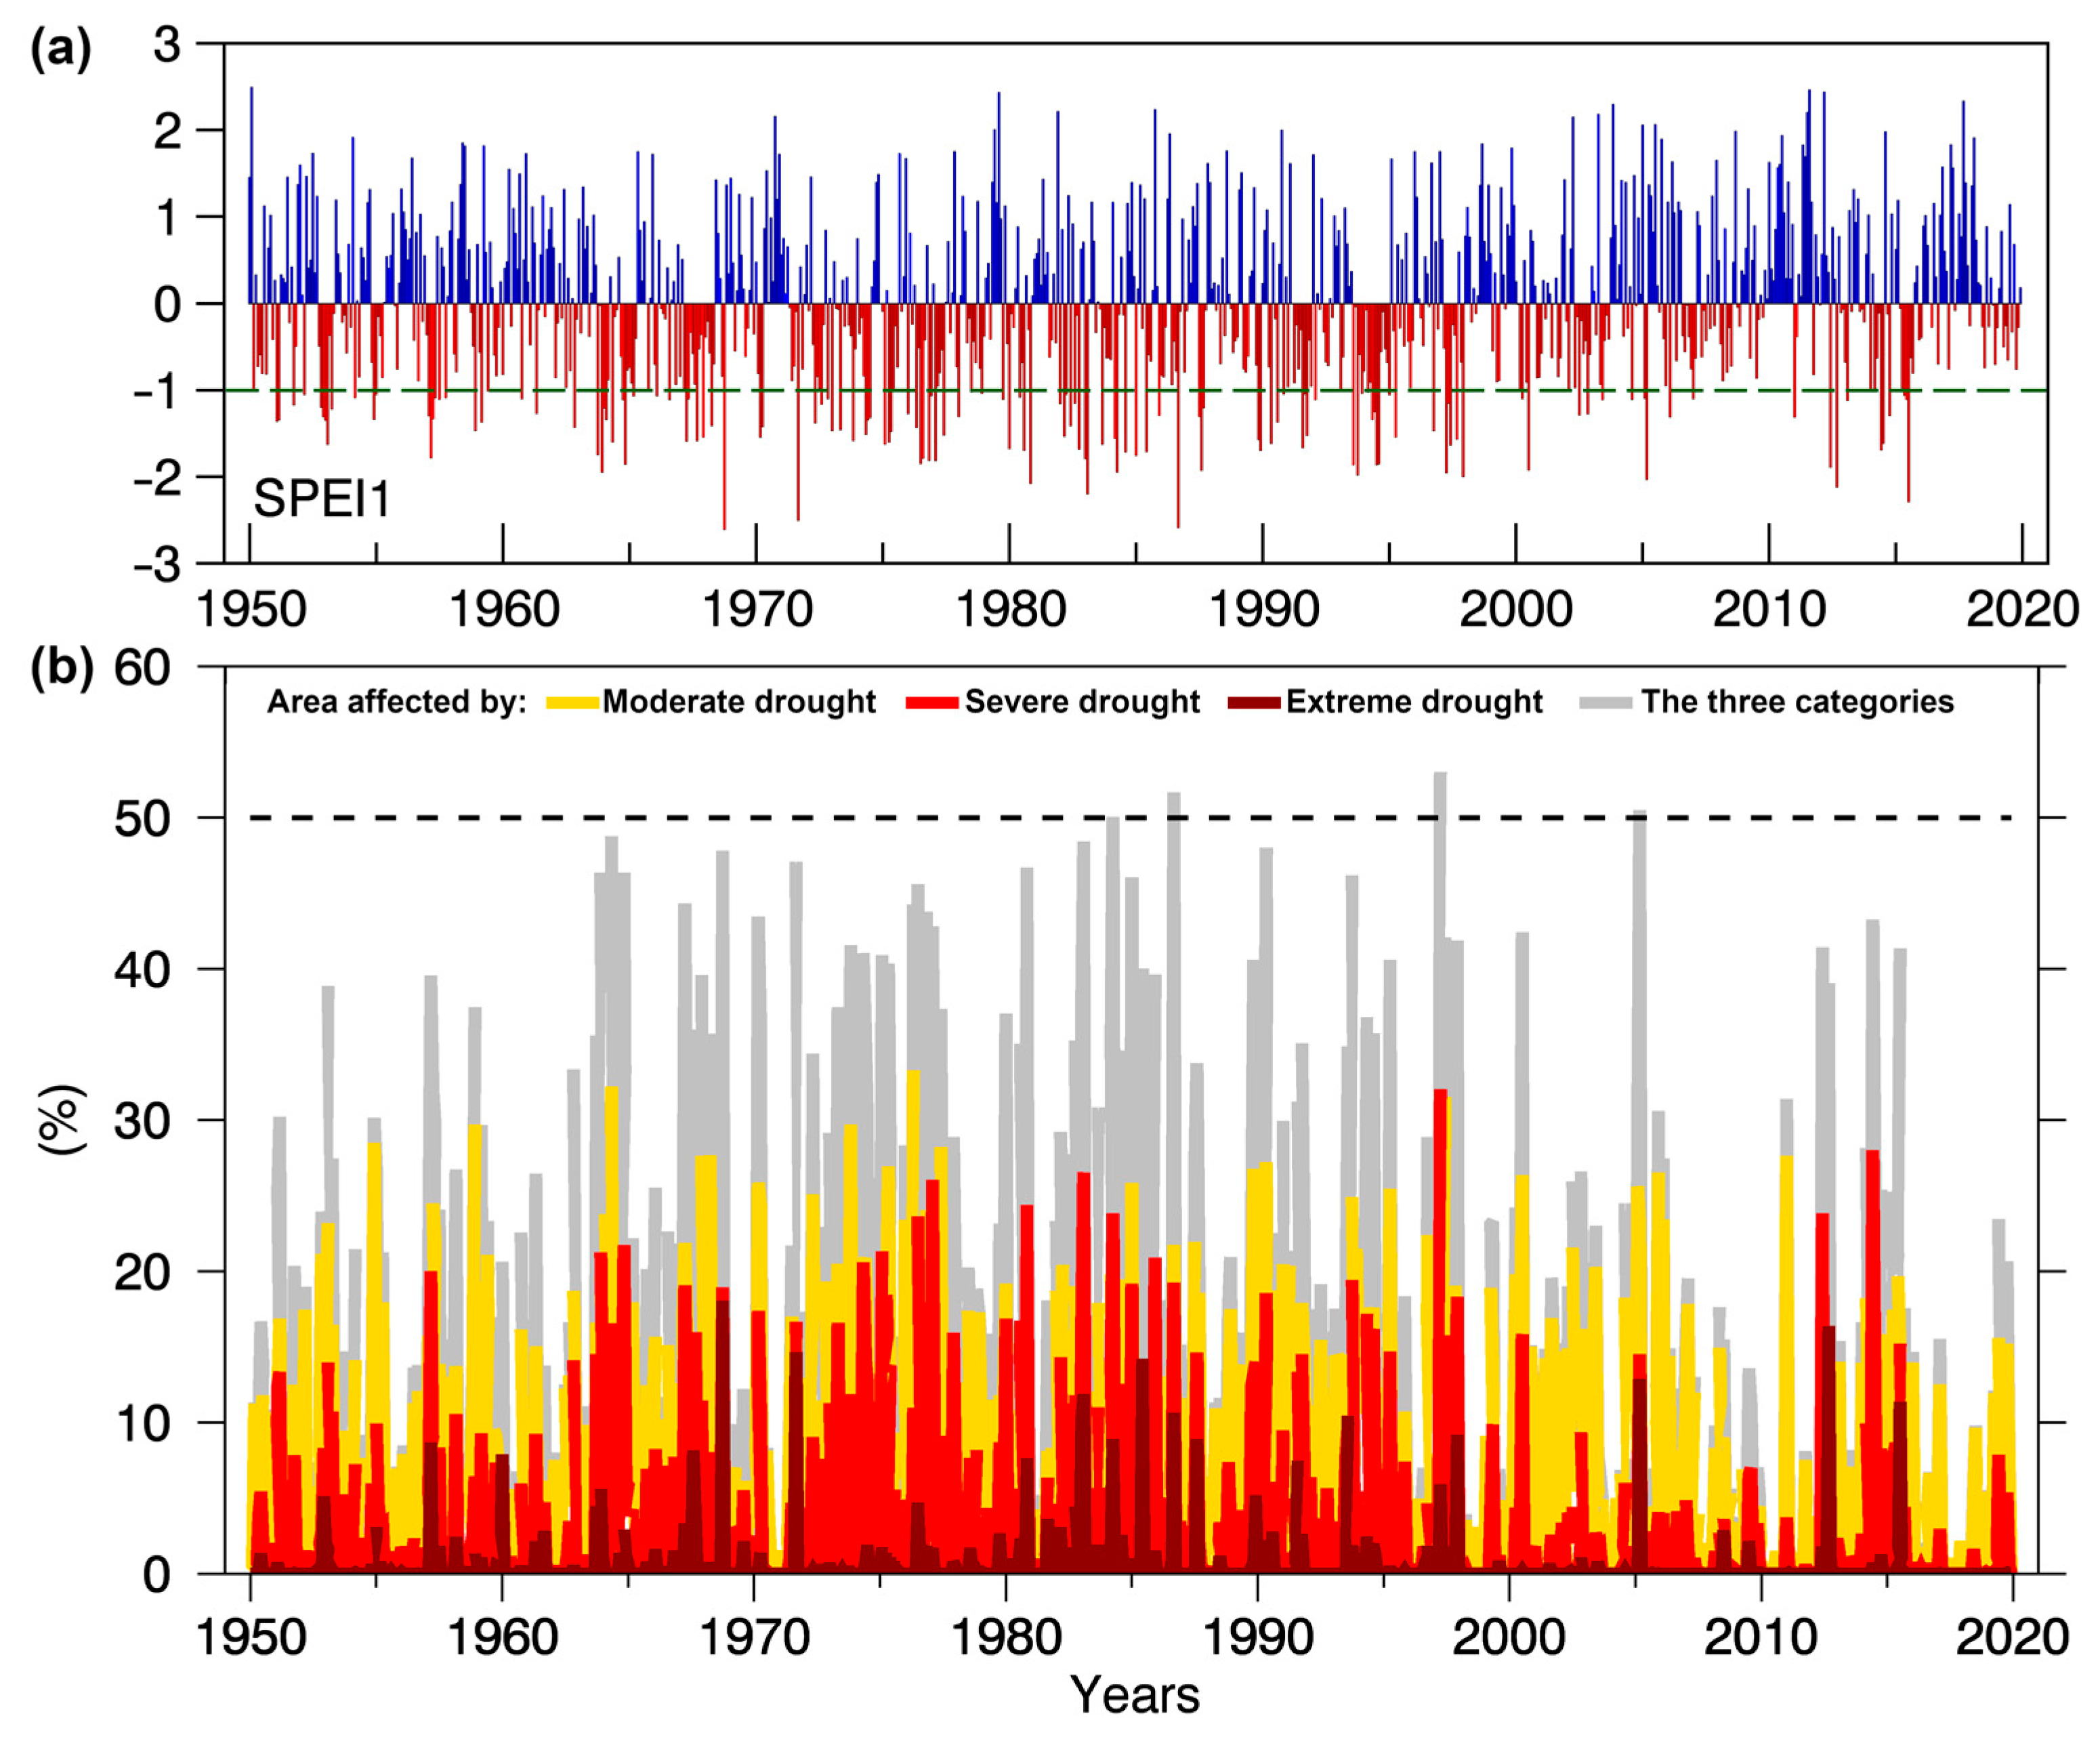
3.1. Temporal Evolution of the SPEI at a 1 Month Temporal Scale
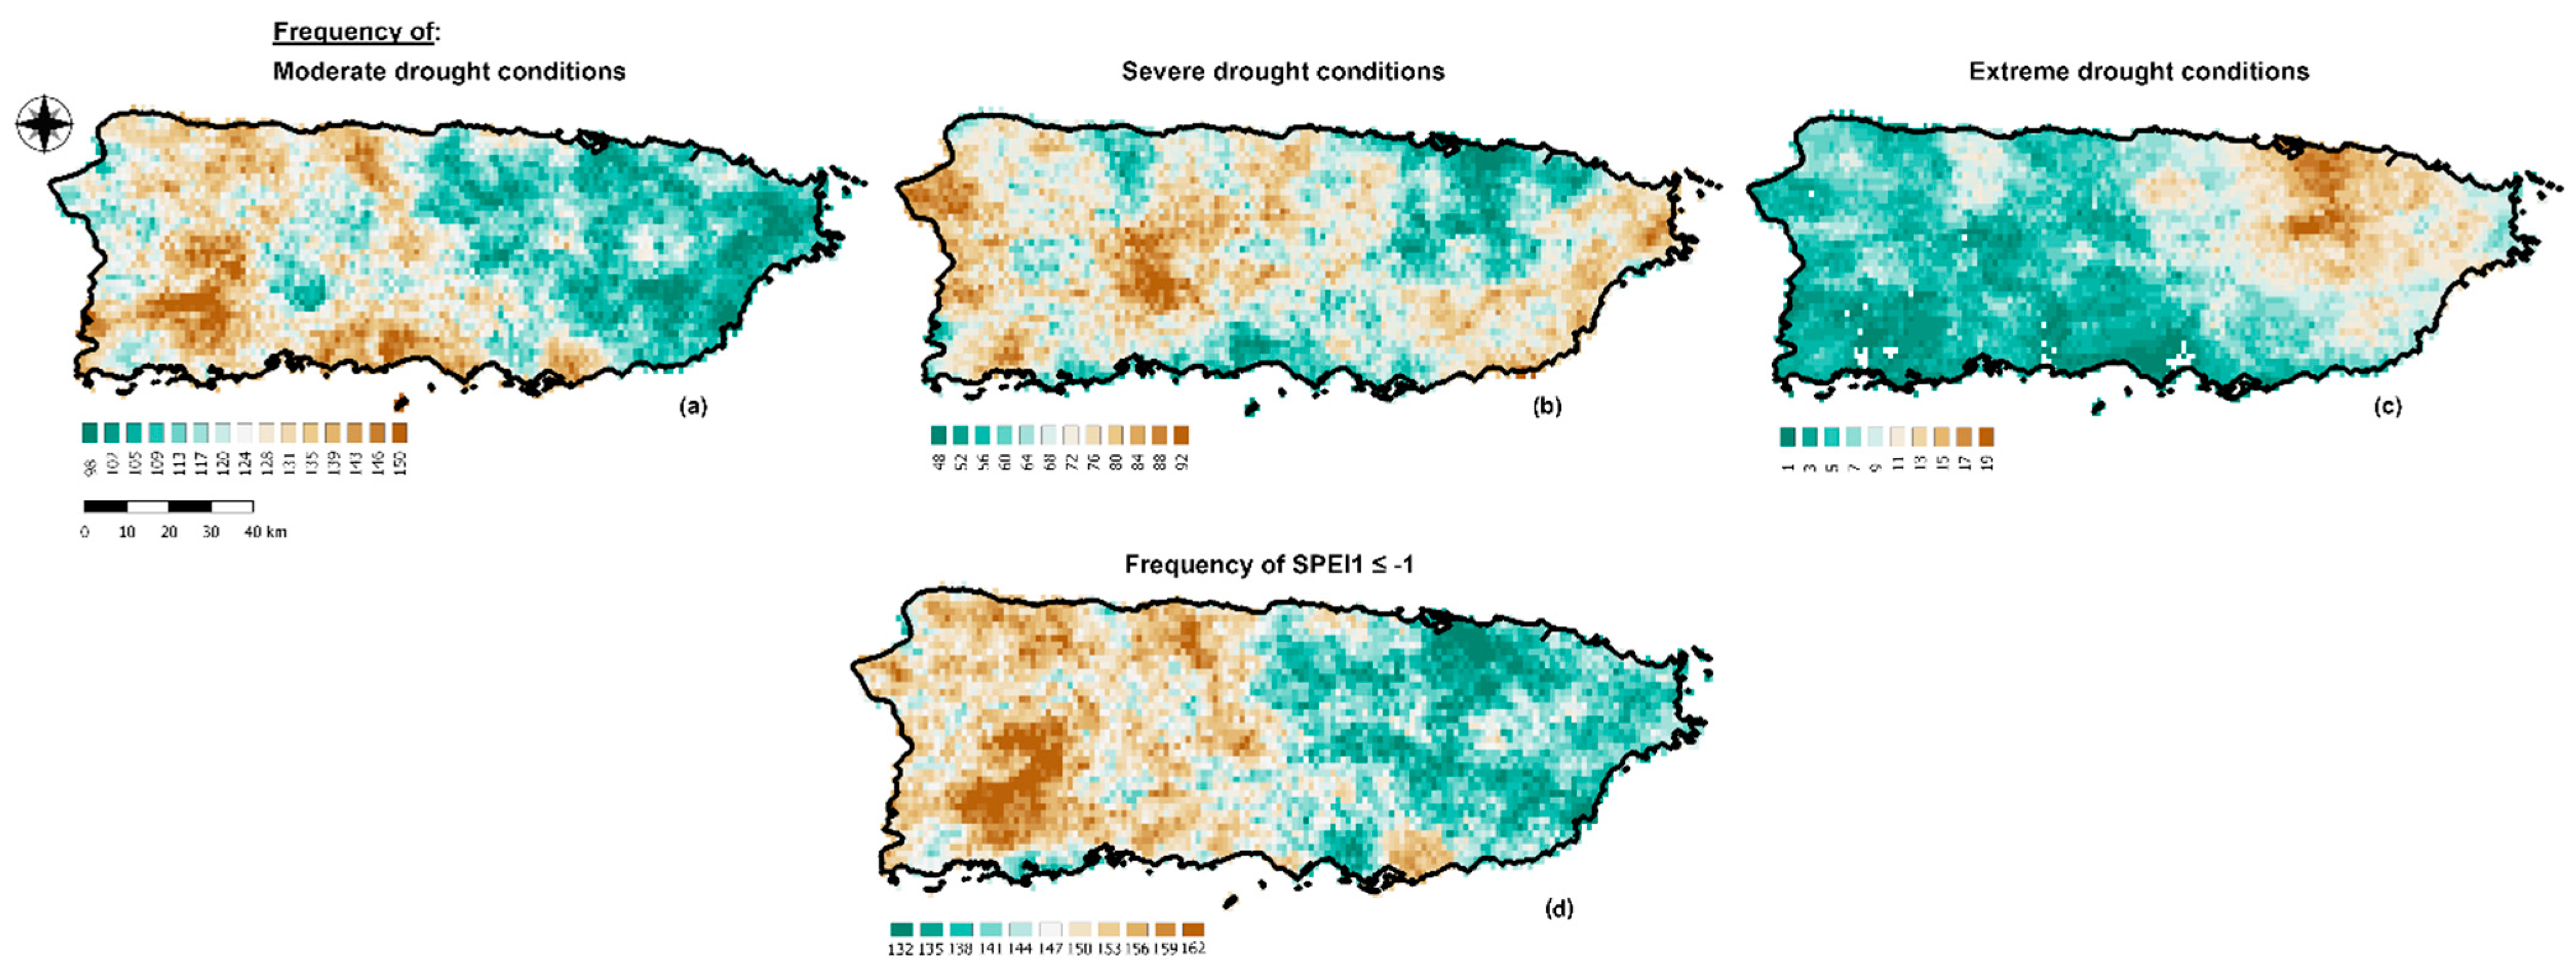
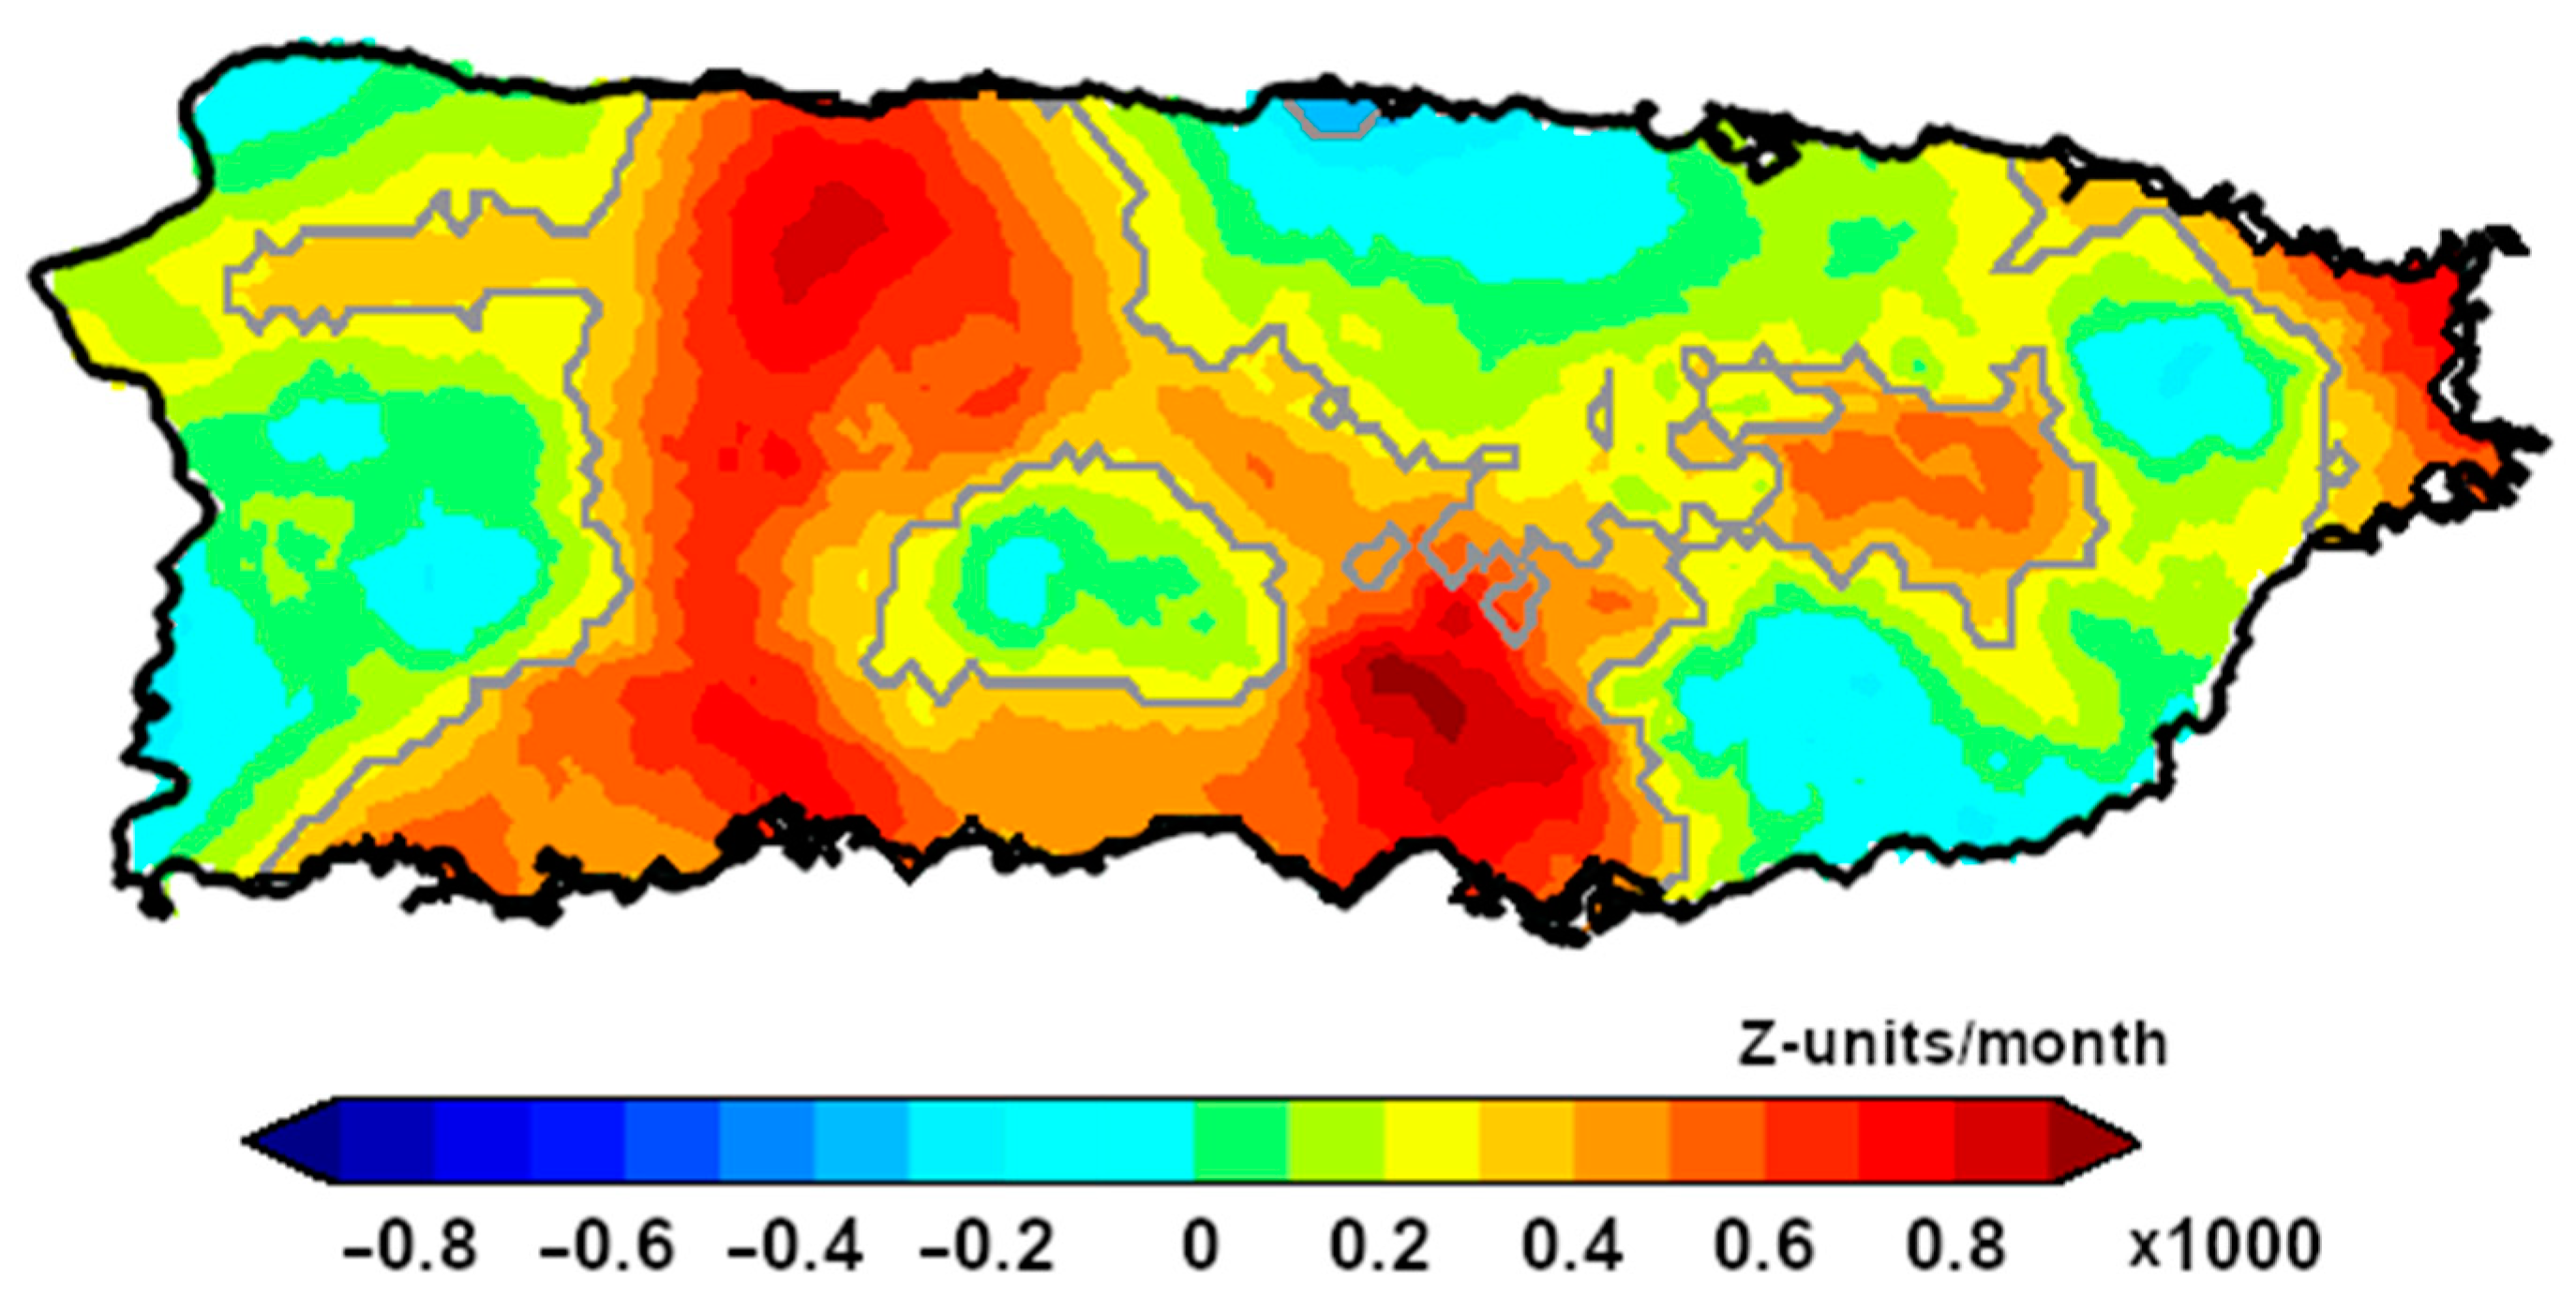
3.2. Spatial Analysis of the SPEI1
4. Conclusions
Author Contributions
Funding
Acknowledgments
Conflicts of Interest
References
- Wilhite, D.A.; Glantz, M.H. Understanding the drought phenomenon: The role of definitions. Water Int. 2015, 10, 111–120. [Google Scholar] [CrossRef] [Green Version]
- Mishra, A.K.; Singh, V.P. A review of drought concepts. J. Hydrol. 2010, 391, 202–216. [Google Scholar] [CrossRef]
- World Meteorological Organization (WMO). International Glossary of Hydrology; WMO: Geneva, Switzerland, 2012; p. 385. [Google Scholar]
- Miralles, D.G.; Gentine, P.; Seneviratne, S.I.; Teuling, A.J. Land-atmospheric feedbacks during droughts and heatwaves: State of the science and current challenges. Ann. N. Y. Acad. Sci. 2019, 1436, 19–35. [Google Scholar] [CrossRef] [PubMed]
- McKee, T.B.; Doesken, N.J.; Kleist, J. The relationship of drought frequency and duration to time scales. In Proceedings of the Eighth Conference on Applied Climatology, Anaheim, CA, USA, 17–22 January 1993; pp. 179–184. [Google Scholar]
- Colon-Dieppa, E.; Torres-Sierra, H. Puerto Rico Floods and Droughts, National Water Summary 1988–1989—Floods and Droughts—State Summaries. In Water-Supply Paper; Geological Survey: Washington, DC, USA, 1991; Volume 2375, pp. 475–482. [Google Scholar]
- Larsen, M.C. Analysis of 20th century rainfall and streamflow to characterize drought and water resources in Puerto Rico. Phys. Geogr. 2000, 21, 494–521. [Google Scholar] [CrossRef]
- Torres-Valcárcel, A.R. Teleconnections between ENSO and rainfall and drought in Puerto Rico. Int. J. Climatol. 2018, 38, e1190–e1204. [Google Scholar] [CrossRef]
- Álvarez-Berríos, N.; Soto-Bayó, S.; Holupchinski, E.; Fain, S.; Gould, W. Correlating drought conservation practices and drought vulnerability in a tropical agricultural system. Renew. Agric. Food Syst. 2018, 33, 279–291. [Google Scholar] [CrossRef] [Green Version]
- Departamento de Recursos Naturales y Ambientales (DRNA). Informe Sobre la Sequía de 2014–2016 en Puerto Rico; División Monitoreo Plan de Aguas: San Juan, Puerto Rico, 2016.
- Méndez-Tejeda, R. Increase in the Number of Hot Days for Decades in Puerto Rico 1950–2014. Environ. Nat. Resour. Res. 2017, 7, 16–26. [Google Scholar] [CrossRef]
- Daly, C.; Helmer, E.H.; Quinones, M. Mapping the climate of Puerto Rico, Vieques and Culebra. Int. J. Climatol. 2003, 23, 1359–1381. [Google Scholar] [CrossRef]
- Miller, G.L.; Lugo, A.E. Guide to the Ecological Systems of Puerto Rico. In General Technical Report IITF-GTR-35; International Institute of Tropical Forestry, United States Department of Agriculture: San Juan, Puerto Rico, 2008; p. 437. [Google Scholar]
- Fernández-Alvarez, J.C.; Sorí, R.; Pérez-Alarcón, A.; Nieto, R.; Gimeno, L. Affectation and Rainfall Contribution of Tropical Cyclones in Puerto Rico from 1980 to 2016. Environ. Sci. Proc. 2021, 4, 30. [Google Scholar] [CrossRef]
- Lehner, B.; Verdin, K.; Jarvis, A. New global hydrography derived from spaceborne elevation data. Eos Trans. AGU 2008, 89, 93–94. [Google Scholar] [CrossRef]
- Vicente-Serrano, S.M.; Begueria, S.; Lopez-Moreno, A.J. A multiscalar drought index sensitive to global warming: The standardized precipitation evapotranspiration index. J. Clim. 2010, 23, 1696–1718. [Google Scholar] [CrossRef] [Green Version]
- Beguería, S.; Vicente-Serrano, S.M.; Gracia, F.R.; Latorre, B. Standardized precipitation evapotranspiration index (SPEI) revisited: Parameter fitting, evapotranspiration models, tools, datasets and drought monitoring. Int. J. Clim. 2014, 34, 3001–3023. [Google Scholar] [CrossRef] [Green Version]
- Vicente-Serrano, S.M.; Beguería, S.; Lorenzo-Lacruz, J.; Camarero, J.J.; López-Moreno, J.I.; Azorin-Molina, C.; Revuelto, J.; Morán-Tejeda, E.; Sanchez-Lorenzo, A. Performance of Drought Indices for Ecological, Agricultural and Hydrological Applications. Earth Interact. 2012, 16, 1–27. [Google Scholar] [CrossRef] [Green Version]
- Hargreaves, G.H.; Samani, Z.A. Reference Crop Evapotranspiration from Temperature. Appl. Eng. Agric. 1985, 1, 96–99. [Google Scholar] [CrossRef]
- Thornton, M.M.; Shrestha, R.; Wei, Y.; Thornton, P.E.; Kao, S.; Wilson, B.E. Daymet: Monthly Climate Summaries on a 1-km Grid for North America, Version 4; ORNL DAAC: Oak Ridge, TN, USA, 2020.
- Menne, M.J.; Durre, I.; Korzeniewski, B.; McNeal, S.; Thomas, K.; Yin, X.; Anthony, S.; Ray, R.; Vose, R.S.; Gleason, B.E.; et al. Global Historical Climatology Network—Daily (GHCN-Daily), Version 3; Version 3.27-upd-2020020523; NOAA National Climatic Data Center: USA, 2012.
- Menne, M.J.; Durre, I.; Vose, R.S.; Gleason, B.E.; Houston, T.G. An Overview of the Global Historical Climatology Network-Daily Database. J. Atmos. Ocean. Technol. 2012, 29, 897–910. [Google Scholar] [CrossRef]
- Miller, P.W.; Mote, T.L.; Ramseyer, C.A. An Empirical Study of the Relationship between Seasonal Precipitation and Thermodynamic Environment in Puerto Rico. Weather. Forecast. 2019, 34, 277–288. [Google Scholar] [CrossRef]
- Jury, M.R. Resolution-Dependent Perspectives on Caribbean Hydro-Climate Change. Hydrology 2020, 7, 93. [Google Scholar] [CrossRef]
- Hernández-Ayala, J.J.; Heslar, M. Examining the spatiotemporal characteristics of droughts in the Caribbean using the standardized precipitation index (SPI). Clim. Res. 2019, 78, 103–116. [Google Scholar] [CrossRef]
- Herrera, D.; Ault, T. Insights from a New High-Resolution Drought Atlas for the Caribbean Spanning 1950–2016. J. Clim. 2017, 30, 7801–7825. [Google Scholar] [CrossRef]
- Gómez-Gómez, F.; Rodríguez-Martínez, J.; Santiago, M. Hydrogeology of Puerto Rico and the Outlying Islands of Vieques, Culebra, and Mona; US Department of the Interior, US Geological Survey: Washington, DC, USA, 2014.
- Van Beusekom, A.E.; González, G.; Rivera, M.M. Short-Term Precipitation and Temperature Trends along an Elevation Gradient in Northeastern Puerto Rico. Earth Interact. 2015, 19, 1–33. [Google Scholar] [CrossRef] [Green Version]


| SPEI Values | Drought Category |
|---|---|
| 0 to −0.99 | Mild |
| −1 to −1.49 | Moderate |
| −1.50 to −1.99 | Severe |
| ≤−2 | Extreme |
| No. | Onset | End | D | S | P | No | Onset | End | D | S | P | No | Onset | End | D | S | P |
|---|---|---|---|---|---|---|---|---|---|---|---|---|---|---|---|---|---|
| 1 | Mar-50 | Mar-50 | 1 | 1.0 | −1.0 | 30 | Sep-73 | Dec-73 | 4 | 2.7 | −1.6 | 59 | Apr-90 | May-90 | 2 | 2.4 | −1.6 |
| 2 | Feb-51 | Mar-51 | 2 | 2.7 | −1.4 | 31 | Feb-74 | Jul-74 | 6 | 5.5 | −1.5 | 60 | Jul-90 | Aug-90 | 2 | 1.5 | −1.4 |
| 3 | Oct-51 | Nov-51 | 2 | 1.7 | −1.2 | 32 | Dec-74 | Feb-75 | 3 | 1.7 | −1.6 | 61 | Nov-90 | Nov-90 | 1 | 1.0 | 1.0 |
| 4 | Mar-52 | Mar-52 | 1 | 1.1 | −1.1 | 33 | Apr-75 | Aug-75 | 5 | 5.1 | −1.6 | 62 | Mar-91 | Dec-91 | 10 | 7.9 | −1.7 |
| 5 | Oct-52 | May-53 | 8 | 7.7 | −1.6 | 34 | Jan-76 | Jan-76 | 1 | 1.3 | −1.3 | 63 | Feb-92 | Feb-92 | 1 | 1.1 | −1.1 |
| 6 | Mar-54 | Mar-54 | 1 | 1.1 | −1.1 | 35 | May-76 | Sep-76 | 5 | 6.0 | −1.9 | 64 | Aug-93 | Jan-95 | 18 | 17.6 | −2.0 |
| 7 | Nov-54 | Apr-55 | 6 | 4.5 | −1.3 | 36 | Nov-76 | Dec-76 | 2 | 2.9 | −1.8 | 65 | Mar-95 | Apr-95 | 2 | 1.9 | −1.5 |
| 8 | Jan-57 | May-57 | 5 | 5.9 | −1.8 | 37 | Feb-77 | Jun-77 | 5 | 5.6 | −1.8 | 66 | Oct-96 | Oct-96 | 1 | 1.5 | 1.5 |
| 9 | Jul-57 | Jul-57 | 1 | 1.1 | −1.1 | 38 | Dec-77 | Jan-78 | 2 | 2.0 | −1.3 | 67 | Mar-97 | Sep-97 | 7 | 7.5 | −2.0 |
| 10 | Oct-57 | Oct-57 | 1 | 1.1 | −1.1 | 39 | May-78 | Sep-78 | 5 | 2.8 | −1.0 | 68 | Nov-97 | Dec-97 | 2 | 2.7 | 1.3 |
| 11 | Oct-58 | Dec-58 | 3 | 2 | −1.5 | 40 | Nov-78 | Jan-79 | 3 | 2.2 | −1.0 | 69 | Feb-00 | Apr-00 | 3 | 2.1 | −1.1 |
| 12 | Dec-59 | Mar-59 | 2 | 1.9 | −1.4 | 41 | Oct-79 | Oct-79 | 1 | 1.1 | −1.1 | 70 | Jun-00 | Jul-00 | 2 | 2.8 | −1.9 |
| 13 | Jun-59 | Jun-59 | 1 | 1 | −1 | 42 | Dec-79 | Mar-80 | 4 | 2.5 | −1.7 | 71 | Jan-02 | Feb-02 | 2 | 1.2 | −1.0 |
| 14 | Oct-60 | Oct-60 | 1 | 1.1 | −1.1 | 43 | Jun-80 | Aug-80 | 3 | 3.5 | −1.7 | 72 | May-02 | Dec-02 | 8 | 5.5 | −1.3 |
| 15 | May-61 | Jun-61 | 2 | 1.4 | −1.3 | 44 | Oct-80 | Nov-80 | 2 | 2.4 | −2.1 | 73 | May-03 | Sep-03 | 5 | 3.0 | −1.1 |
| 16 | Nov-62 | Dec-62 | 2 | 1.6 | −1.4 | 45 | Jan-82 | Jan-82 | 1 | 1.2 | −1.2 | 74 | Aug-04 | Aug-04 | 1 | 1.1 | −1.1 |
| 17 | Oct-63 | Mar-64 | 6 | 7.2 | −1.9 | 46 | Mar-82 | Apr-82 | 2 | 2.6 | −1.5 | 75 | Feb-05 | Mar-05 | 2 | 3.1 | −2.0 |
| 18 | May-64 | Jul-64 | 3 | 1.8 | −1.6 | 47 | Jun-82 | Jun-82 | 1 | 1.4 | −1.4 | 76 | Feb-06 | Feb-06 | 1 | 1.3 | −1.3 |
| 19 | Sep-64 | Apr-65 | 8 | 7.5 | −1.9 | 48 | Aug-82 | Oct-82 | 3 | 3.0 | −1.7 | 77 | Aug-06 | Feb-07 | 7 | 3.8 | −1.1 |
| 20 | Jan-66 | Feb-66 | 2 | 1.8 | −1.1 | 49 | Jan-83 | Feb-83 | 2 | 4.0 | −2.2 | 78 | Jan-11 | Feb-11 | 2 | 1.7 | −1.3 |
| 21 | Aug-66 | Aug-66 | 1 | 1.1 | −1.1 | 50 | Aug-83 | Jan-84 | 6 | 3.9 | −1.6 | 79 | Jun-12 | Jun-12 | 1 | 1.9 | −1.9 |
| 22 | Mar-67 | May-68 | 15 | 12.8 | −1.6 | 51 | Mar-84 | May-84 | 3 | 3.6 | −1.9 | 80 | Sep-12 | Sep-12 | 1 | 2.1 | −2.1 |
| 23 | Sep-68 | Oct-68 | 2 | 3.5 | −2.6 | 52 | Jul-84 | Aug-84 | 2 | 1.9 | −1.7 | 81 | Nov-12 | Feb-13 | 4 | 2.0 | 0.5 |
| 24 | Feb-70 | Apr-70 | 3 | 3.8 | −1.5 | 53 | Jan-85 | Jan-85 | 1 | 1.8 | −1.8 | 82 | Jan-14 | Jan-14 | 1 | 1.0 | −1.0 |
| 25 | May-71 | Sep-71 | 5 | 4.3 | −2.5 | 54 | Jun-85 | Aug-85 | 3 | 3.0 | −1.7 | 83 | Mar-14 | Jul-14 | 5 | 5.1 | −1.7 |
| 26 | Apr-72 | Sep-72 | 6 | 5.1 | −1.4 | 55 | Dec-85 | Mar-86 | 4 | 3.2 | 0.8 | 84 | Sep-14 | Oct-14 | 2 | 1.4 | −1.3 |
| 27 | Nov-72 | Nov-72 | 1 | 1.1 | −1.1 | 56 | Jun-86 | Oct-86 | 5 | 4.8 | −2.6 | 85 | Mar-15 | Sep-15 | 7 | 6.9 | −2.3 |
| 28 | Jan-73 | Jan-73 | 1 | 1.5 | −1.5 | 57 | Jul-87 | Oct-87 | 4 | 4.5 | −1.9 | ||||||
| 29 | Mar-73 | May-73 | 3 | 1.6 | −1.5 | 58 | Oct-89 | Dec-89 | 3 | 3.9 | 1.3 |
Publisher’s Note: MDPI stays neutral with regard to jurisdictional claims in published maps and institutional affiliations. |
© 2021 by the authors. Licensee MDPI, Basel, Switzerland. This article is an open access article distributed under the terms and conditions of the Creative Commons Attribution (CC BY) license (https://creativecommons.org/licenses/by/4.0/).
Share and Cite
Sorí, R.; Méndez-Tejeda, R.; Stojanovic, M.; Fernández-Alvarez, J.C.; Pérez-Alarcón, A.; Nieto, R.; Gimeno, L. Spatio-Temporal Assessment of Meteorological Drought in Puerto Rico between 1950 and 2019. Environ. Sci. Proc. 2021, 8, 40. https://doi.org/10.3390/ecas2021-10335
Sorí R, Méndez-Tejeda R, Stojanovic M, Fernández-Alvarez JC, Pérez-Alarcón A, Nieto R, Gimeno L. Spatio-Temporal Assessment of Meteorological Drought in Puerto Rico between 1950 and 2019. Environmental Sciences Proceedings. 2021; 8(1):40. https://doi.org/10.3390/ecas2021-10335
Chicago/Turabian StyleSorí, Rogert, Rafael Méndez-Tejeda, Milica Stojanovic, José Carlos Fernández-Alvarez, Albenis Pérez-Alarcón, Raquel Nieto, and Luis Gimeno. 2021. "Spatio-Temporal Assessment of Meteorological Drought in Puerto Rico between 1950 and 2019" Environmental Sciences Proceedings 8, no. 1: 40. https://doi.org/10.3390/ecas2021-10335
APA StyleSorí, R., Méndez-Tejeda, R., Stojanovic, M., Fernández-Alvarez, J. C., Pérez-Alarcón, A., Nieto, R., & Gimeno, L. (2021). Spatio-Temporal Assessment of Meteorological Drought in Puerto Rico between 1950 and 2019. Environmental Sciences Proceedings, 8(1), 40. https://doi.org/10.3390/ecas2021-10335