Proceeding Paper

Mapping Flash Floods in Iraq by Using GIS †

by
Ali Raheem Al-Nassar
1,* and
Hussein Kadhim
2
1
Department of Atmospheric Sciences, College of Science, Mustansiriyah University, Baghdad 14022, Iraq
2
Ministry of Transportation General Company for Ports of Iraq, Baghdad 14025, Iraq
*
Author to whom correspondence should be addressed.
Presented at the 4th International Electronic Conference on Atmospheric Sciences, 16–31 July 2021; Available online: https://ecas2021.sciforum.net/
Environ. Sci. Proc. 2021, 8(1), 39; https://doi.org/10.3390/ecas2021-10696
Published: 22 July 2021
(This article belongs to the Proceedings of The 4th International Electronic Conference on Atmospheric Sciences)

Abstract

:
This study aims to investigate flash floods in Iraq by plotting the cartographic maps by using synoptic and dynamical analysis of meteorological reanalysis data obtained from the European Centre for Medium-Range Weather Forecasts (ECMWF) and statistical analysis of daily precipitation records from the Iraqi Meteorological and Seismology Organization for selected Iraqi stations (Mosul, Kirkuk, Khanaqin, Baghdad and Al-Rutba, Al-Hayy, Al-Nasiriyah, and Basra), as well as the use of geographic information system (GIS) techniques. Three models create to investigate and map flash floods in Iraq. The results of the first model (the longest period of time) shows that the station of Mosul record the longest period for a rainstorm, 9 days in 2014, while the lowest period was in Rutba, 6 days in 2012, and the other stations varied between these two stations. The results of the second model (the highest total rainfall), present that Kirkuk station recorded the highest amount of rain (117.2 mm in 2013), while Al-Rutba station, 47.2 mm in 2011, the lowest station. Finally, the results of the third model (the highest frequency of rainstorms per month) shows that the lowest frequency of rainstorms per month was in Basra, 29 rainstorms in 2009, while Mosul station has 40 rainstorms in 2007 and the other stations within these two values.

1. Introduction

Rainstorms are one of the weather phenomena that occur in all parts of the world with a difference in their periods, strength, and number of times. For a rainstorm to be formed, a state of atmospheric instability must be provided, and an adequate amount of moisture and mechanisms to raise moist air to the upper levels in the atmosphere.
A flood occurs due to extreme precipitation or heavy rainfall accompanying severe thunderstorms, and it occurs within a short period of time, in general ranging from a few minutes to 6 h (Hong, 2013) [1].
These floods sweep across riverbeds, agricultural lands, villages, or urban areas. It is also difficult to predict or occurrence time, especially in areas where the rainfall is irregular, such as Iraq [2].
Rainfall in Iraq starts from October until the end of May, and there is no specific time to start because it is linked to the arrival of low pressures systems, its arrival time varies from season to season.
Most of the rainfall from December through March. Although the largest number of low pressures passes over Iraq during the month of February, it is noticed that the largest amount of rain occurs during January and March, while most of the heavy rains occur in the month of November [3].
The total annual rainfall decreases from north to south (because of the rise above sea level, the south is less elevated, and the north is higher) and from east to west (due to the proximity to the focus of depressions), and despite the increase in the amount of rain in some areas, a large variation in the amount of rain is observed. Not from one place to another, but in the same place from year to year, the reason for this graduation to the topographic factor, where the mountainous heights are located in the north and northeast of Iraq.
The increase in the frequency of anticyclones is one of the main reasons for the decrease in the amounts of rainfall in Iraq [4].
Any change in the amount of rain, whether it is an increase or decrease, affects Iraq, negatively or positively. When the amount of rain falls, it leads to devastating floods, such as the floods of Iraq in the year 1963 and others in the following years, when heavy rains fell on Iraq, so there were floods in the Tigris and Euphrates rivers that led to the destruction of some villages, as well as the destruction of agricultural crops, and many problems caused by these floods. Heavy rains lead to erosion and soil erosion. Therefore, we will address the impact of sudden heavy rainstorms on Iraq [5].
There are constant and inconstant parameters that affect the rains in Iraq, and among the constant factors are the geographical location, distance from natural water bodies, elevation, and topography of the region. For this reason, the authors did not address these factors.
As for the inconstant parameters that affect the rains, including the weather phenomena that cause heavy rainfall (cut-off lows, Rex block, jet streak, and upper air trough), dynamics factors such as divergence of horizontal wind, vertical movement, the atmospheric stability, and sufficient moisture associated with heavy rainfall. Atmospheric stability and sufficient moisture (significant moisture) can gradually advect into Iraq from the Mediterranean Sea, Red sea, and the Persian Gulf, southeasterly low-level flow brings warm, moist air [6].
Much of the current literature on geographical information system (GIS) pays particular attention to the analysis of multidimensional phenomena such as natural disasters [7,8,9,10,11].
Romania’s flood risk map for 2000, 2005, and 2006 was drawn by [12] for flood events.
Other study explained that the generated map can help planners provide an intuitive way to identify the source of hazards and its dispersion throughout the domain [13].
In Tucuman Province (Argentina) [14], GIS was used to delineate the flood risk area. The use of MCDA and GIS is useful to produce flood hazard maps [7,15,16].
Other researchers [17,18,19,20] are trying to assess and manage water resources and floods under the potential climate changes using GIS and the analytic hierarchy process method (AHP).
In [21], the flood disaster in Malaysia was studied and including the parameter distance to the river.
In this research we aim to study the synoptic situation that took place in the city of Basra on 24 January 2017, that caused the sinking of some villages, damages to the infrastructure, and the loss to agricultural crops because the level of rain reached 54 mm.
We will also try to develop a spatial statistical model that simulates reality to determine and classify the strength and intensity of rainstorms through modern technologies to avoid and reduce their risks according to these classifications.
The paper is arranged as follows. Section 2 displays the data sets and methodology, in Section 3 represent results and discussion, we examine the dynamical, synoptic analysis and the source of humidity to the lower atmosphere of a heavy rainfall event on 24 January 2017, then identifies the GIS building modules for mapping flash flood caused by heavy rainfall and their relevance for Iraq’s hydrological regime, finally end with Section 4 the main conclusions.

2. Data and Methodology

The daily rainfall (mm) data of eight Iraqi weather stations (Mosul, Kirkuk, Khanaqin, Baghdad, Rutba, Hai, Nasiriya, and Basrah) (Table 1 and Figure 1) representing most parts of Iraq, for a period of 11 years—1 January 2007 to 31 December 2017—come from the Iraqi Meteorological and Seismology Organization run by Ministry of Transport.
Administrative map of Iraq for 2019 from the General Authority for Survey run by The Ministry of Water Resources.
As for the reanalysis data, it includes geopotential height, horizontal divergence wind, and vertical velocity fields from the European Centre for Medium-Range Weather Forecasts (ECMWF) The ERA-Interim global atmospheric reanalysis, available at 1200 UTC time on a 0.75° × 0.75° latitude-longitude grid.
ARC GIS 10.3 program issued by the American Environmental System Research Institute (ESRI) specialized in the field of spatial analysis and production of spatial statistical models. Finally, the SPSS statistical package.

The Nearest Neighbor Analysis

To describe the distributions of the climatic stations in this study we use the nearest neighbor analysis. This technique produces a figure that measures the extent to which a particular pattern is clustered (nucleated), random, or regular (uniform) distribution.
the graph of the nearest neighbor analysis shows the random (clustering or regularity) distribution. The result of the nearest neighbor between 0 and 2.15. The result of the nearest neighbor analysis is equal to 1.78, and this indicates there is a tendency towards a regular pattern of weather stations and cover all parts of the study.

3. Results and Discussion

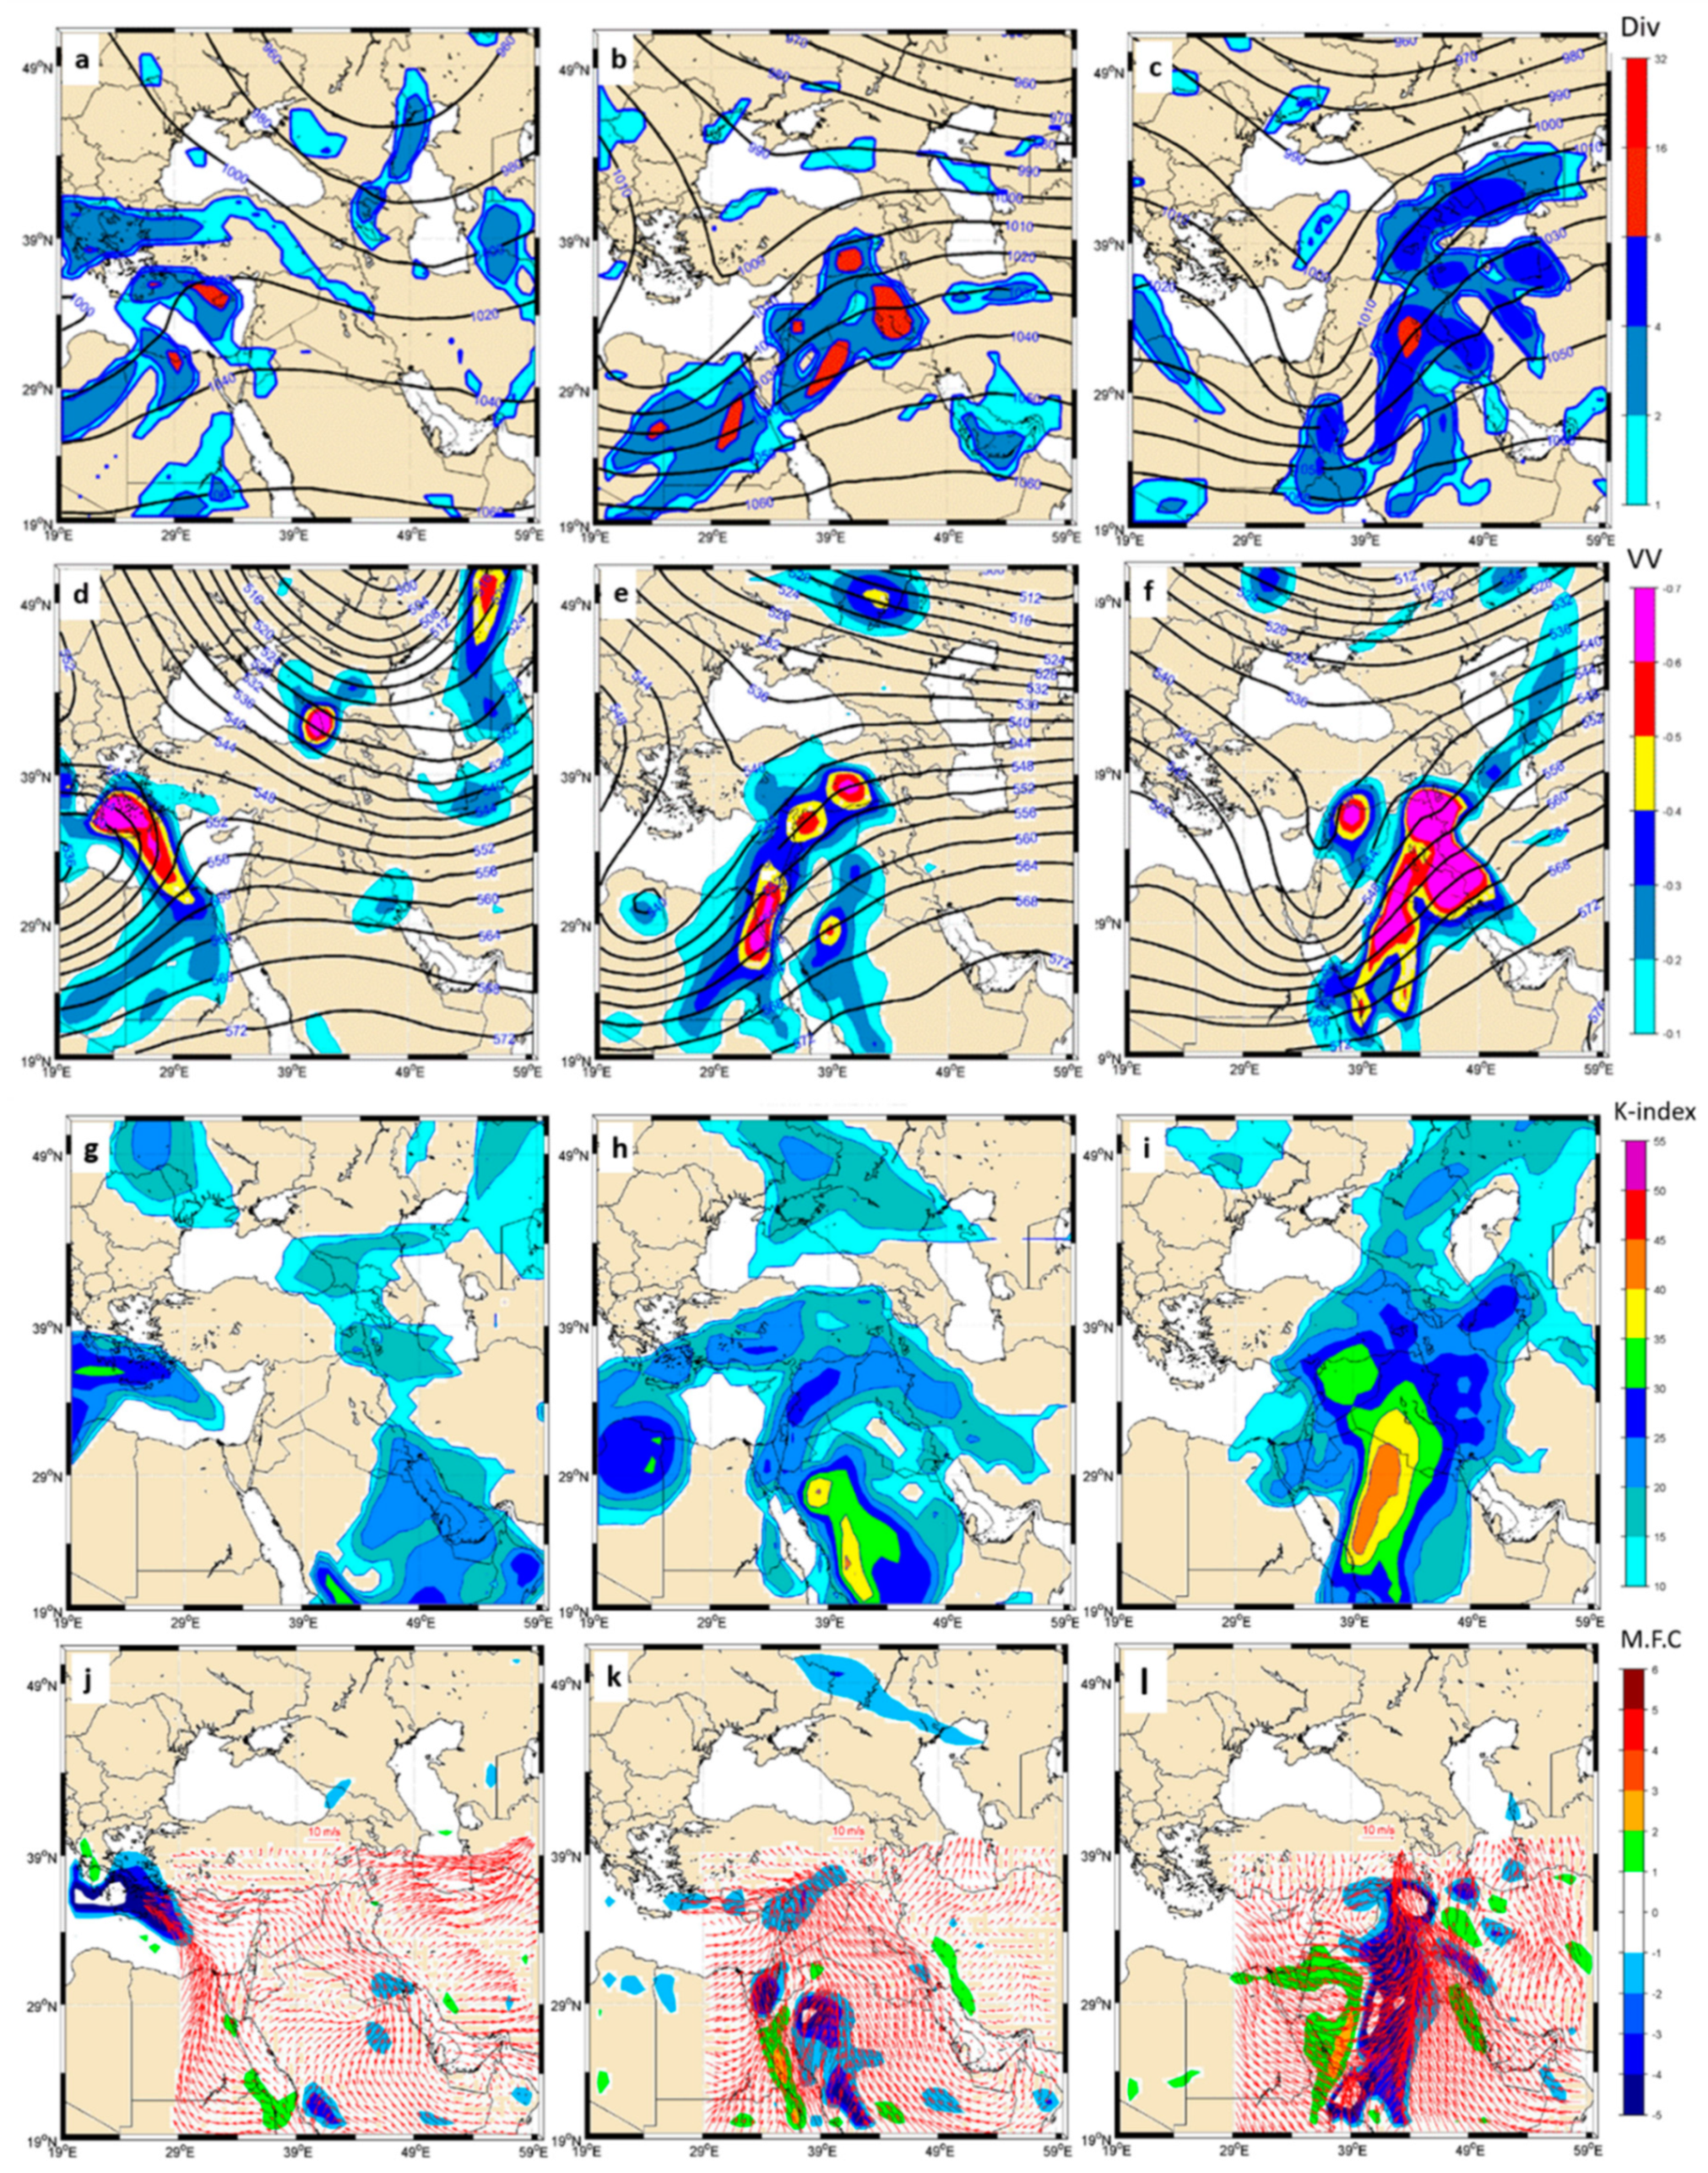
3.1. Synoptic and Dynamic Analysis of the Heavy Rain That Fell in Basra Station on 24 January 2017

The highest rainfall on 22–24 December 2017 (54.3 mm) in Basra city is investigated as one of the extreme events in the south of Iraq. The analysis included a day before the heavy rain with the two days in which the rainfall continued.
We investigated, for this case, the convective instability and dynamical forcing together with humidity sources. For convective instability, we examine the distribution of the K-index.
For dynamical forcing, we analyzed the distributions of divergence of horizontal wind (S−1) with geopotential height at 250 hPa, and the pressure vertical velocity (Pa/s) at 700 hPa with geopotential height at 500 hPa. The geopotential line at 250 hPa and 500 hPa (Figure 2a–f) present an upper-level trough pattern on 23 December then deepen by 24 December (Figure 2c,f) simultaneously with the high value of vertical velocity (Figure 2f).
We complete the analysis with K-index distribution in order to assess the instability conditions for this episode. Figure 2g–i clarify the evolution of the unstable conditions from the Persian Gulf and the Red Sea.
The Source of humidity were exploring through humidity and convergence of specific humidity distribution. Figure 2j–l illustrated that the convergence of humidity from the Red Sea and the Persian Gulf. Therefore, a necessary condition for extreme rainfall in Iraq is the advection and convergence of humidity from the Red Sea and the Persian Gulf.
Our analysis indicates that the dynamical forced in the extreme rainfall (54.3 mm) in Basra city playing primary role and the convective instability a secondary role.
(First panels) Horizontal divergence (colored with intervals of 10−5 S−1) and geopotential height (black contours with intervals of 5 dam) at 250 hPa. Figure 1a–c represent 22, 23, and 24 January, respectively.
(Second panels) Pressure vertical velocity (colored with intervals of 0.2 Pa s−1) at 700 hPa and geopotential height (black contours with intervals of 4 dam) at 500 hPa.
(Third panels) K index (colored, units of °C).
(Forth panels) Specific humidity content and convergence (10−4g kg−1 s−1) at 1000–850 hPa.

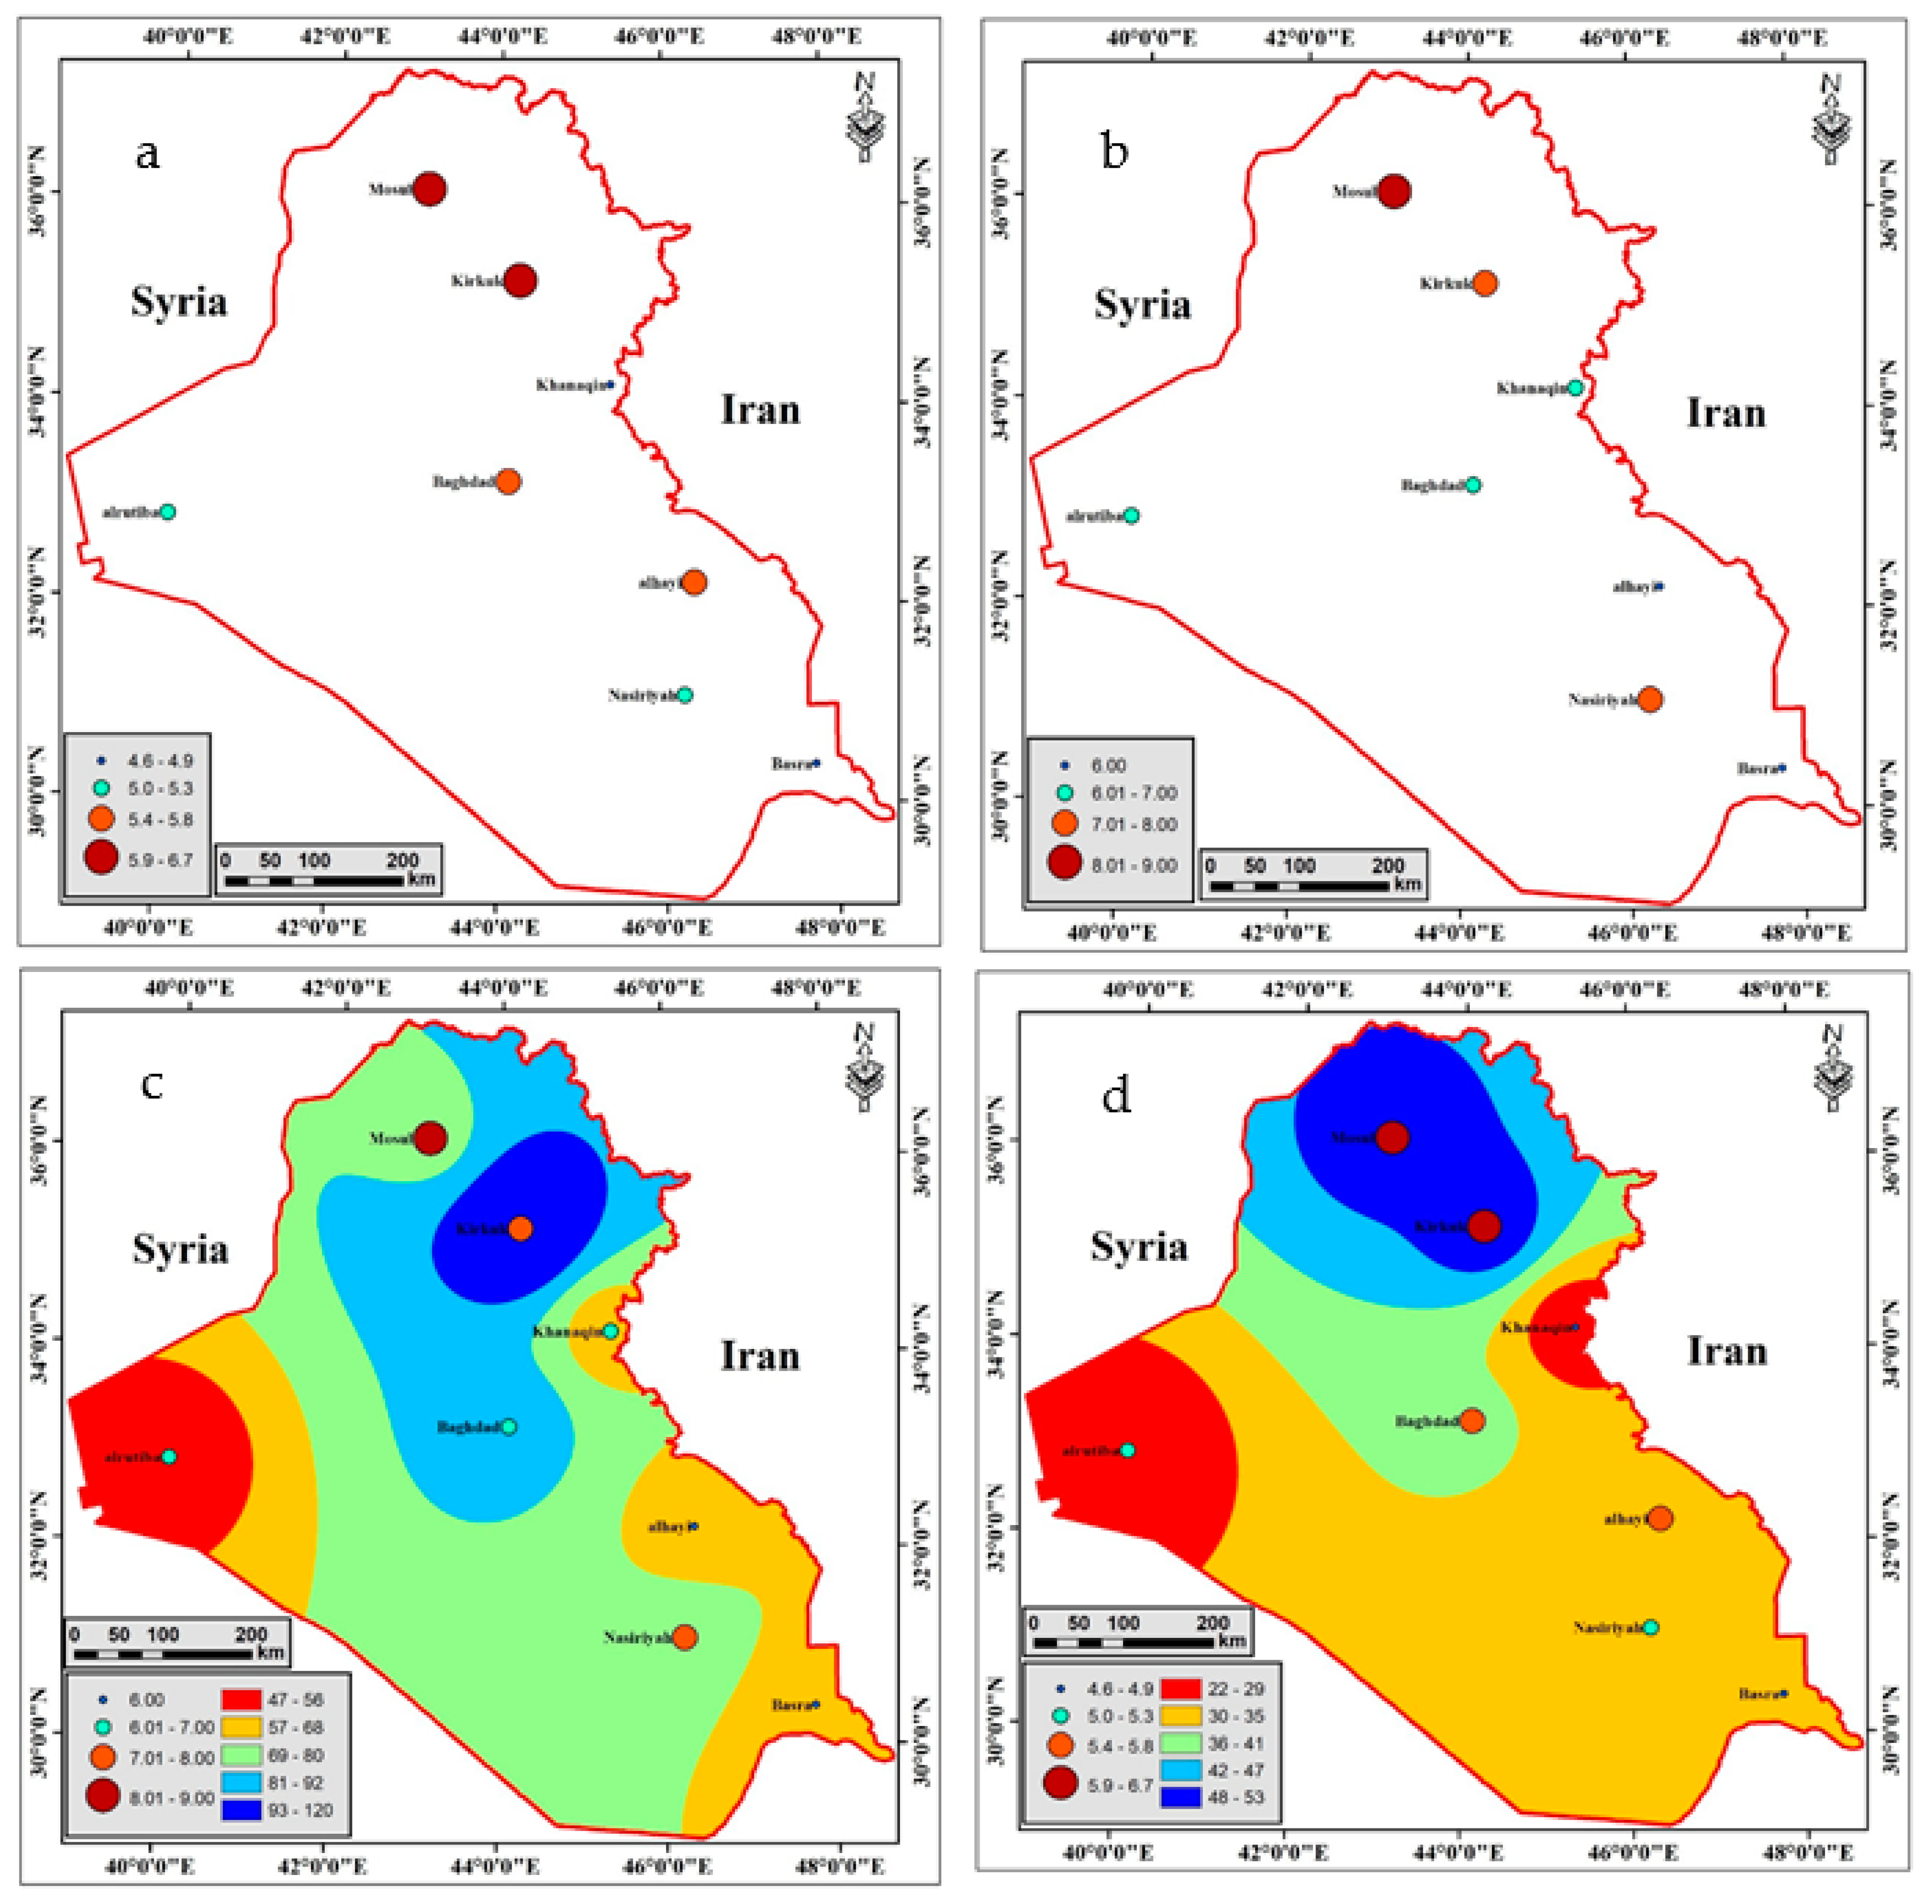
3.2. Flash Flood Modelling

Four models were used based on the data of the Iraqi Meteorological and Seismology Organization run by Ministry of Transport for a period of 11 years—1 January 2007 to 31 December 2017, for eight meteorological stations as well as using the Pearson correlation coefficient in order to determine the best model that represent the flash flood.

3.2.1. The First Model

The first model is based on the highest rainfall that fell during single rainstorm, the highest average stations are Mosul and Kirkuk in northern Iraq, while the lowest stations are in Basra and Nasiriya located in southern Iraq, indicating the gradient of isohyet extends from the north of Iraq to the lowest zone in southern Iraq, due to the elevation and latitude factors, which indicates that the northern stations are exposed to the greatest risk of a flash flood.
The results of the highest rainfall during the rainstorm show in Mosul 75.3 mm in 2013, Kirkuk 117.2 mm, as well as Khanaqin 58.7 mm, and Baghdad 89.9 mm in 2013, while in Rutba 47.2 mm in 2011, Hai station 60.3 mm in 2015, Nasiriya 75.8 mm in 2007, and, finally, 58.5 mm at Basra station in 2014, as shown in Table 2 and Figure 3a,b.
In addition, it is noticed that the highest amount of rainfalls occurred for Khanaqin, Baghdad, Hai, and Basra stations in November, and the reason is due to the activity of the Red Sea trough in this month [3].

3.2.2. The Second Model

This model is based on calculating the average with the highest number of rainy days and rainfall records for the eight stations, and the results present that the average number of rainy days for the stations in northern Iraq (Mosul and Kirkuk) are the rainiest days (5.9 days), while the lowest rainy days are at Basra station in southern of Iraq (3 days).
In addition, the results showed that the highest number of rainy days in Mosul station are 9 rainy days with 66.3 mm Kirkuk, Kirkuk station 9 days with 38.6 mm, Khanaqin station 8 days with 7.2 mm, Baghdad station 7 with 16.7 mm, and Hay Station, 8 days, reached 33.8 mm for the year 2014. Rutba Station, 6 days, with 22.5 mm in 2012, while the Nasiriya station, 6 days, 45.9 mm, for the year 2013, and, finally, the Basra Station, 6 days, in 2013, the rain reached 6.1 mm, as showed in Table 3 and Figure 4.
The Pearson correlation coefficient between highest number of rainy days and rainfall records are calculated, the results show that all the relationships are weak positive correlation for all stations, except for the Basra station, the correlation is weak negative correlation, indicating that the increasing in the number of rainy days does not necessarily lead to an increase in the amount of rainfall amount over the study area due to the variation in the intensity of the rainstorm during its long and short duration of precipitation, which leads to the unused and neglected this model as there is no relationship between the number of highest number of rainy days and rainfall amount.

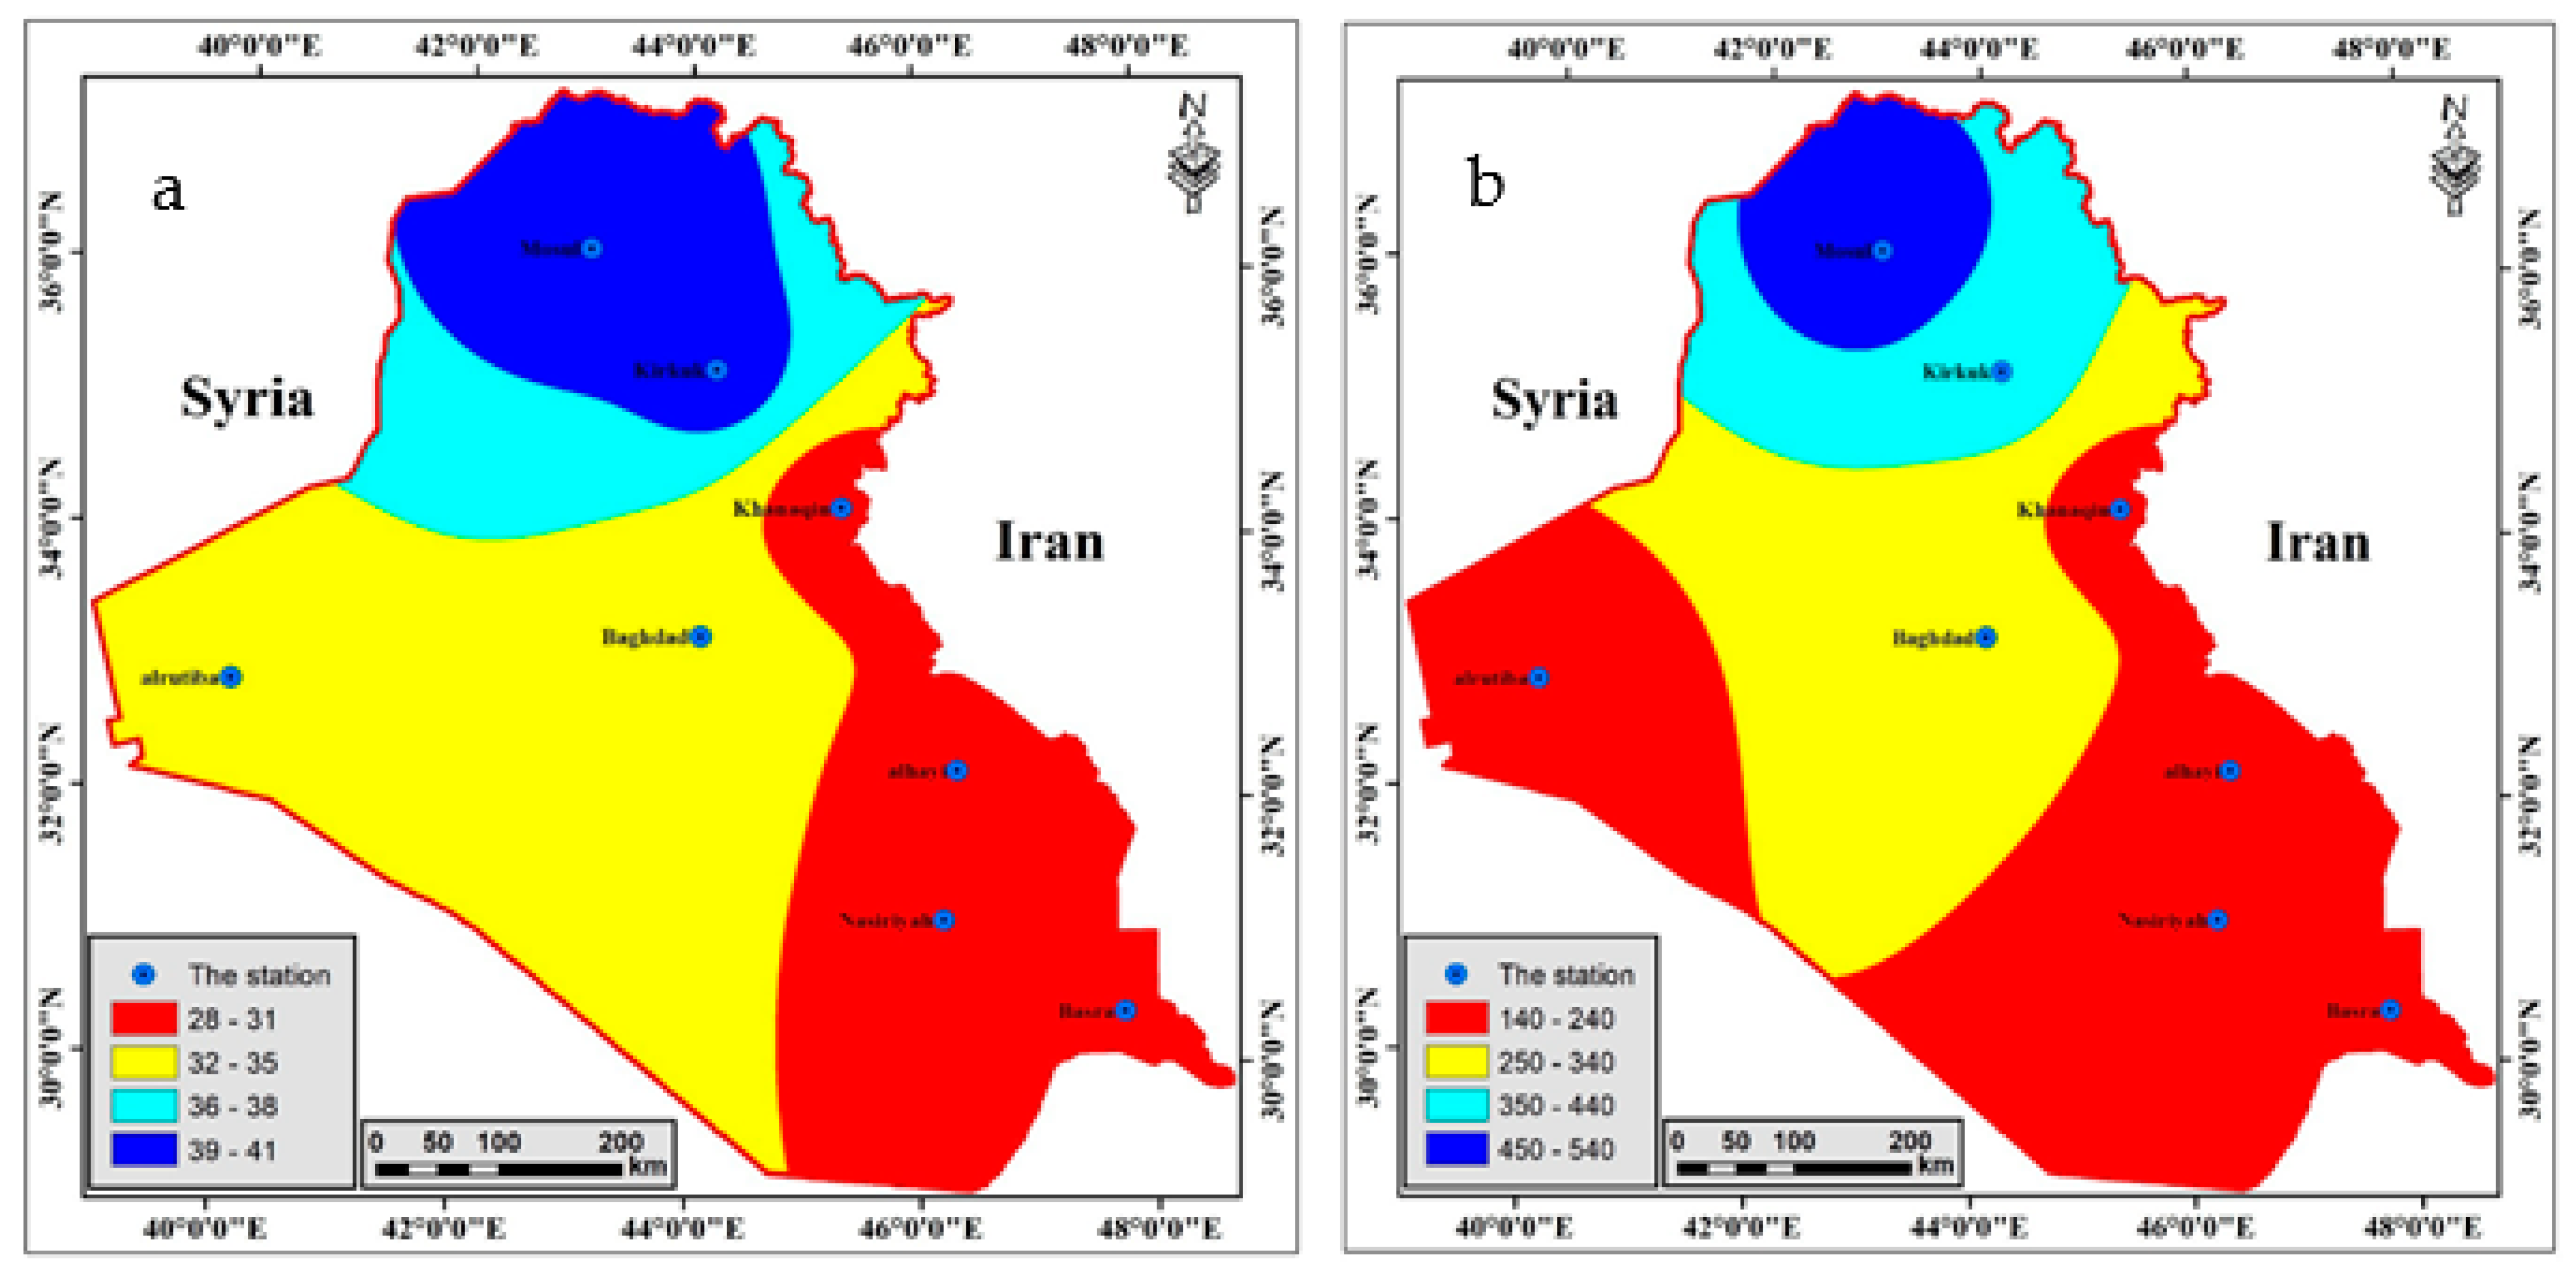
3.2.3. The Third Model

This model is based on the highest frequency of rainstorms per month.
The results showed that the average of the highest frequency of rainstorms per month are located in the northern region of Iraq, Mosul and Kirkuk, with six rainstorms per month, while the lowest rainstorms are in southern of Iraq (Basra stations) as shown in Table 4 and Figure 5.
In the other hand, the results of highest frequency of rainstorms per month for the period 2007–2017 showed that the highest frequency of rainstorms in Mosul and Kirkuk station, reaching 9.8 rainstorms in 2007, 2015 respectively, Khanaqin station reached seven rainstorms in 2014, Baghdad station, seven rainstorms for the year 2017, Al-Rutba station, seven rainstorms in 2013, Hai Station, six rainstorms for the year 2013, Nasiriya station, eight rainstorms in 2017, and, finally, Basra station recorded six rainstorms in 2017.
In addition, the results indicate that the most frequent rainstorms occur in the month of March for the stations in Mosul, Kirkuk, Baghdad, and Nasiriyah. As for the rest of the stations, they vary between December for each of Khanaqin and Basra stations, and the month of May for the Al-Rutba station and the neighborhood. As shown in the table below.
In addition, the results of the Pearson correlation coefficient between the rate of the highest frequency of rainstorms per month and their quantities of rain in the selected stations between (2007–2017) indicate that all the relations are weak positive correlations for all stations except for Mosul and Basra stations are weak opposite correlation.

3.2.4. The Fourth Model

This model is based on the total annual rainstorms with the annual rainfall amount.
The results of the mean annual total rainstorms present the highest mean in the northern region of Iraq, Mosul with 35 rainstorms per year, while the lowest mean in southern stations, Basra station with 18 rainstorms per year.
From Table 5 and Figure 6, we can find that the highest rainstorms for all stations for the period 2007–2017 and it is in Mosel (41 rainstorms in 2011), and Kirkuk (40 rainstorms in 2015), while the lowest rainstorm in Basra (26 rainstorms in 2009), and the other station ranging between them: Khanaqin station (28 rainstorms in 2014), Baghdad (33 rainstorms in 2009), Rutba station (33 rainstorms in 2013), Hai (30 rainstorms in 2014), and, finally, Nasiriya (31 rainstorms in 2014).
The Pearson correlation coefficient are calculated between the total annual rainstorms with the annual summation of rainfall. The results of the correlation coefficient are a strong positive correlation for Khanaqin station 0.80, moderate positive correlation (0.4–0.7) for Basra, Nasiriya, Hai, and Rutba stations, and weak positive correlations for Mosul and Kirkuk stations (0.23–0.28). Finally, weak negative correlation for Baghdad station, −0.002.

4. Conclusions

Flash floods have negative effects that causing material and human losses and stopping all human activities when they occur. The different characteristics of a rainstorm (quantity, intensity, and duration) have the greatest influence on the negative effects of the flash floods. Moreover, there is a set of fixed factors (geographical location, distance from waterbodies, and topography) that determine the general form of the intensity of the impact of rainstorms in each Iraq’s parts.
Dynamic factors (lows and highs pressures) play an important role in determining the time and characteristics of flash floods. The activity of dynamic factors serves as a warning bell for all service means to take precautions to prevent any loss of life or vital facilities within the area of occurrence. The results of the statistical analysis showed that the length of the duration of the rainstorm is not a significant factor in the formation of the flash floods, because the length of the rainstorm duration does not necessarily lead to an increase in the amount of rainfall, except in the case of its association with the strength of the rainstorm intensity (the amount of precipitation/unit time), Therefore, this model is canceled from relying on its results as one of the models that determine the locations of the effective flash floods.
The results of the statistical analysis showed that the increase in the frequency of rainstorms does not necessarily lead to an increase in the intensity of the flash floods, because this increase in the number of iterations may increase the probability of rainstorms that do not lead to the formation of flash floods to cause damages or stop the daily life of humans. The increase in (the amount of precipitation / unit time) leads to an increase in the risk of flash floods, because it reduces the chance of infiltration, evaporation, and runoff entering a storm drain or rivers.
The research proved that geographic information systems (GIS) have a tremendous ability to analyze, process, and deal with various types of data (descriptive, rank, and quantitative) and simulate reality based on the data entered by the researcher into the program environment. This reduces it to a lot of time, effort, and money, if it works in the traditional way, in addition to the fact that the accuracy granted by this technique is characterized by being ideal and characterized by high objectivity, and this is what the researcher is looking for in such studies.
We also have assessed the synoptic conditions of one of the highest flash flood events, in Basra city taking place 23–24 December 2017. The upper (250 hPa) and middle (500 hPa) atmospheric conditions present an upper-level trough leading to this episode.
Southern Iraq (Basra city) was affected by the divergence of horizontal wind and associated with upwards motions. Simultaneously, the low-level atmosphere, experiencing the convergence of humidity from the Red Sea and the Persian Gulf. In addition, the instability condition (k-index) was only a minor role as compared with the dynamical forcing.

Acknowledgments

We are very grateful to the Mustansiriyah University (collage of science, Department of Atmospheric Sciences), General Company for Ports of Iraq and the Iraqi Meteorological and Seismology Organization for providing daily precipitation records. We thank the European Centre for Medium-Range Weather Forecasts for making freely available the ERA-Interim reanalysis for providing the reanalysis data.

References

  1. Buchwaldt, R. Encyclopedia of Natural Hazards; Bobrowsky, P.T., Ed.; Springer: Berlin, Germany; Simon Fraser University Canada: Burnaby, BC, Canada, 2013; p. 324. [Google Scholar]
  2. NOAA. National Weather Service, Flood and Flash Flood Definitions, National Oceanic and Atmospheric Administration. Available online: https://www.weather.gov/mrx/flood_and_flash (accessed on 24 June 2021).
  3. Al-Nassar, A.R.; Pelegrí, J.L.; Sangrà, P.; Alarcon, M.; Jansa, A. Cut-off low systems over Iraq: Contribution to annual precipitation and synoptic analysis of extreme events. Int. J. Climatol. 2020, 40, 908–926. [Google Scholar] [CrossRef]
  4. Aboud Al-Kinani, M.N.; Al-shamry, M.K. Synoptic analysis of floodwaters affecting East Wasit Governorate and its impacts on infrastructure and agricultural land. J. Coll. Educ. 2019, 4, 4. [Google Scholar] [CrossRef] [Green Version]
  5. Abdul-Jabbar, A.M.; Khtan, A. Predicted the Cumulative Annual Rainfall in Iraq using SDSM Moda. Al-Mustansiriyah J. Sci. 2021, 32, 2. [Google Scholar] [CrossRef]
  6. Al Nassar, A.R.T. Dynamics of Cyclones and Precipitation over the Middle East. Ph.D. Thesis, Departament de Física, Universitat Politècnica de Catalunya, Barcelona, Spain, 2018. [Google Scholar]
  7. Vahidnia, M.H.; Alesheikh, A.A.; Alimohammadi, A.; Hosseinali, F. A GIS-based neurofuzzy procedure for integrating knowledge and data in landslide susceptibility mapping. Comput. Geosci. 2010, 36, 1101–1114. [Google Scholar] [CrossRef]
  8. Alaghmand, S.; Bin-Abdullah, R.; Abustan, I.; Vosoogh, B. GIS-based River Flood Hazard Mapping in Urban Area: A Case Study in Kayu Ara River Basin, Malaysia. Int. J. Eng. Technol. 2010, 2, 488–500. [Google Scholar]
  9. Wang, Y.; Li, Z.; Tang, Z.; Zeng, G. A GIS-based spatial multi-criteria approach for flood risk assessment in the Dongting Lake Region, Hunan, Central China. Water Resour. Manag. 2011, 25, 3465–3484. [Google Scholar] [CrossRef]
  10. Patel, D.P.; Srivastava, P.K. Flood hazards mitigation analysis using remote sensing and GIS: Correspondence with town planning scheme. Water Resour. Manag. 2013, 27, 2353–2368. [Google Scholar] [CrossRef]
  11. Jaafari, A.; Najafi, A.; Pourghasemi, H.R.; Rezaeian, J.; Sattarian, A. A GIS-based frequency ratio and index of entropy models for landslide susceptibility assessment in the Caspian forest, northern Iran. Int. J. Environ. Sci. Technol. 2014, 11, 909–926. [Google Scholar] [CrossRef] [Green Version]
  12. Aldescu, G.C. The Necessity of Flood Risk Maps on Timis River; IOP Conference Series: Earth and Environmental Science; IOP Publishing: Bled, Slovenia, 2008; p. 4. [Google Scholar]
  13. Koehler, K.A.; Volckens, J. Prospects and pitfalls of occupational hazard mapping: ‘between these lines there be dragons’. Ann. Occup. Hyg. 2011, 55, 829–840. [Google Scholar] [PubMed]
  14. Fernández, D.S.; Lutz, M.A. Urban flood hazard zoning in Tucumán Province, Argentina, using GIS and Multi Criteria Decision Analysis. Eng. Geol. 2010, 111, 90–98. [Google Scholar] [CrossRef]
  15. Sowmya, K.; John, C.M.; Shrivasthava, N.K. Urban flood vulnerability zoning of Cochin City, southwest coast of India, using Remote Sensing and GIS. Nat. Hazards 2015, 75, 1271–1286. [Google Scholar] [CrossRef]
  16. Gerl, T.; Bochow, M.; Kreibich, H. Flood Damage Modeling on the basis of Urban Structure Mapping Using High-Resolution Remote Sensing Data. Water 2014, 6, 2367–2393. [Google Scholar] [CrossRef] [Green Version]
  17. Emmanouloudis, D.; Myronidis, D.; Ioannou, K. Assessment of flood risk in Thasos Island with the combined use of multicriteria analysis AHP and geographical information system. Innov. Appl. Inf. Agric. Environ. 2008, 2, 103–115. [Google Scholar]
  18. Sinha, R.; Bapalu, G.; Singh, L.; Rath, B. Flood risk analysis in the Kosi river basin, north Bihar using multi-parametric approach of analytical hierarchy process (AHP). J. Indian Soc. Remote Sens. 2008, 36, 335–349. [Google Scholar] [CrossRef]
  19. Meyer, V.; Scheuer, S.; Haase, D. A multicriteria approach for flood risk mapping exemplified at the Mulde river, Germany. Nat. Hazards 2009, 48, 17–39. [Google Scholar] [CrossRef]
  20. Chen, Y.-R.; Yeh, C.-H.; Yu, B. Integrated application of the analytic hierarchy process and the geographic information system for flood risk assessment and flood plain management in Taiwan. Nat. Hazards 2011, 59, 1261–1276. [Google Scholar] [CrossRef] [Green Version]
  21. Tehrany, M.S.; Pradhan, B.; Jebur, M.N.; Neamah, M. Flood susceptibility mapping using a novel ensemble weights-of-evidence and support vector machine models in GIS. J. Hydrol. 2014, 512, 332–343. [Google Scholar] [CrossRef]
Figure 1. Physical map of Iraq according to topography and its location. It shows the location of meteorological stations that used in this study.
Environsciproc 08 00039 g001
Figure 2. Dynamic conditions during extreme rainfall upper-level trough over Iraq. From left to right: 22–24 January 2017, at 1200 UTC.
Environsciproc 08 00039 g002
Figure 3. (a) The highest rainfall that fell during single rainstorm; (b) The average of the highest rainfall that fell during single rainstorm.
Environsciproc 08 00039 g003
Figure 4. (a) The average of the highest number of rainy days; (b) The highest number of rainy days; (c) The average of the highest number of rainy days with rain; (d) The highest number of rainy days with rain.
Environsciproc 08 00039 g004
Figure 5. (a) The average of the highest frequency of rainstorms per month; (b) The highest frequency of rainstorms per month; (c) The average of the highest frequency of rainstorms per month with rain; (d) The highest frequency of rainstorms per month with rain.
Environsciproc 08 00039 g005
Figure 6. (a) The highest total annual rainstorms (2007–2017); (b) The highest total annual rainfall (2007–2017).
Environsciproc 08 00039 g006
Table 1. Meteorological stations in Iraq.
StationslongitudeLatitudeElevation (m)
1Mosul43.09°36.19°223
2Kirkuk44.24°35.28°331
3Khanaqin45.39° 34.35°185
4Baghdad44.24°33.18°34
5Rutba40.17°33.02°615
6Hai46.14°32.08°15
7Nasiriya46.14°31.01°3
8Basrah47.47°30.31°2.40
Table 2. The highest rainfall for selected stations (2007–2017).
Stations20072008200920102011201220132014201520162017Average
Mosul48.352.727.346.652.162.475.366.364.744.727.151.59
Kirkuk60.624.741.252.344.744.4117.245.358.972.425.253.35
Khanaqinــــــــــــــــــــــــــــــــــــــــــــــــــــــــــــــــــــــــــــــــــــــــــــــــــــ29.558.737.53.31.54.422.48
Baghdad24.614.515.117.429.167.589.917.884.929.623.936.25
Rutba19.917.374147.222.540.624.1138822.6
Hai13.70121.823.10120.230.8023.73233.80260.343.6021829.18
Nasiriya75.820.418.514.711.640.368.460.722.820.54.832.59
Basrah40.31827.87.712.226.229.658.541.625.654.331.07
Table 3. Average with the highest number of rainy days and rainfall records and the correlation coefficient between the rainy days and the rainfall amounts.
Stations 20072008200920102011201220132014201520162017Avg.r *
MosulDays564776694655.910.37
rain(mm)48.332.94835.30252.1011033.166.33844.727.139.62
KirkukDays565574796655.910.27
rain(mm)60.624.314.64732.924.6117.238.640.810.125.239.63
KhanaqinDaysــــــــــــــــــــــــــــــــــــــــ6584234.670.15
rain(mm)ــــــــــــــــــــــــــــــــــــــــ4.358.77.211.54.412.85
BaghdadDays434453675644.640.07
rain(mm)6.731113.66.13516.116.784.910.99.719.43
RutbaDays232456433233.360.41
rain(mm)19.915.80.0111.86.322.52176.280.610.83
HaiDays433234785434.180.46
rain(mm)13.72023.110.41.48.817.833.822.943.61.917.95
NasiriyaDays424333654533.820.34
rain(mm)75.820.41.52.49.540.345.960.74.52.64.824.4
BasrahDays3223336232430.46
rain(mm)40.315.727.86.44.313.86.158.516.825.621.421.52
Note: (r *) represent Pearson correlation coefficient.
Table 4. The average with highest frequency of rainstorms and their amounts in the selected stations (2007–2017) and the correlation coefficient between the highest frequency of rainstorms and their amounts.
Station 20072008200920102011201220132014201520162017Avg.r
MosulFrequency 958668677666.73−0.12
Rain(mm)26.20.80428.10456.003118.80350.835.953.922.80442.20150.144.15
KirkukFrequency556657676686.090.51
Rain(mm)34.349.00154.50129.20371.80152.440.30180.20137.488.795.157.54
KhanaqinFrequencyـــــــــــــــــــــــــــــــــــ4675434.830.24
Rain(mm)ـــــــــــــــــــــــــــــــــــ35.12115.56.43.42.313.95
BaghdadFrequency457555655575.360.02
Rain(mm)32.223.70311.4045.50425.10383.20370.80635.80228.20330.30342.00535.29
RutbaFrequency535466755354.910.12
Rain(mm)16.310.50.70324.50120.8050.20613.9136.50213.6030.00111.00213.46
HaiFrequency555656655565.360.01
Rain(mm)3.30445.3046.40526.20450.10432.151.50546.90156.90135.20131.235.01
NasiriyaFrequency534565656585.270.15
Rain(mm)9.2021.4017.10229.20219.90519.3037.80383.00536.10111.61922.15
BasraFrequency546655335364.64−0.06
Rain(mm)46.70331.639.60117.50222.428.90240.2016043.80226.164.10438.27
Table 5. The total annual rainstorms with the annual rainfall amount in the selected stations (2007-2017), the correlation coefficient between the total annual rainstorms, and the annual rainfall amount.
Scheme 2007. 20072008200920102011201220132014201520162017Avg.r
MosulRainstorms4030323541393336363528350.23
Rainfall (mm)193.8216.318223.815240.616294.718278.61455.513340.811288.809216.007145.103263.1
KirkukRainstorms272732273534293740263131.360.28
Rainfall (mm)173.106134.916225.814267.212221.81292.105394.305319.008315.505321.504204.504260.89
KhanaqinRainstormsـــــــــــــــــــــــــــــــــــ26232820158200.81
Rainfall (mm)ـــــــــــــــــــــــــــــــــــ116.4169.35170.314.94.910.180.99
BaghdadRainstorms202233272726273229273027.27−0.002
Rainfall (mm)99.21459.11967.52492.51996.021184.422296.725107.524190.923104.52271.829124.58
RutbaRainstorms12152426292933301732121.730.7
Rainfall (mm)58.40172.90123.312109.01787.9273.018135.219157.6141.90810.30121.81471.95
HaiRainstorms2126272224282730282121250.64
Rainfall (mm)64.5187.62185.3280.309120.31381.207156.814188.615194.612123.51343.105111.45
NasiriyaRainstorms221729202824283128242825.360.4
Rainfall (mm)112.51565.50556.91757.61685.119116.22174.22219.72393.2268.329.798.1
BasrahRainstorms231329162122145191917180.5
Rainfall (mm)139.2167.10389.81157.00765.307115.30948.3160.5131.50886.908128.20989.93
Publisher’s Note: MDPI stays neutral with regard to jurisdictional claims in published maps and institutional affiliations.

