Proceeding Paper

An Investigation of Critical Fire Weather Patterns: A Case Study †

Department of Atmospheric Sciences, College of Science, Mustansiriyah University, Baghdad 10012, Iraq
*
Author to whom correspondence should be addressed.
Presented at the 4th International Electronic Conference on Atmospheric Sciences, 16–31 July 2021; Available online: https://ecas2021.sciforum.net.
Environ. Sci. Proc. 2021, 8(1), 37; https://doi.org/10.3390/ecas2021-10694
Published: 22 July 2021
(This article belongs to the Proceedings of The 4th International Electronic Conference on Atmospheric Sciences)

Abstract

:
A series of huge wildfires occurred in some regions of Lebanon in mid-October 2019, when the region witnessed a heat wave with high averages of minimum and maximum temperatures, accompanied by dry weather conditions. This study aimed to investigate the weather pattern that predominated over Lebanon between 10 and 18 October 2019, and to study the weather factors that ignited and spread the fire in several places. The study focused on the Chouf district, in Mount Lebanon Governorate, which witnessed the most severe wildfire outbreak, based on ERA5 atmospheric reanalysis data at the surface and upper levels between 10 and 18 October 2019. It was found that the existence of an atmospheric blocking system over the region for many days was the main factor in the creation of the dry and extremely hot weather, and that the breakdown of the ridge ignited the fire, reinforcing the wildfire’s intensity and spreading fire patches to other regions.

1. Introduction

Forest fires are a major risk and cause serious damage to mankind, the environment, and economic conditions around the world, and the Mediterranean region is one of the most fire-prone regions. The most important natural causes of forest fires are related to extreme global climatic conditions [1,2], and there are four major weather elements that produce extreme fire activity: high temperatures, low relative humidity, strong surface wind, and unstable air, which increases the probability of thunderstorms and strong downdraft winds [3]. The spatial distribution of vegetation, their species and moisture content is another crucial factor in fire severity [4,5]. Fire activity is affected by the regional natural conditions, in which atmospheric processes in complex and mountainous terrain result in a variety of phenomena. These include two main wind types that should be considered in order to improve the prediction of fire activity in mountainous regions: large-scale, dynamically driven winds and thermally driven winds [3]. In addition to all these main factors, human activity plays an important role in the enhancement or suppression of fire activity, such as deforestation and land use [6].
The number of fires and the size of the areas they consume have significantly increased in recent decades, and the danger of forest fires is predicted to increase. This is particularly true around the Mediterranean, due to climatic changes that will reduce fuel moisture levels, making the region drier; furthermore, areas exhibiting low moisture will extend further northwards from the Mediterranean, and the area of high fuel moisture surrounding the Alps in the current climate conditions is predicted to decrease in size; therefore, adaptation strategies will be crucial to the lessening of the detrimental impact of climate change on forest fires and the associated reductions in biomass and biodiversity [7,8].
Depending on their geographical position, phenomena such as heat waves and extreme dry conditions with large fires and floods may arise in season under pre-existing conditions as a result of blocking [9], which has a strong impact on the evolution of weather patterns. Understanding this phenomenon is crucial to the prediction of the probability of the occurrence of fire weather and its duration.
Blocking is a long-standing structure stalled in the mid-troposphere, which is often associated with extreme weather events. When blocking starts, weather patterns moving from west to east stop in certain places for several consecutive days, and sometimes lasts for a month [10]. Blocking over large areas is most common in high-pressure systems, because they cover a broad area and tend to move slower than low-pressure systems, with a lifespan varying from a few days to a few weeks, leading to severe and persistent weather anomalies [11].
Predominately, blocks show a large anticyclonic anomaly and reverse the zonal flow so that net easterly winds in some parts of the blocked region are seen, and disrupting the frequent western flow for periods lasting around a week, or longer [12]. Atmospheric blocking, commonly associated with clear skies with increased solar isolation at the surface, adiabatic warming with sinking motions, as well warm air advection, is an underlying driver of heat waves. Two mechanisms driving permanent summer heat events are: the persistent blocking of resonant circulation regimes, and the reduced baroclinicity and decreased eddy kinetic energy that occurs during the boreal summer season [10].
Many studies have focused on atmospheric weather patterns and the heat waves they cause, as well as other extreme weather phenomena, which are among the indicators of climate change and increase the likelihood of fires.
Dong et al. provided a unique case study, focused on the whole of the US during 13–17 August, 2007, in which blocking, drought, heat waves and an urban heat island all occurred concurrently, concluding that atmospheric blocking is capable of reinforcing droughts, initiating heat waves, and probably amplifying the urban heat island intensity during [10]. Woollings et al. reviewed the research on blocking under climate change, with the aim of providing an overview for those working in related fields, and they identified several avenues through which blocking can be reduced in numerical models, although a fully reliable simulation remains elusive (at least, beyond a few days’ lead time) [13]. Efe et al. investigated the blocking characteristic related to surface temperature anomalies in Turkey between 1977 and 2016, and they found a negative correlation in all seasons during the study period except in spring, and observed Rex- blocking system for both maximum and minimum temperature anomalies [12]. Rodrigues et al. studied the relationship between the atmospheric conditions in the Iberian Peninsula and fire occurrence on the Spanish mainland; they concluded that fire events increase under specific atmospheric patterns, that they are linked to summer heat waves, and that in mountainous regions fires can be activated on the lee side due to adiabatic heating, depending on wind speed and direction [14].
Because of this exacerbation of the rate of fires, many indices were used in the prediction the forest fires all over the world, such as the Fire Weather Index (FWI) [15], the normalized difference vegetation index (NDVI) [16], and the vegetation health index (VHI) [17], in addition to the use of GIS techniques [18,19].
Lebanon, located to the east of the Mediterranean Sea, experiences forest fires in the dry hot summers which frequently coincide with high temperatures, wind speeds and wind directions. Some research on Lebanese forest fires has shown that over the period between 1983 and 2003, about 67% of fires occurred due to the high temperatures related to high wind frequencies, while without these high wind frequencies, about 24% of fires occurred only at high temperatures [1]. In general, 15% of the areas of Lebanon, especially in Mount Lebanon and North Lebanon, where the density of vegetation is high, are subject to “very high” flaring, while 34% of Lebanese land areas are subjected to fires whose risk ranges between medium and high. Often, the fire season occurs between June and October. Recently, large green areas have been burnt out by fire in Lebanon. The percentage of forest cover in Lebanon was 35% in 1960–1965; by 2006, this green area had decreased to 13%, when the high summer temperatures reduced the vegetation’s humidity to less than 5%. Under these conditions, a slight flame, a burning cigarette or even a match may be enough to start a devastating fire. It is worth remembering that sloping ravines and high temperatures, and the high-speed dry easterly wind all contribute to exacerbating the situation [20].
Due to the frequent fires that Lebanon is exposed to and their risks in life threatening, and their impacts on the climate and the environment, this study aimed to investigate the weather pattern that predominated over Lebanon between October 10 and 18 2019, which led to several fires, and to study the weather factors that ignited and spread the fire in several places.

2. Materials and Methods
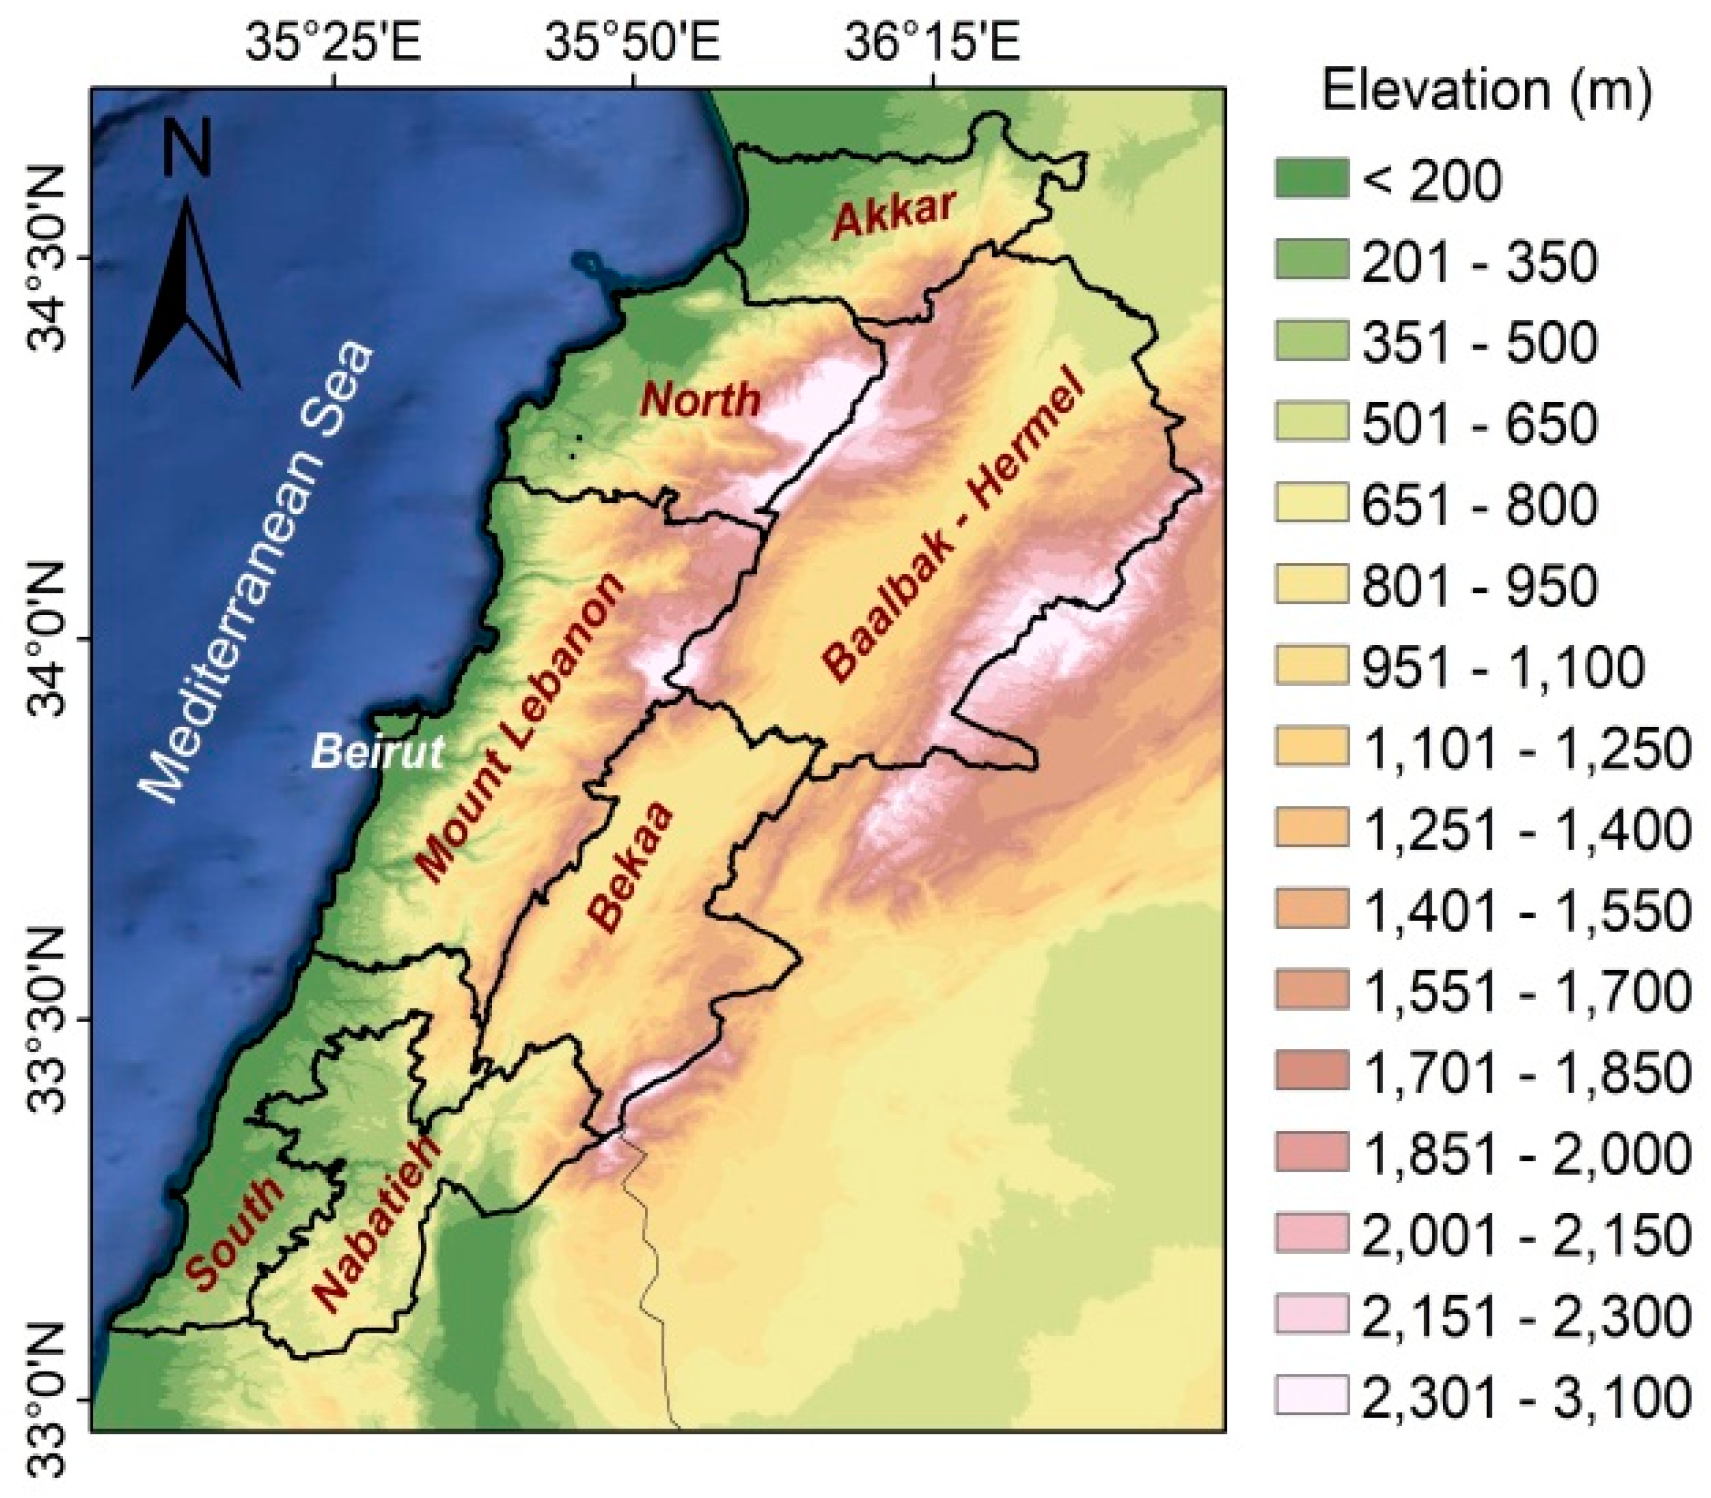
2.1. Study Area

In order to investigate the weather patterns, the study area included the whole Mediterranean region (24° W–60° E, 10° S–65° N), focusing on the Mount Lebanon region, particularly on the Chouf (or Shouf) district (33.69556° N, 35.57917° E), which is located to the south of Beirut, because it was one of the most affected regions in this fire series and in the whole year of 2019, as shown in Figure 1 [21].
Topographically, Lebanon can be divided into four parallel sections from west to east [1]: a flat, narrow coastal strip parallel to the sea that rises steeply to Mount Lebanon, alongside a narrow fertile plain; the Mount-Lebanon chain, the highest crest of which is just over 3000 m; the Bekaa Valley, around 900 m in height and 8–10 km wide; and the Anti-Lebanon mountain chain along the border with Syria, which rises to 2800 m, in the east, as shown in Figure 2.
The mountain range of Lebanon rises steeply from the coast to the mountains, reaching 3088 m above sea level, and contains most of the forests in Lebanon. Some parts of the Lebanese territory, which represents about 33% are classified as areas with moderate to very high risky regions. As in other Mediterranean countries, fires occur mainly in the dry season and human activity is responsible for the majority of ignitions [22].
The Chouf district is one of the six districts in the Mount Lebanon Governorate, extending eastwards from the Mediterranean Sea coast to Barouk mountain, and from the Damour river in the north to El Aouali Markits in the south. It has a typical Mediterranean climate, with a maximum average temperature of 20 °C in August (creating hot and dry summers) and a minimum temperature of 4 °C in January (leading to cold and wet winters). Its characteristic feature is the natural reserve of Cedar, which lies to the west of Mount Lebanon [23].

2.2. Weather Patterns Investigation

As for weather patterns, it was essential to identify the atmospheric weather patterns in the upper levels (500, 700 and 850 hPa) by observing their evolution, predominance, and movement using some meteorological parameters, including geopotential height, relative vorticity, vertical velocity and relative humidity, across different domains covering the Mediterranean region, during the period studied (10–18 October 2019). While testing these parameters, it was important to observe the feedback of the upper pressure systems on the surface by testing the surface pressure, the surface temperature and the dew point at 2 m, the maximum and minimum temperature at 2 m, the u and v components of the wind and the wind gust at 10 m, the total and convective precipitation, and the total cloud cover. Furthermore, the total totals index was used as an indicator of the probability of the occurrence of a thunderstorm and of its severity. All of the data for the surface and upper atmospheric levels were taken from ERA5, which is the ECMWF’s fifth-generation global climate reanalysis tool; it provides global, hourly estimates of atmospheric variables, at a horizontal resolution of 31 km and at 137 vertical levels from the surface to 0.01 hPa. Two types of data were used in this study: ERA5 hourly data on pressure levels from 1979 to the present (gridded Reanalysis data of 0.25° × 0.25° horizontal resolution) [25]; and ERA5 hourly data on single levels from 1979 to the present (gridded Reanalysis: 0.25° × 0.25° (atmosphere)) [26].

2.3. Fire Detection

The burned areas were detected using the data acquired from the Visible Infrared Imaging Radiometer Suite (VIIRS) 375 m thermal anomalies / active fire product from the VIIRS sensor aboard the joint NASA/NOAA Suomi National Polar-Orbiting Partnership (Suomi NPP) and NOAA-20 satellites, whose spatial resolution enhanced fire detection over small areas and at night-time (see Schroeder W. et al., 2014 for more details [27]).

3. Results and Discussion

In mid-October 2019, Lebanon witnessed a series of destructive wildfires. They started on 13 October in the Chouf district and some other regions, and gradually and spread through many regions 17 October, as shown in Figure 3.
Below is a complete description of the atmospheric conditions preceding the wildfires’ occurrence:
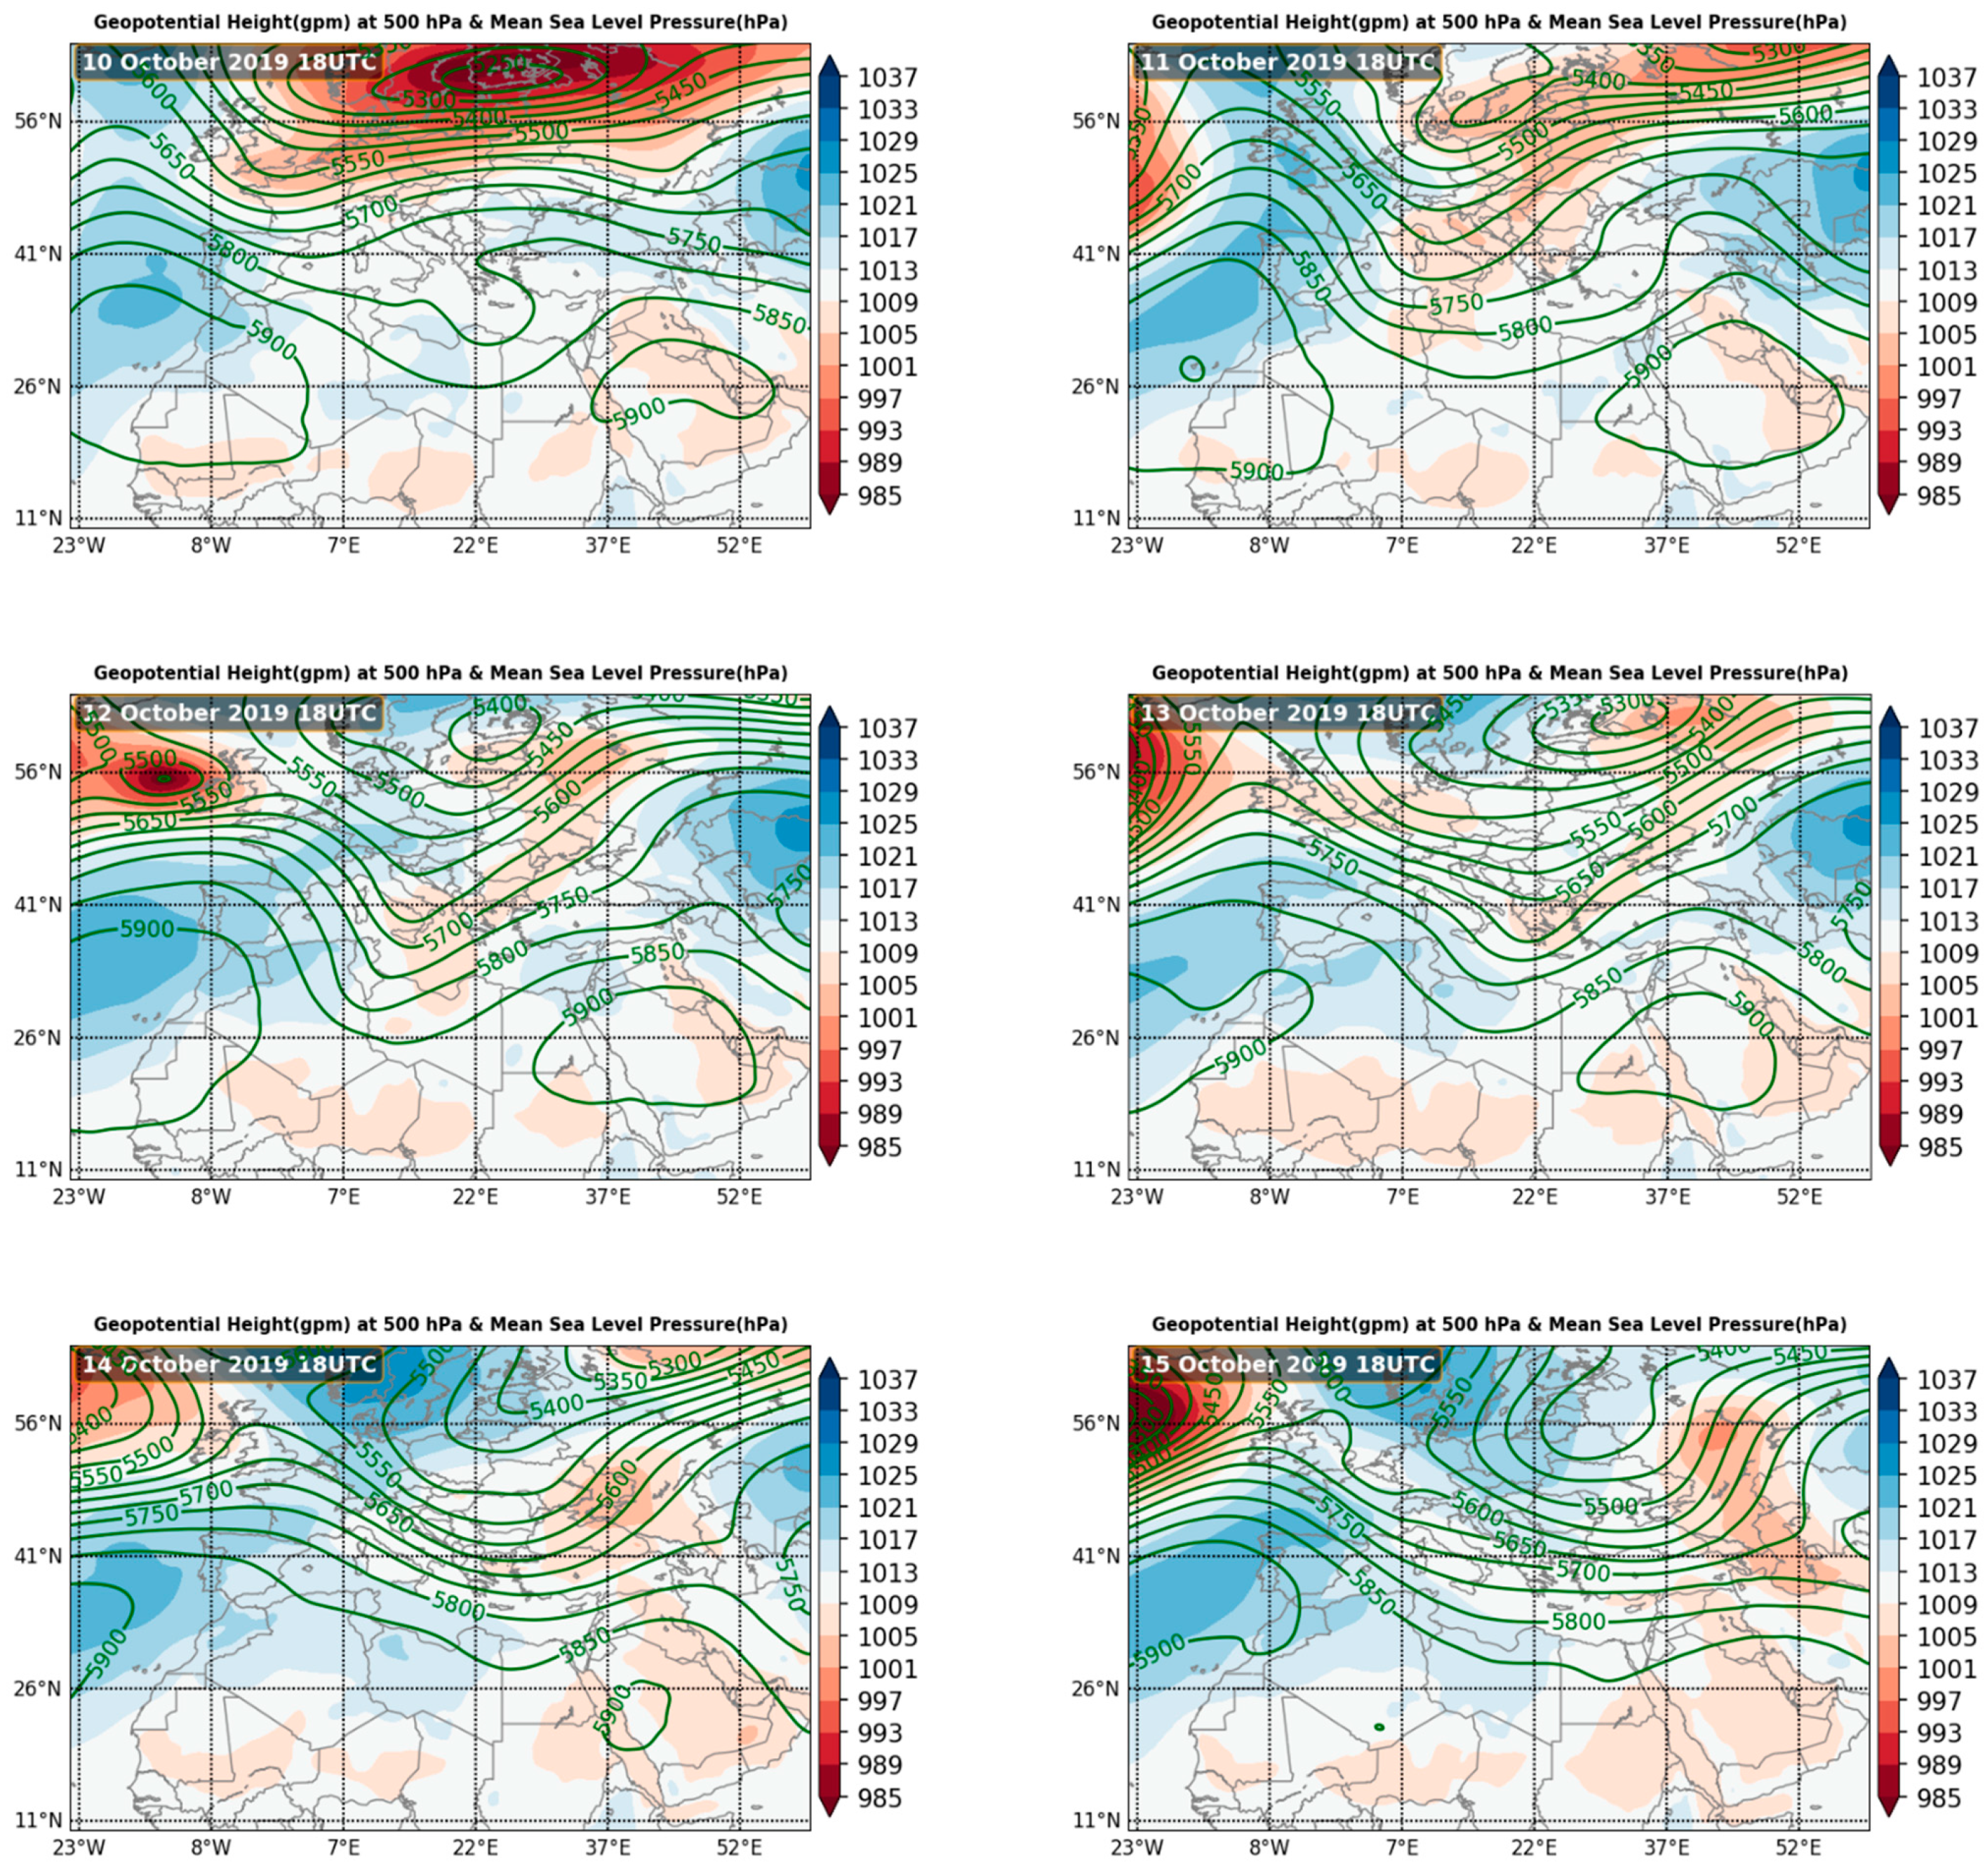
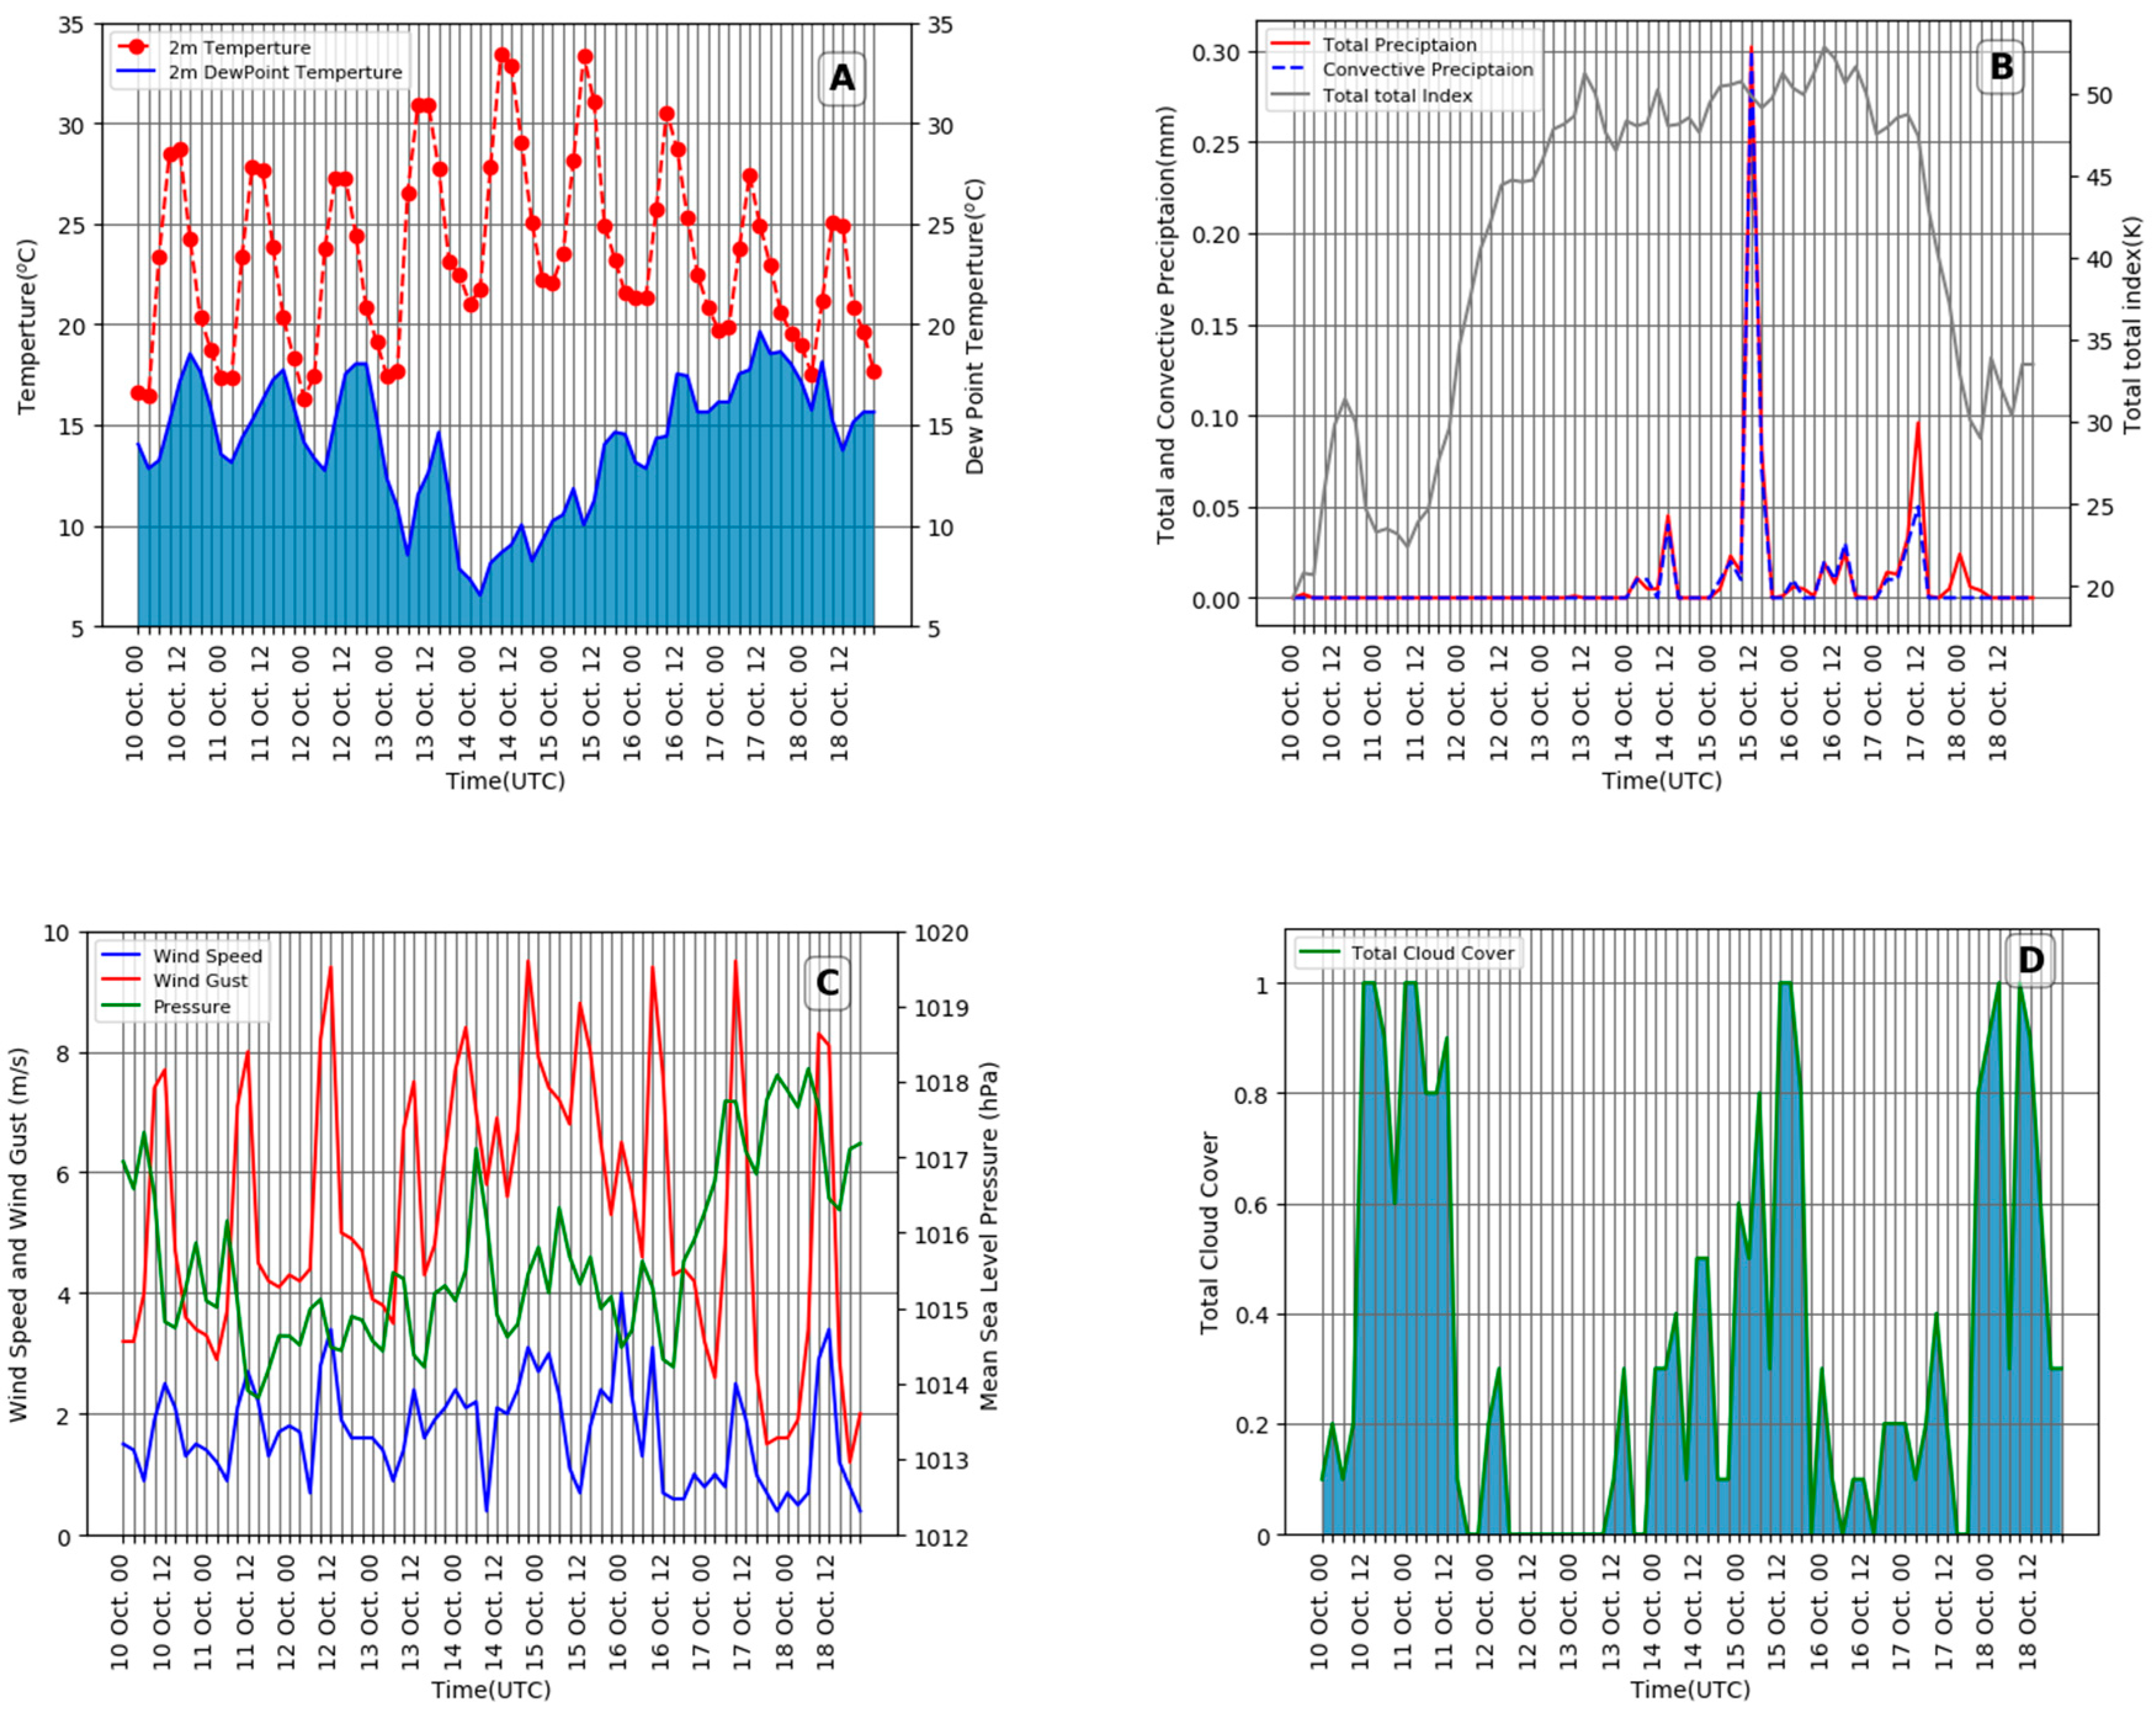
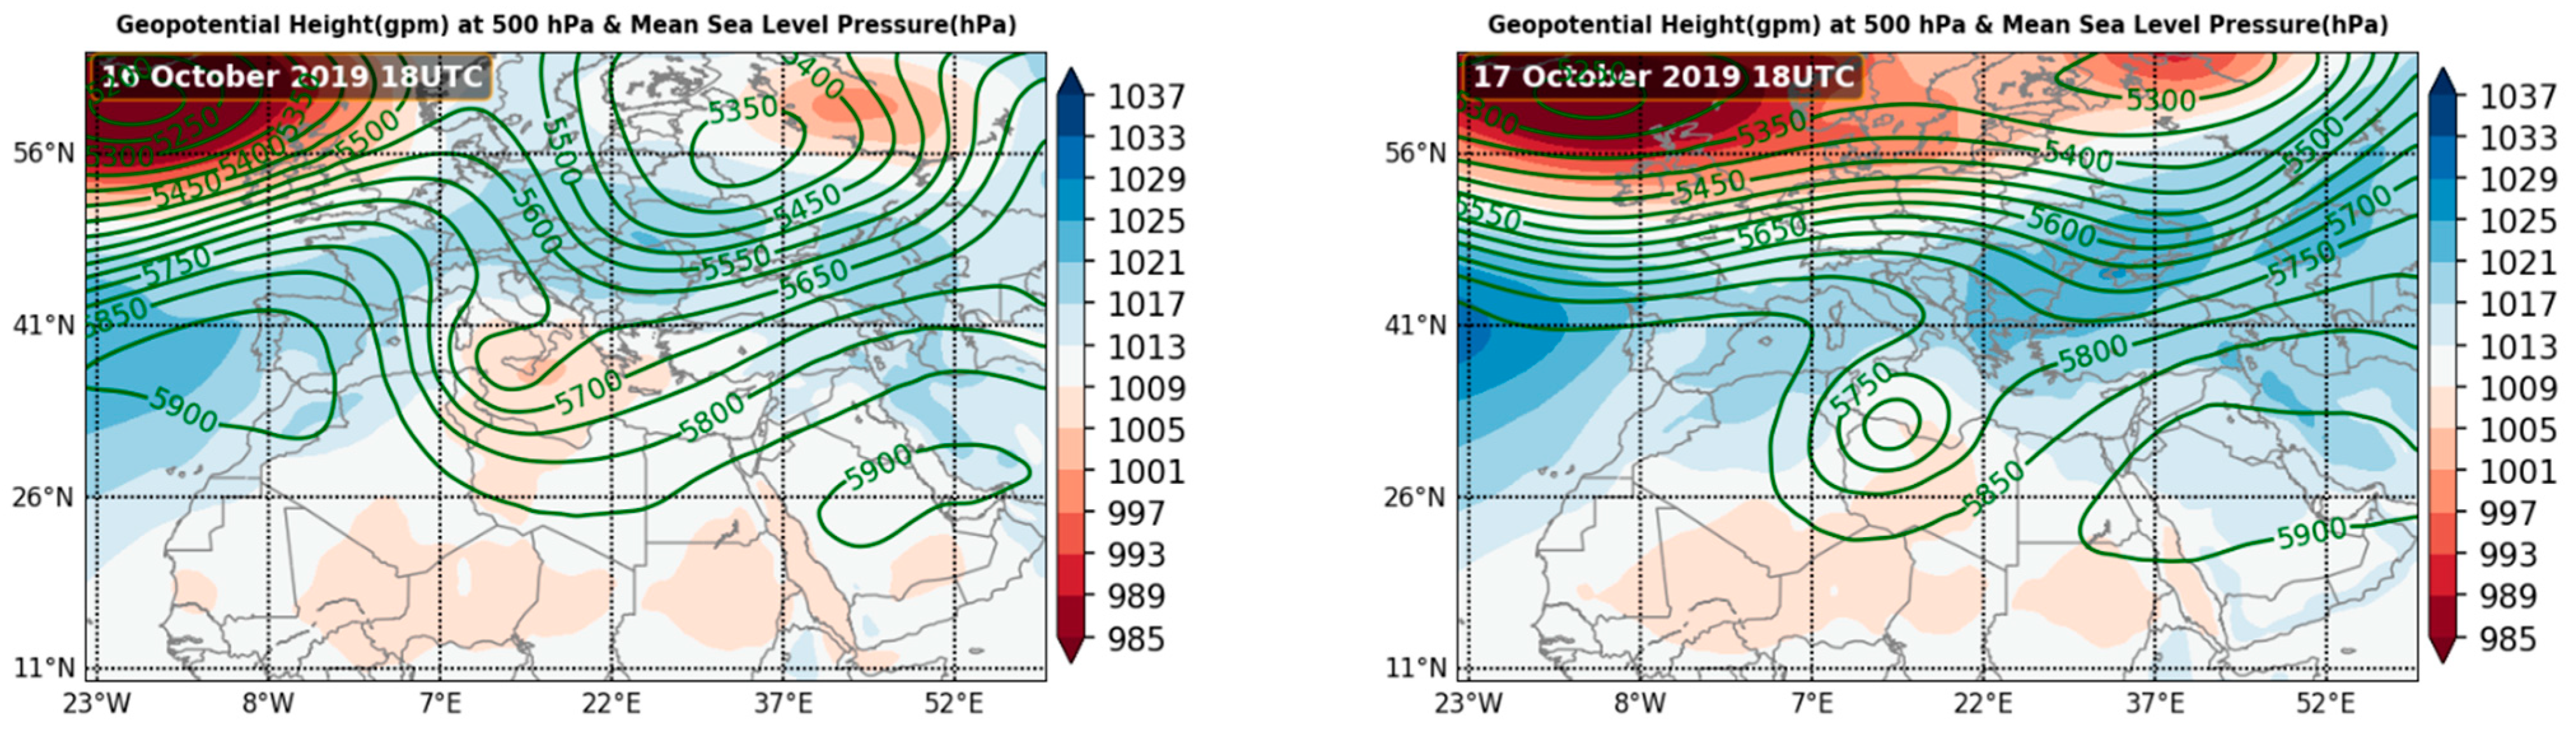
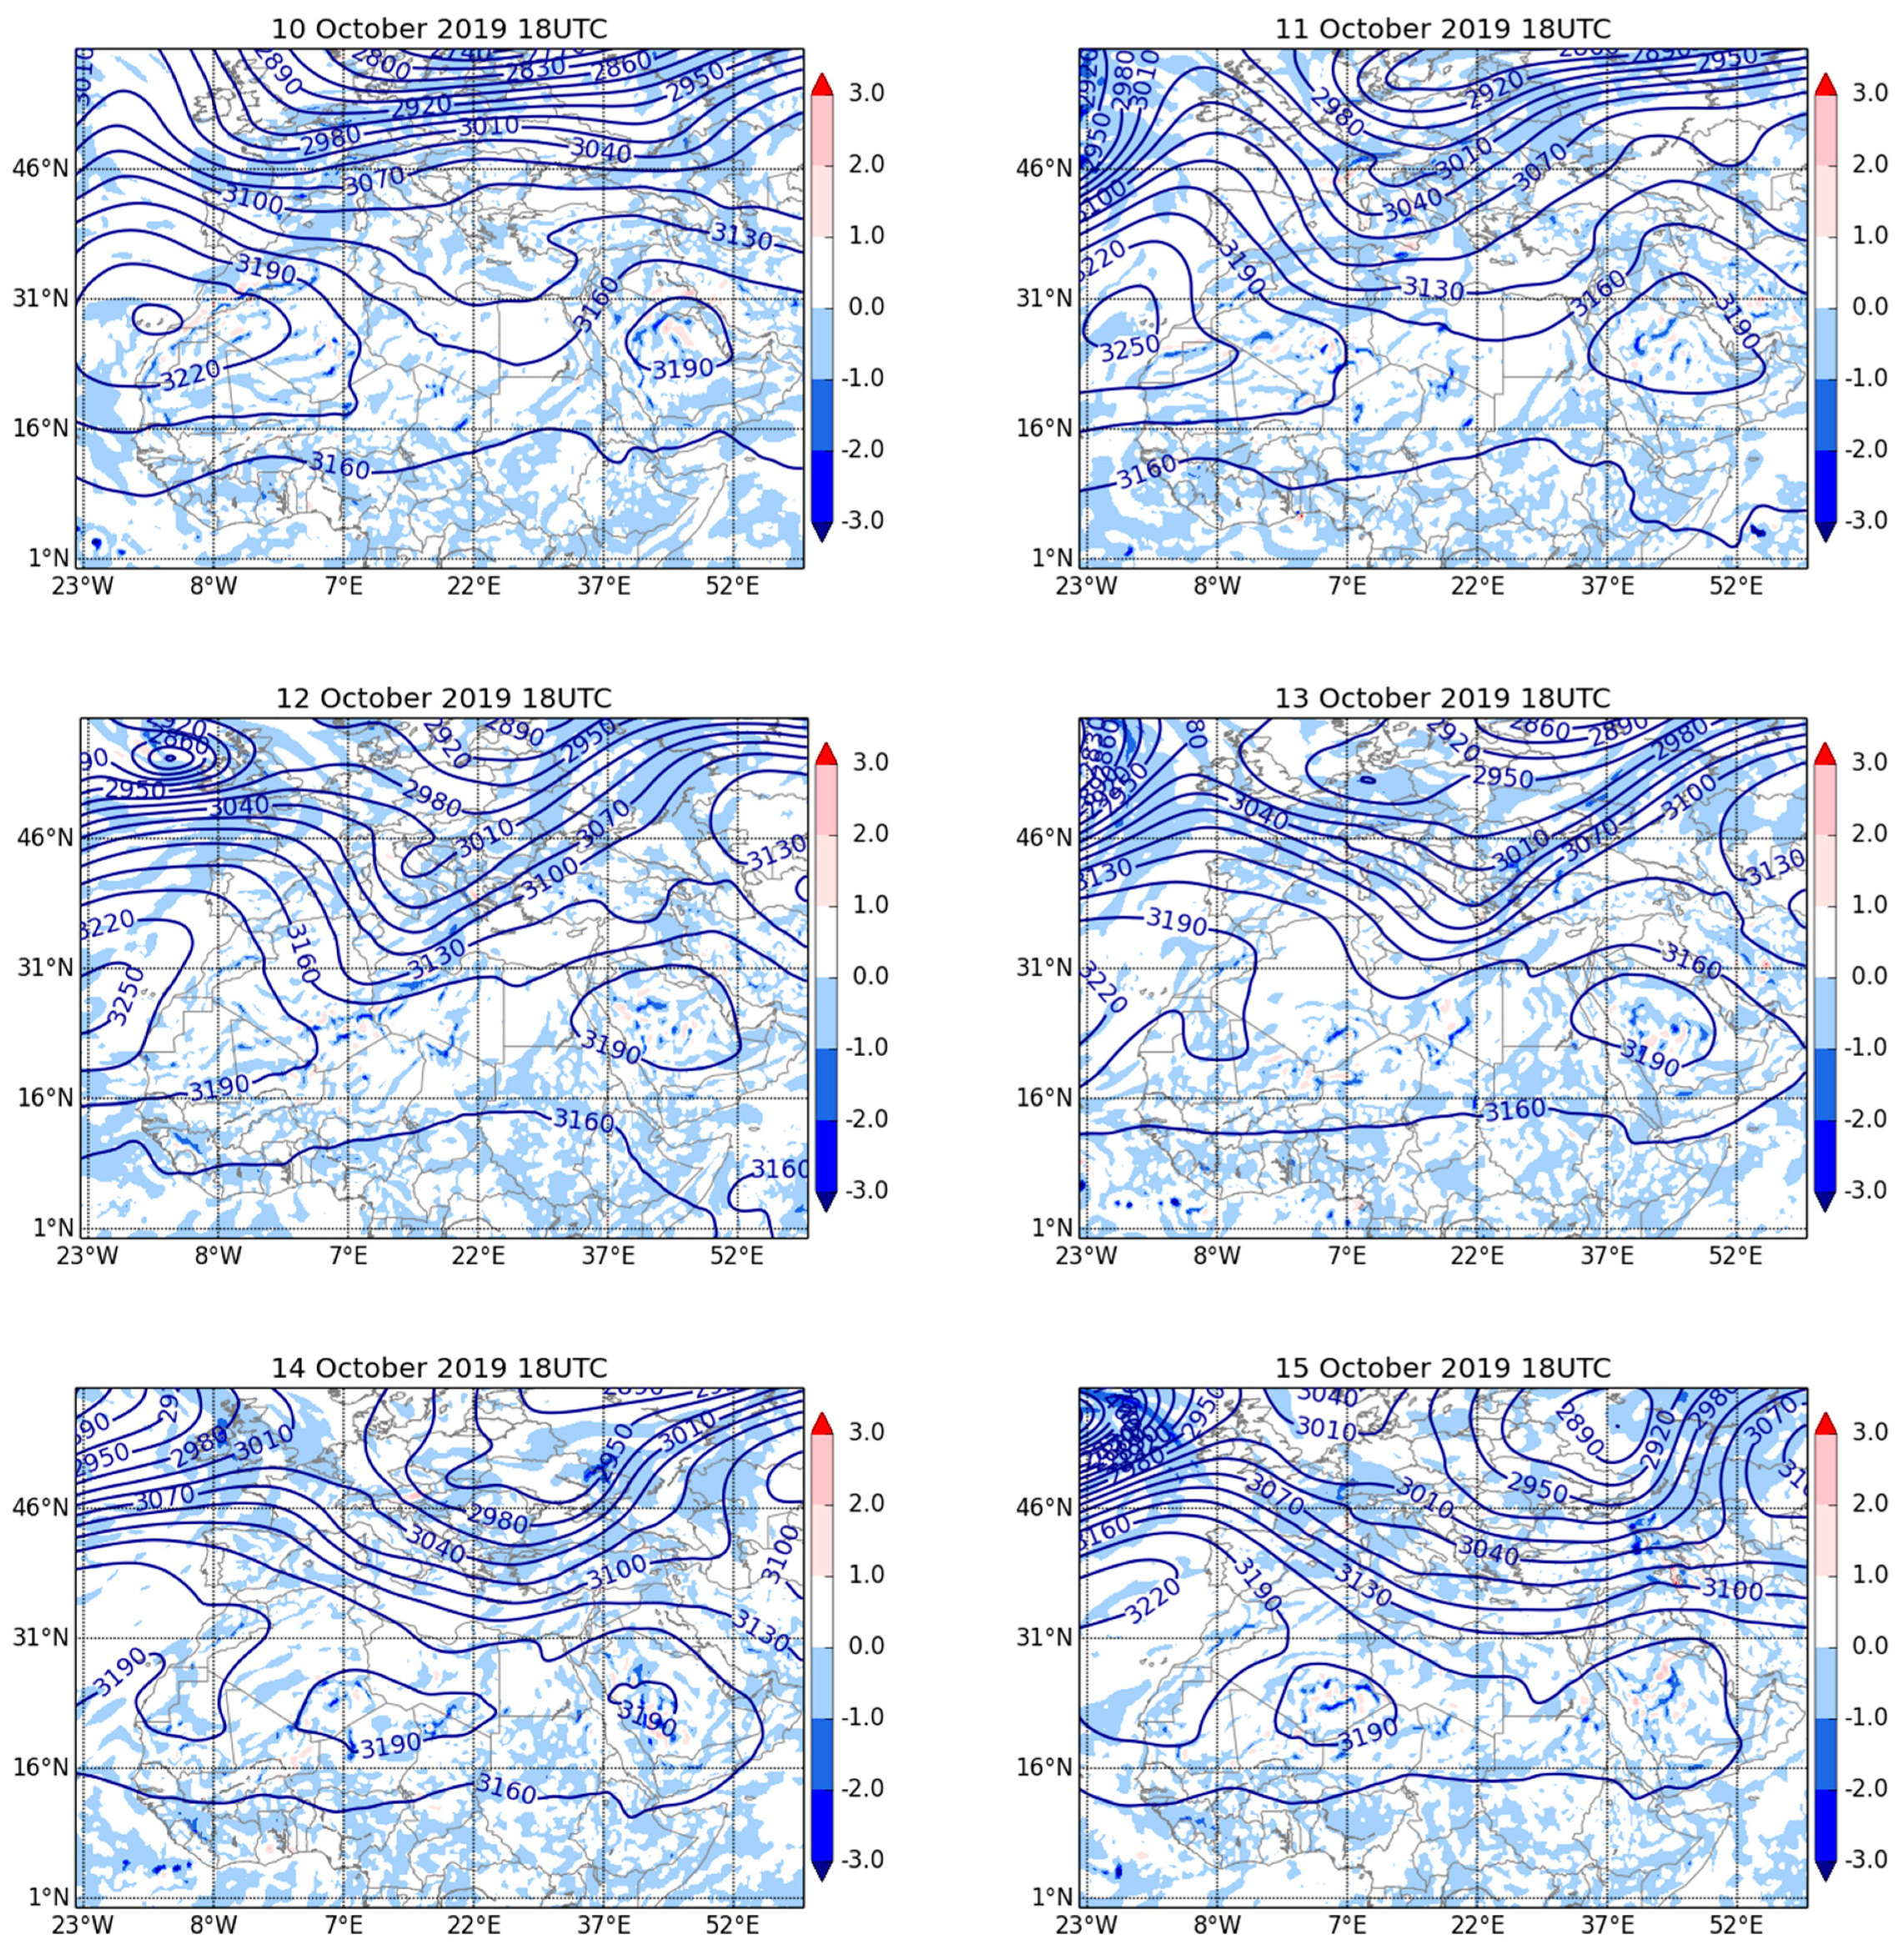
  • Before the day of the initial fire ignition (as observed on October 10, 2019 at 18 UTC), a cut-off high blocking pattern built up over the Arabian Peninsula, with a ridge extending towards the lands of the eastern Mediterranean; simultaneously, a pressure trough with an open wave, which was located over north-eastern Libya (about 22° E longitude), progressed towards the east, which caused the open wave trough to deepen and distort the long wave ridge. Meanwhile, at the surface, there was a predominant high pressure system over the eastern Mediterranean, and a cold, dry front started to progress towards the eastern Mediterranean, causing atmospheric instability (with high values on the total totals index) and a cloudy sky, as shown in Figure 4, Figure 5 and Figure 6.
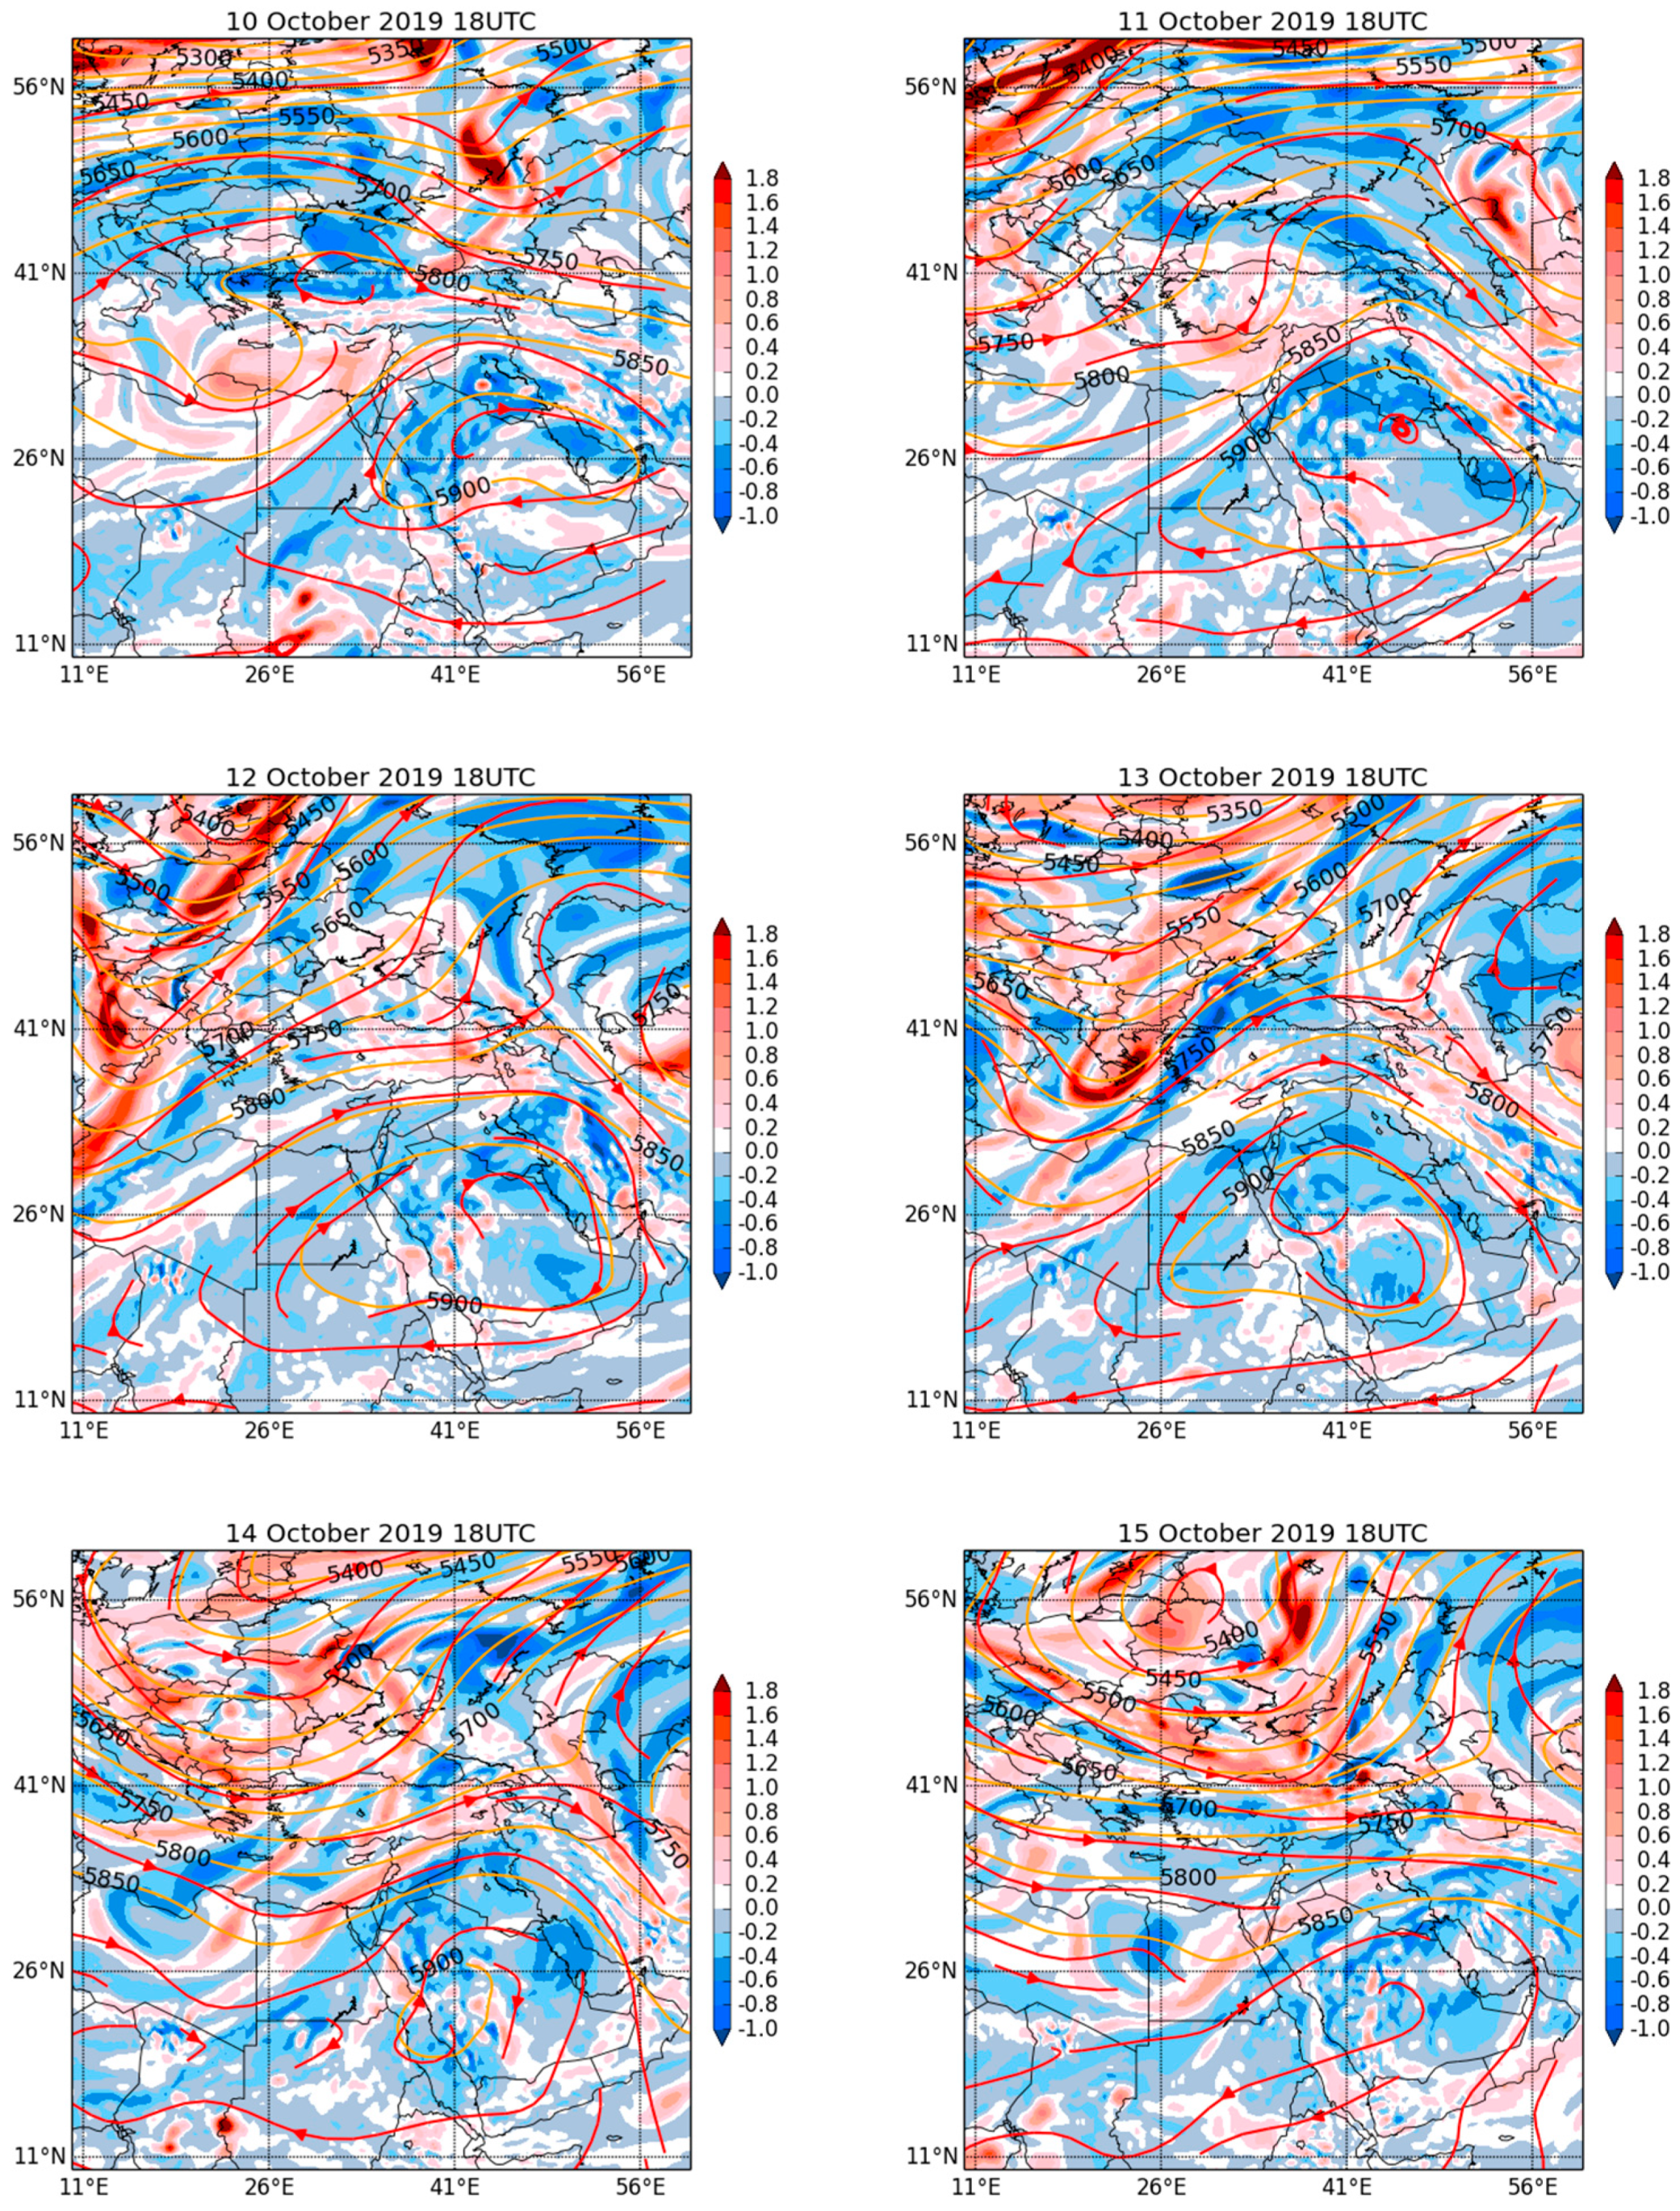
  • The progressive open wave moved towards the eastern Mediterranean with a negative tilt on 11 October at 18 UTC, resulting in cold air advection and strengthening the surface high, building up the upper ridge with a notable extension in the cut-off high. Lebanon is located in the western side of the upper ridge. With this predominant surface high pressure system (Figure 5), the ridge aloft caused a subsidence of dry air (negative relative vorticity at 500 hPa and positive vertical velocity at 700 hPa), as shown in Figure 7 and Figure 8, which compresses the air in the lower atmosphere, thereby warming it. Simultaneously, the rising heat from the earth’s surface was trapped, causing the surface to heat. As the cold dry front passed through it, the Chouf region witnessed a lower temperature, cloudy skies with unstable conditions (with higher values of the total totals index) and gusty winds, as shown in Figure 4.
  • The next day, on 12th October, at 18 UTC, the cold front passed, and the region experienced a cooler temperature, a slightly higher dew point temperature and mostly clear skies (Figure 4 and Figure 5). On the upper level, the trough deepened and progressed rapidly to the east with a positive tilt, and the shortwave moved to the western side of the upper ridge, causing it to flattening; meanwhile, the surface high still predominated over the region (see Figure 5.) This situation again led to warmer, drier and unstable conditions the next day due to the air subsidence over the eastern Mediterranean (negative relative vorticity at 500 hPa and positive vertical velocity at 700 hPa), as shown in Figure 5, Figure 7 and Figure 8.
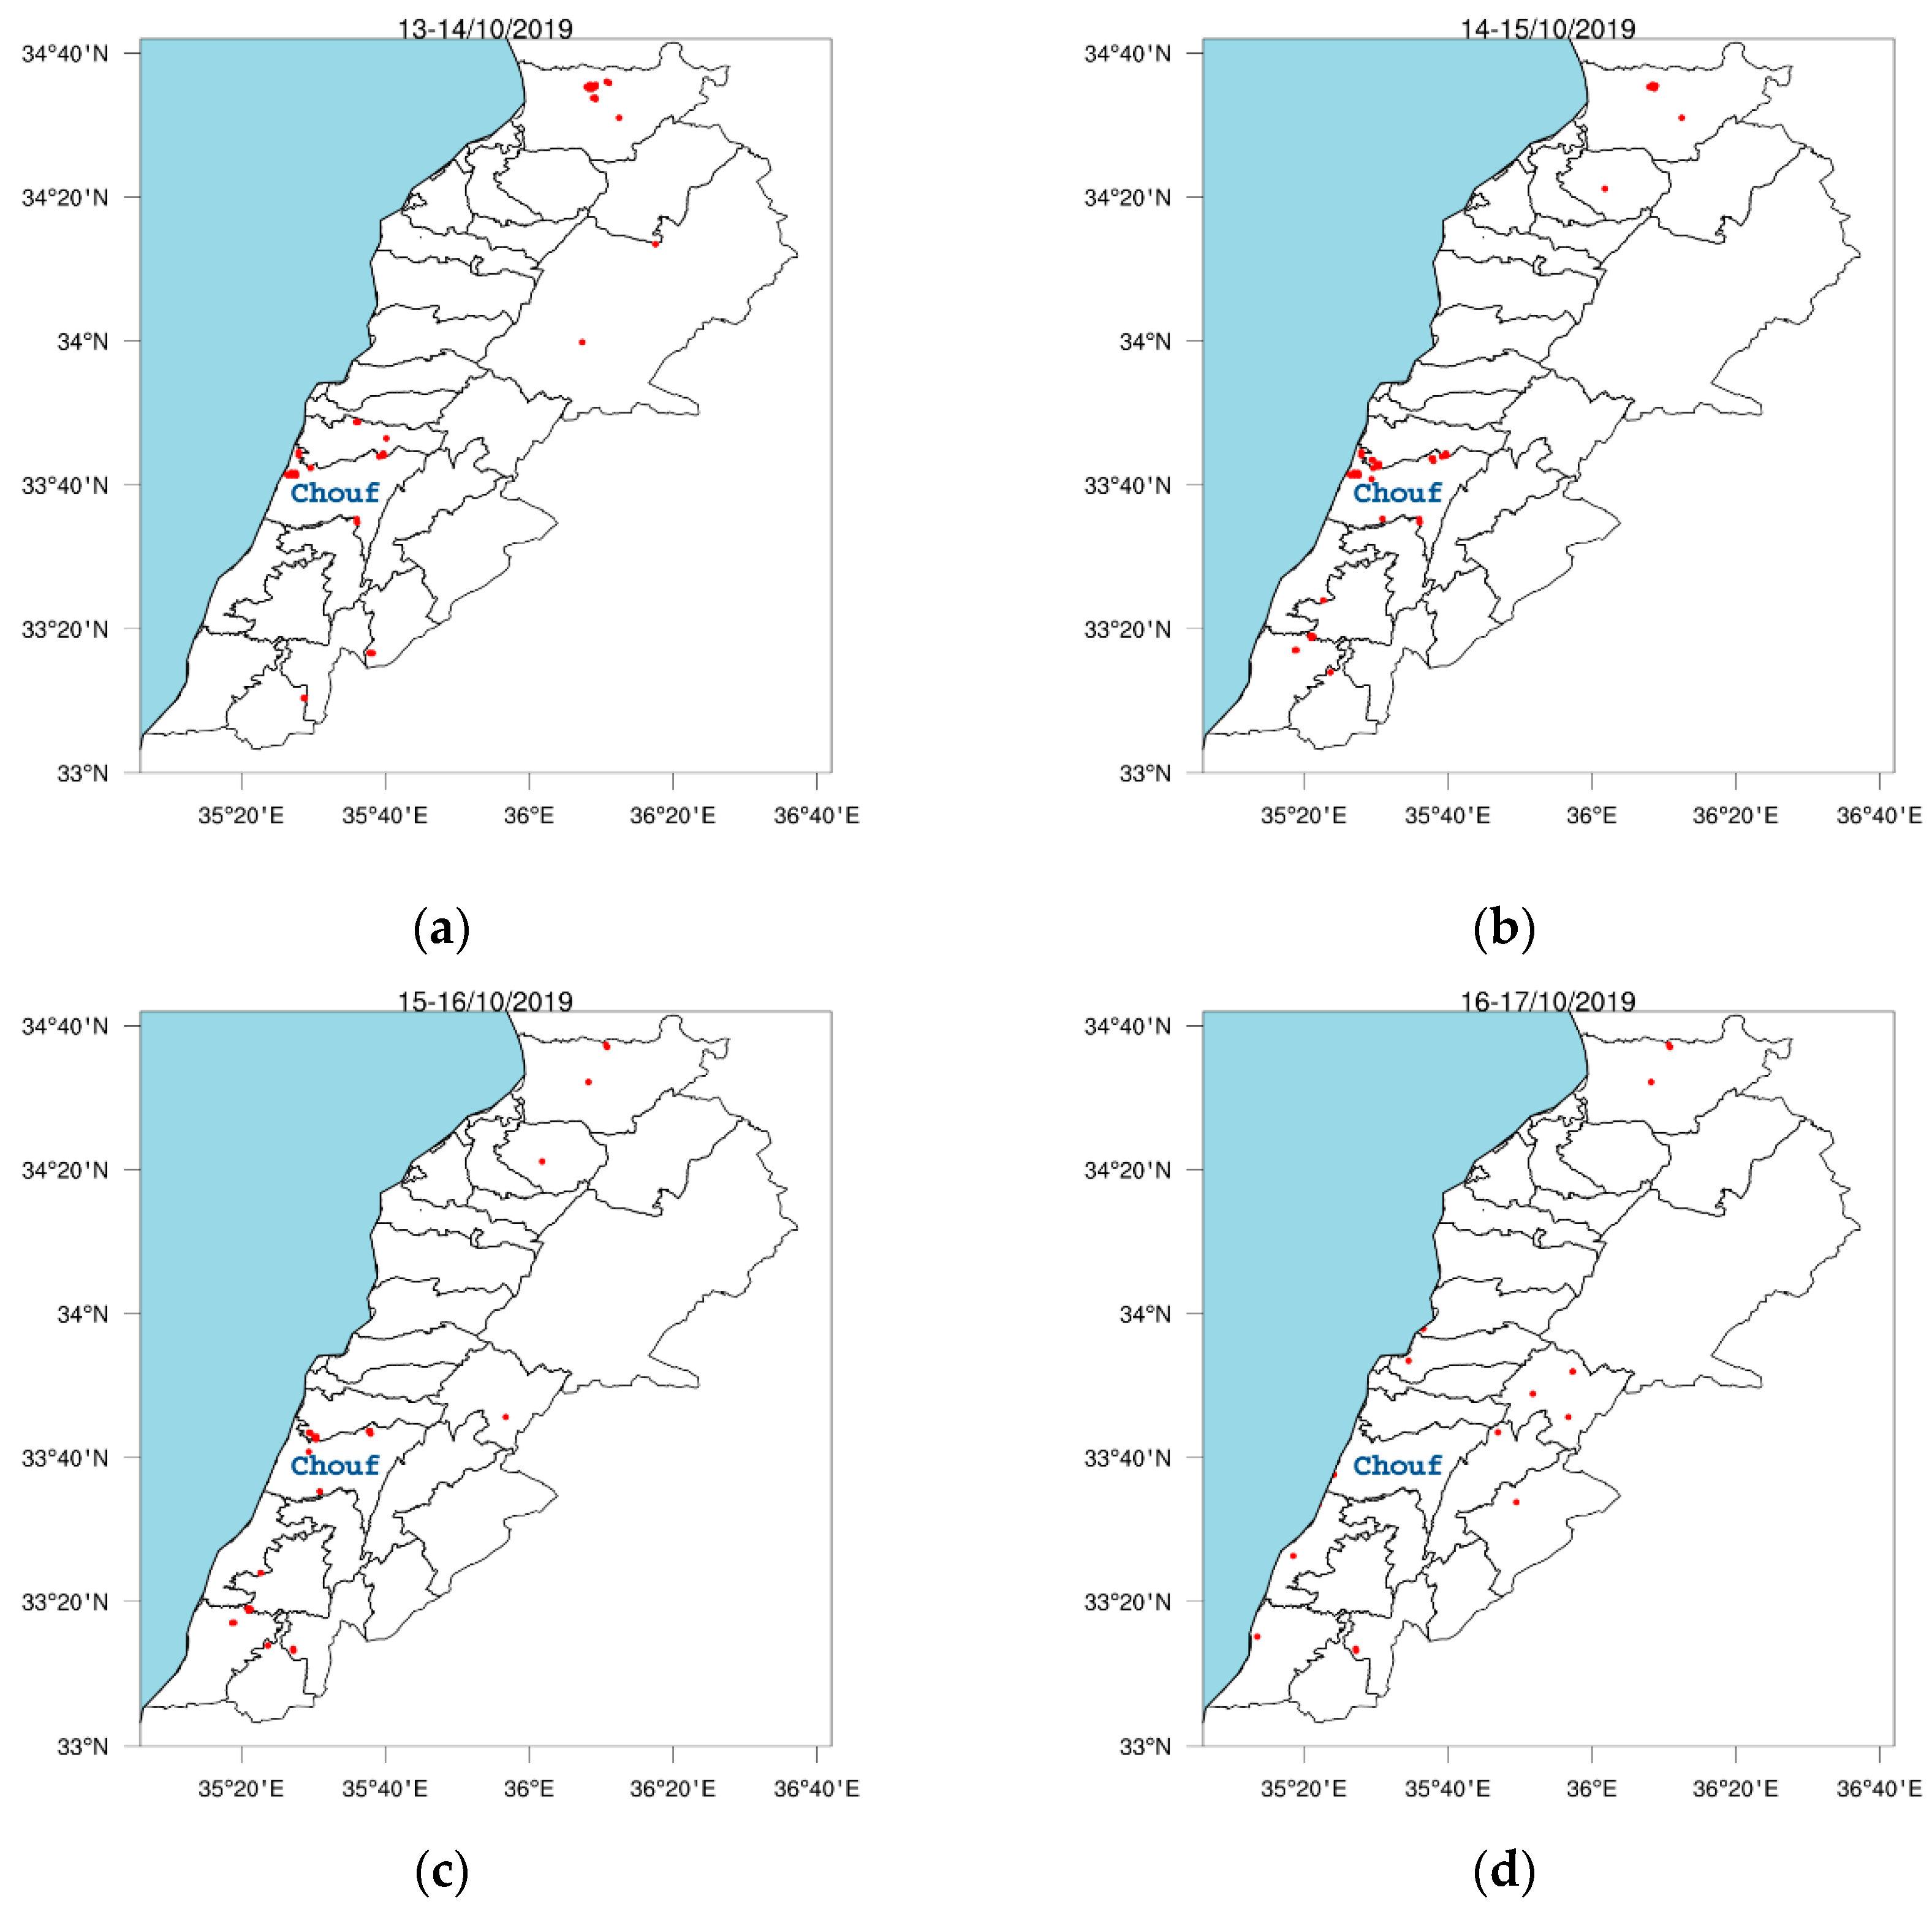
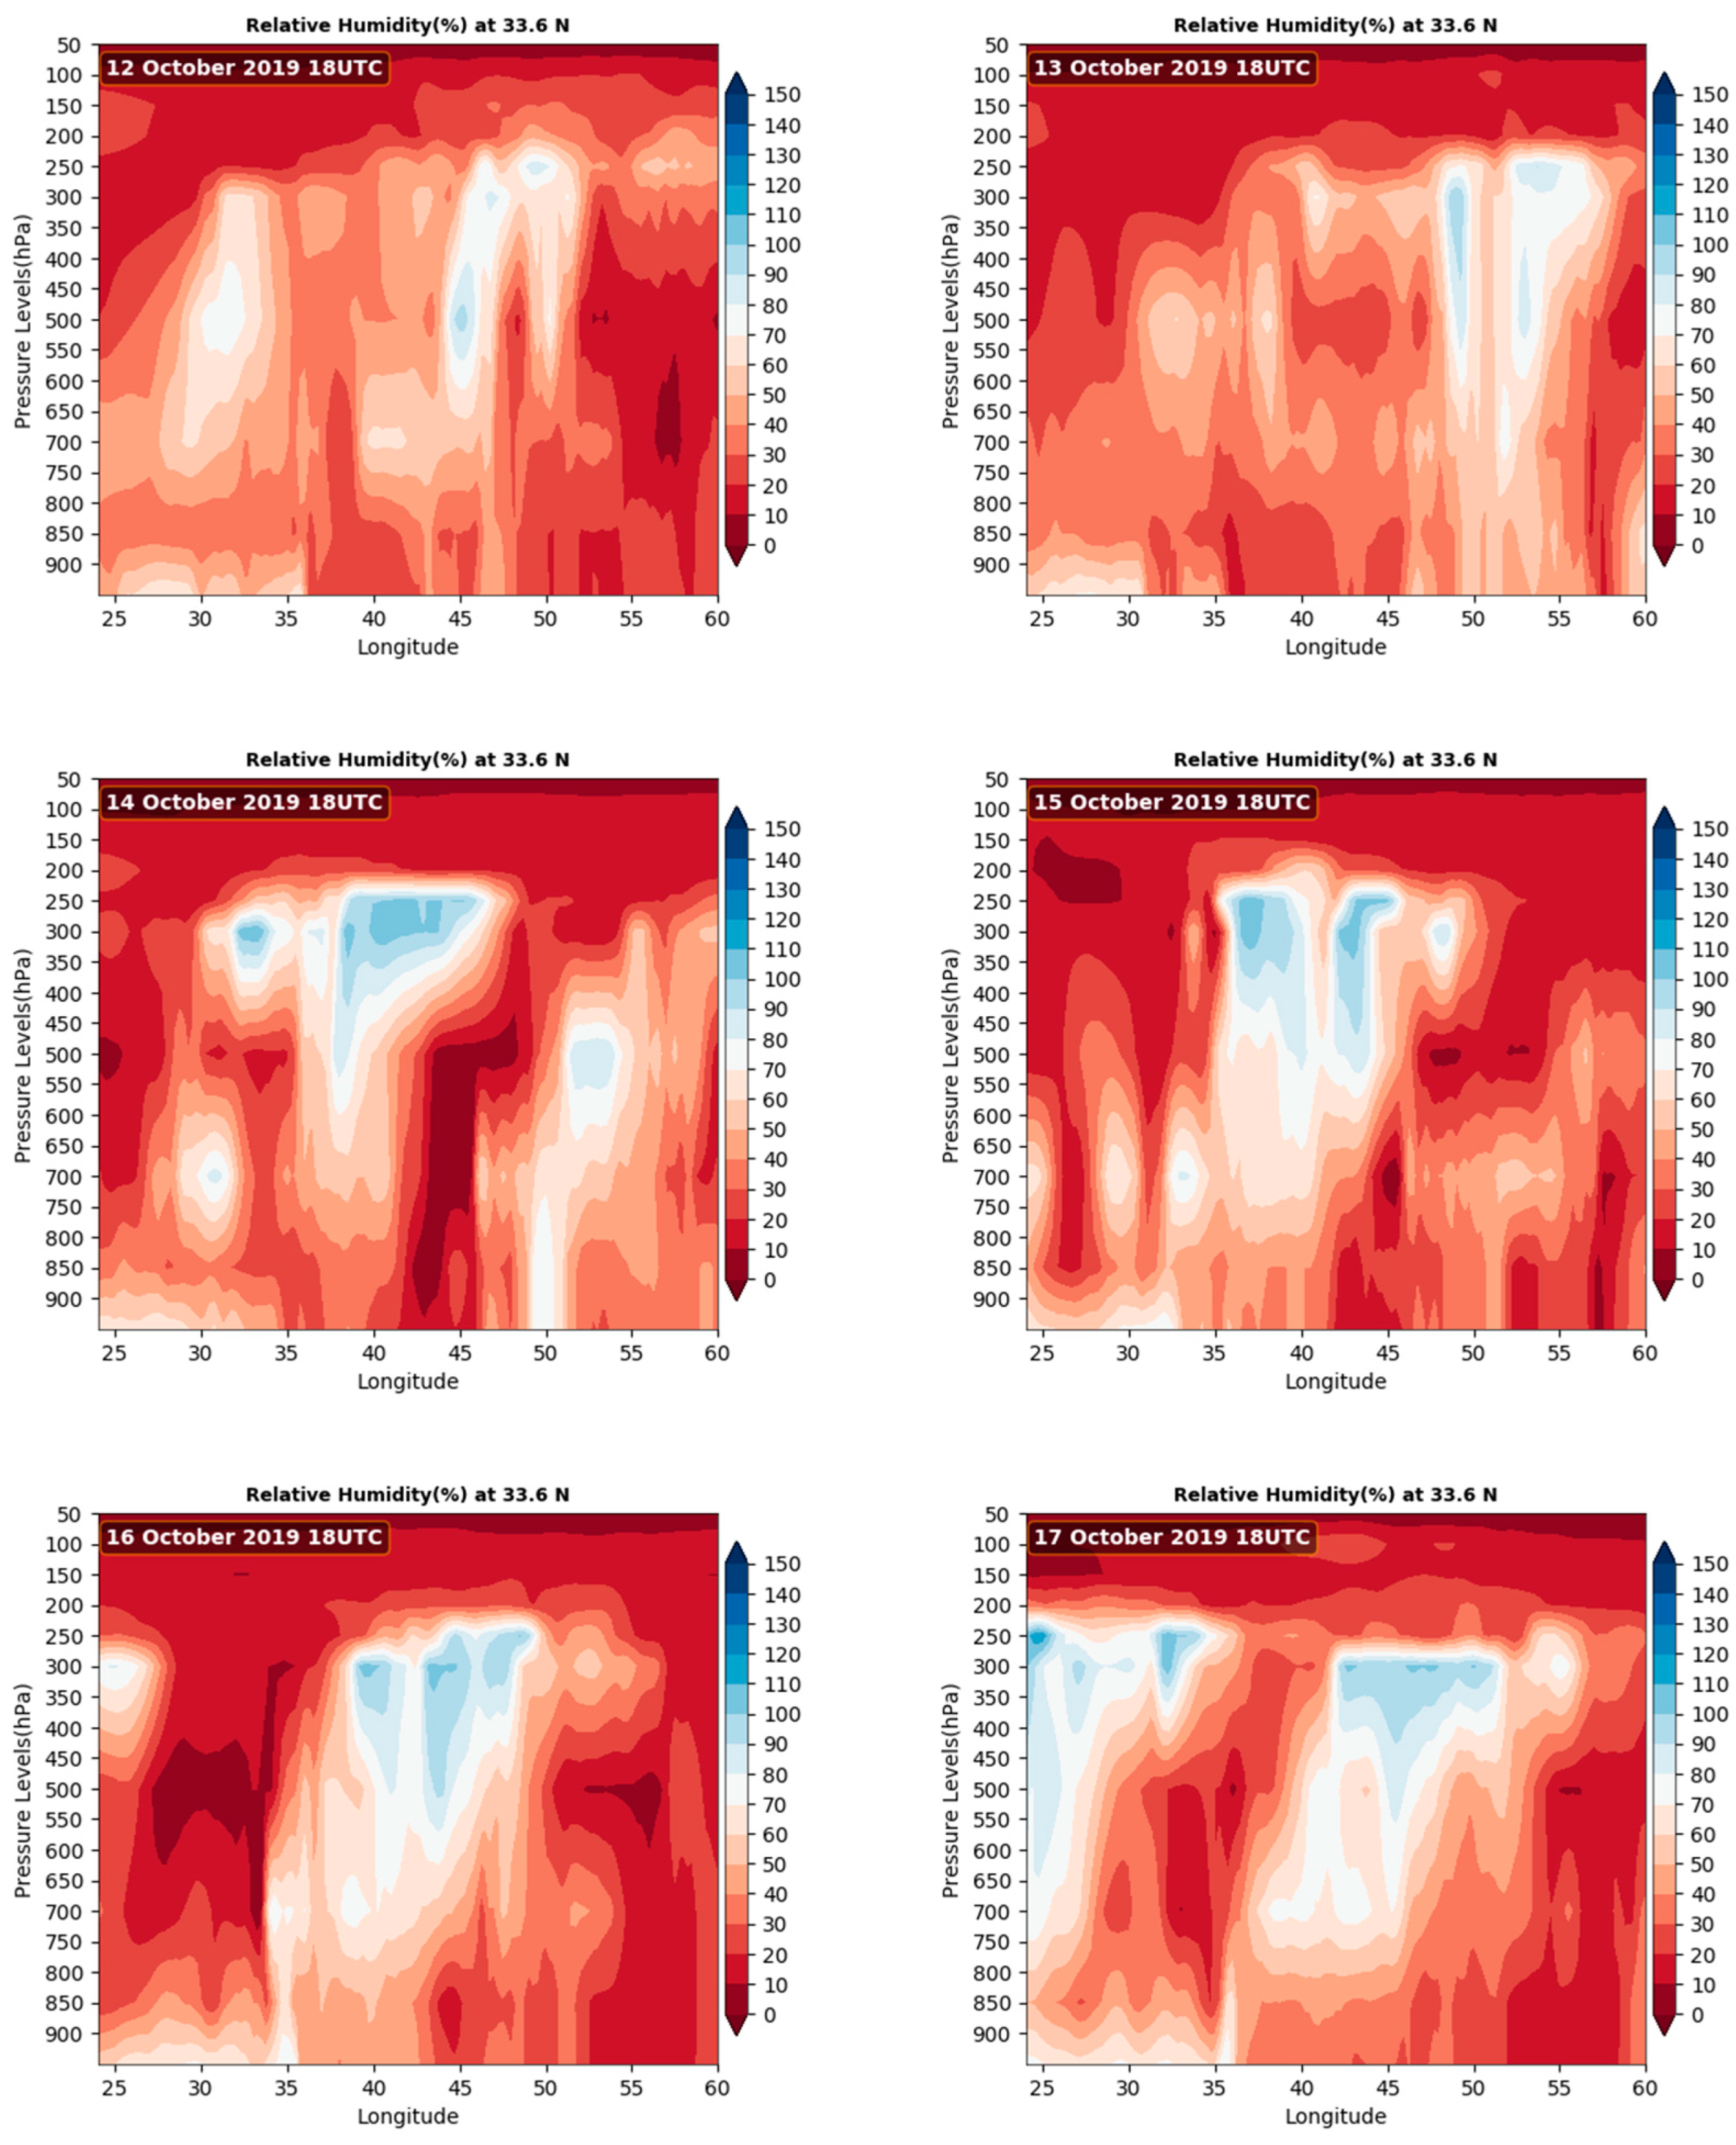
  • On 13 October, at 18 UTC, the deepened trough continued its progress towards the eastern Mediterranean, and the upper ridge built up again. Lebanon is located in the transition zone between the upper trough and the upper ridge (see Figure 5), which considered as a region of atmospheric instability due to the strong wind aloft moving downward producing low-level jets and surface daytime heating simultaneously, with particularly clear skies (see Figure 6). This led to the activation of the surface high and, consequently, warmer and drier conditions. Chouf district witnessed a higher temperature and a lower dew point, as shown in Figure 4. Moreover, with the availability of mid-level moisture, which is needed for the formation of convective clouds, thunder sparked the fire in the Chouf and dry fuels regions, as shown in Figure 9.
  • On 14 October, at 18 UTC, as seen in Figure 5, both the upper patterns and the surface high weakened, enhancing surface Indian Monsoon at the surface level, and shifted towards the eastern Mediterranean. The surface heating continued, with lower dew point temperatures and unstable conditions (the total totals index reached more than 50 in Chouf), as shown in Figure 4. This situation represented the breakdown of the upper ridge, leading to the high-speed advection of dry wind towards the low levels, producing low-level jets associated with the surface front. Moreover, with the available moisture at the mid-levels, as shown in Figure 9, convective clouds developed, as explained above, producing thunderstorms with no rain over the Chouf district. This caused the lightning that we believe ignited the dry fuels (Figure 3). Consequently, rapid fire spread due to gusty surface winds in Chouf, which experienced temperatures higher than the average. In addition to the role of the wind in spreading the fires to farther regions, the thunder clouds that formed over other regions due to the rising current carried condensation nuclei (such as ash) emitted from the forest fires, igniting new fires in other forests.
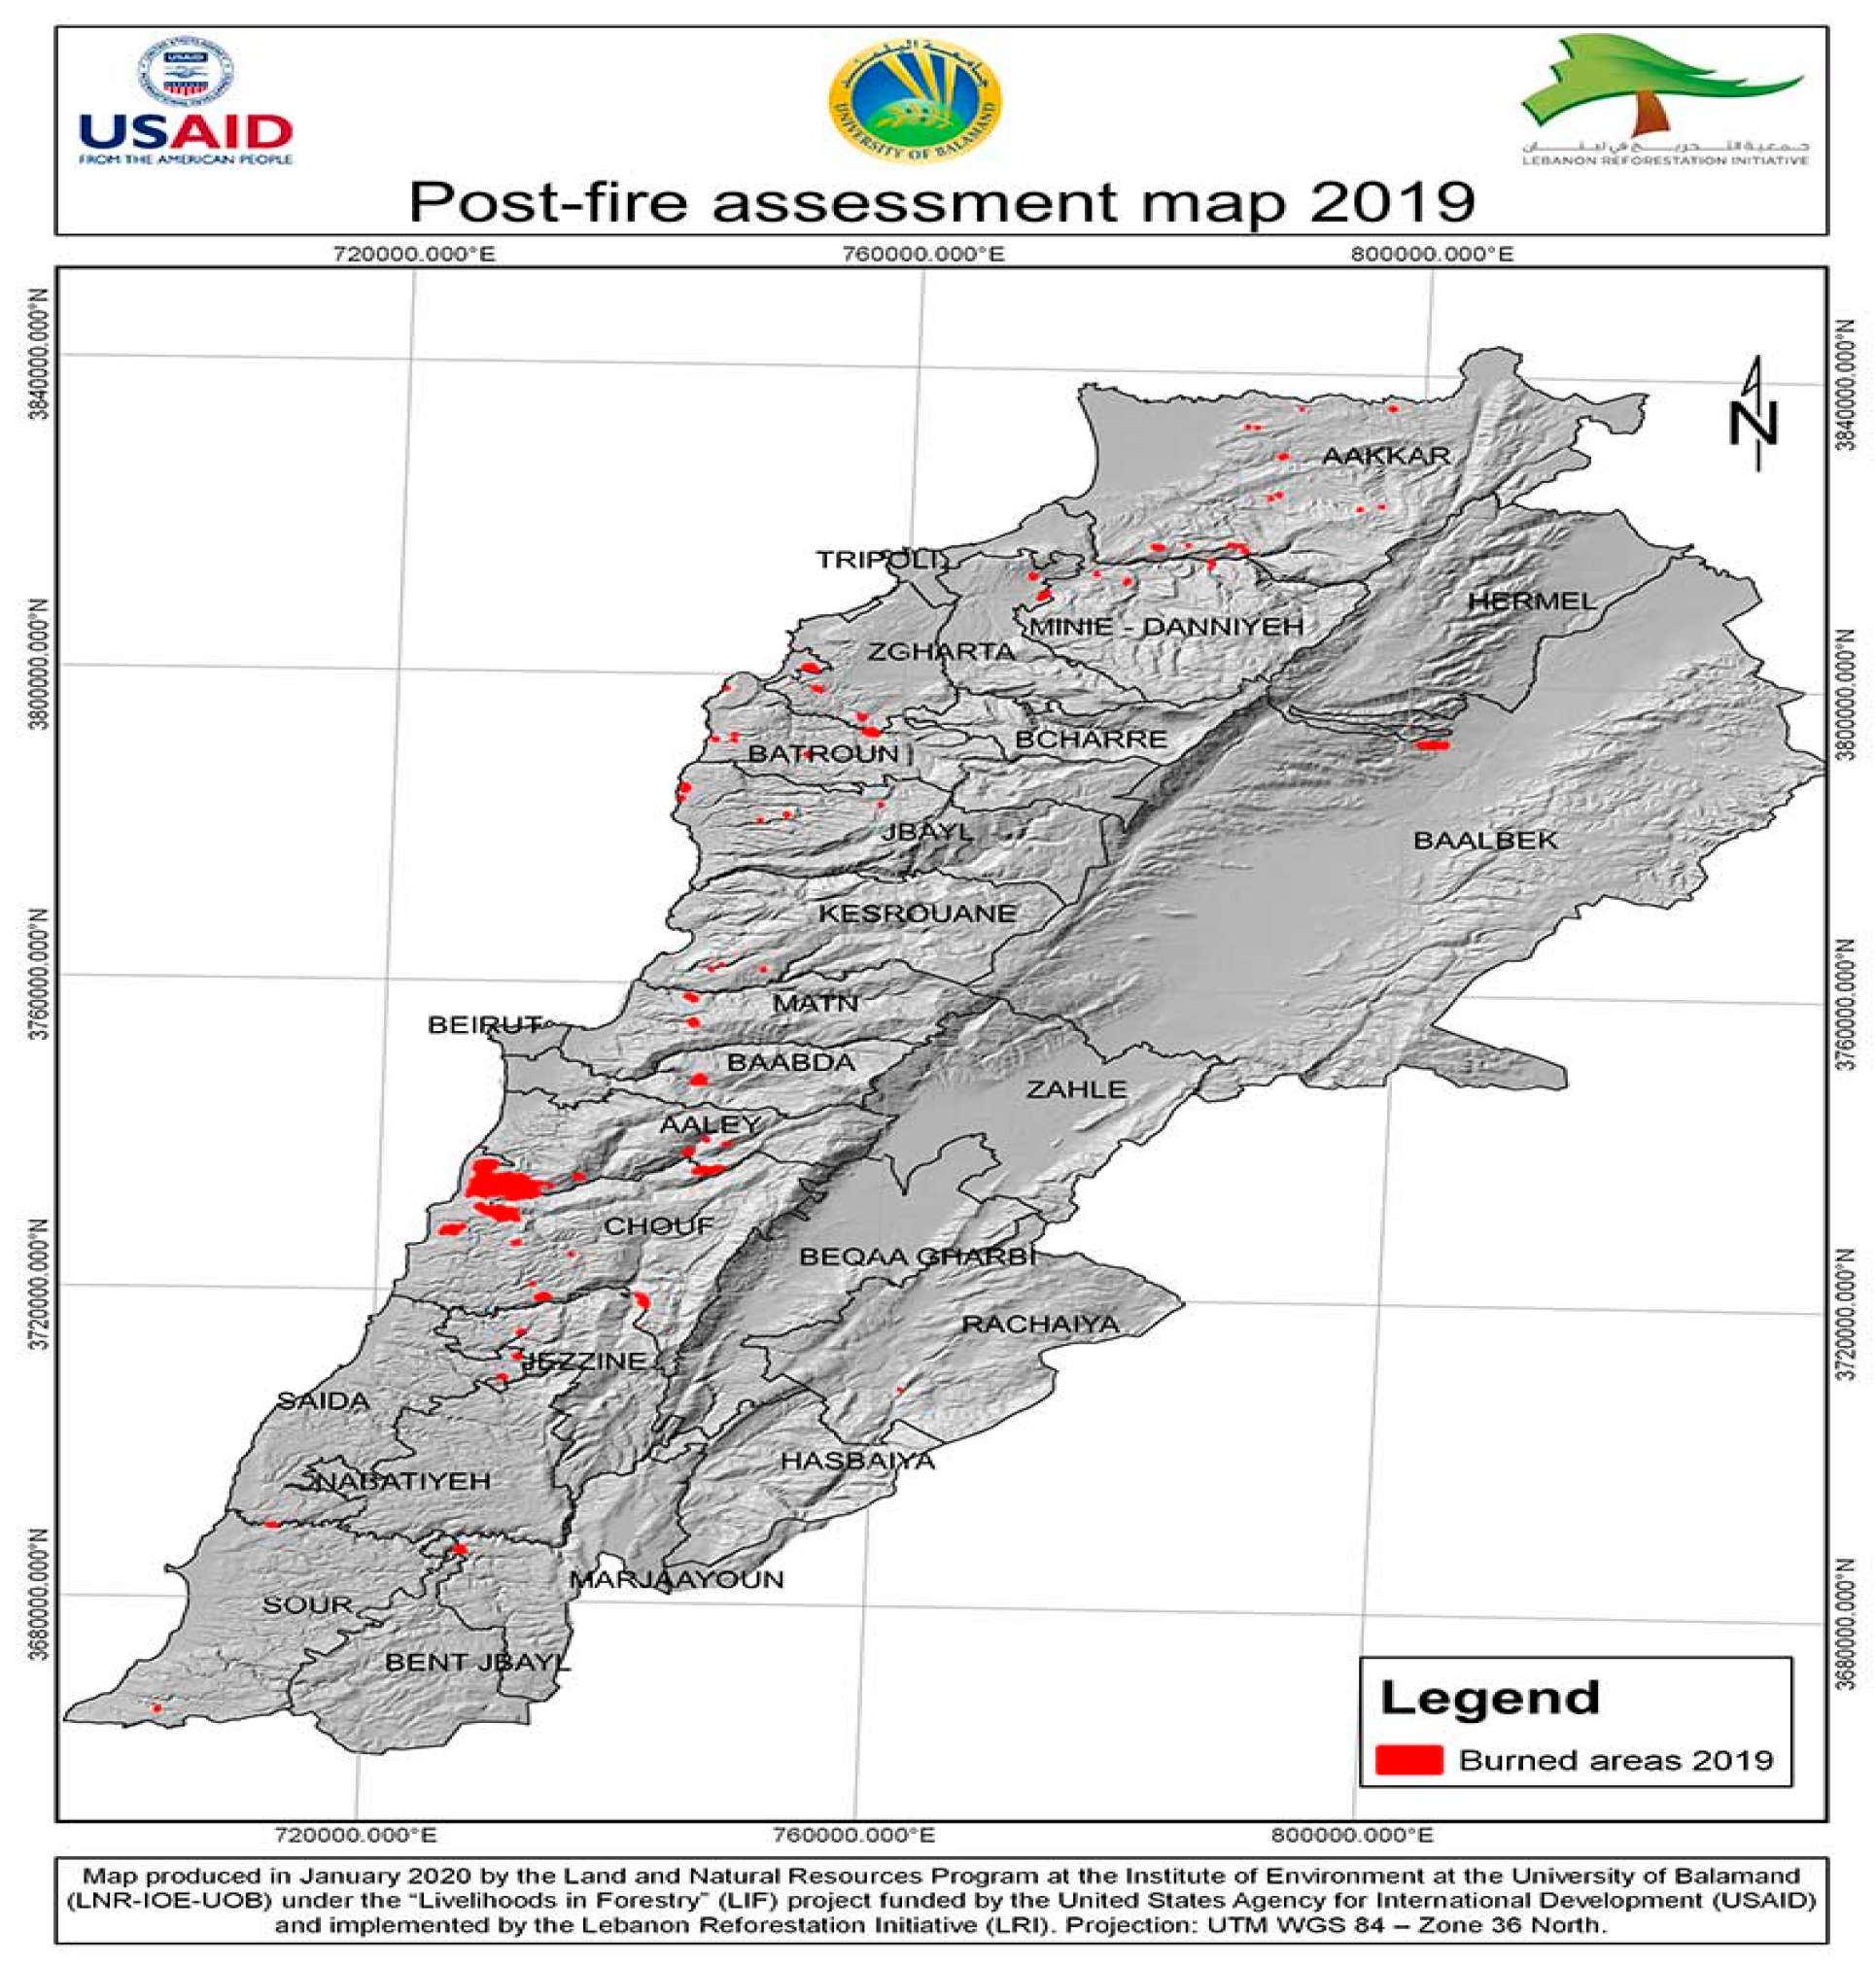
  • The situation at 18 UTC on 15 October continued, because the upper flow was “Zonal” and, as a result, the weather at the surface remained warmer and drier than average (see Figure 5), with the rising hot air from the forest fires reaching colder air at higher levels, with the available moisture (Figure 9), leading to the development of convective clouds, which in turn produced thunderstorms and lightning, with convective precipitation over Chouf of about 0.3 mm (Figure 4). The number of affected regions in the Chouf district increased, as shown in Figure 1.
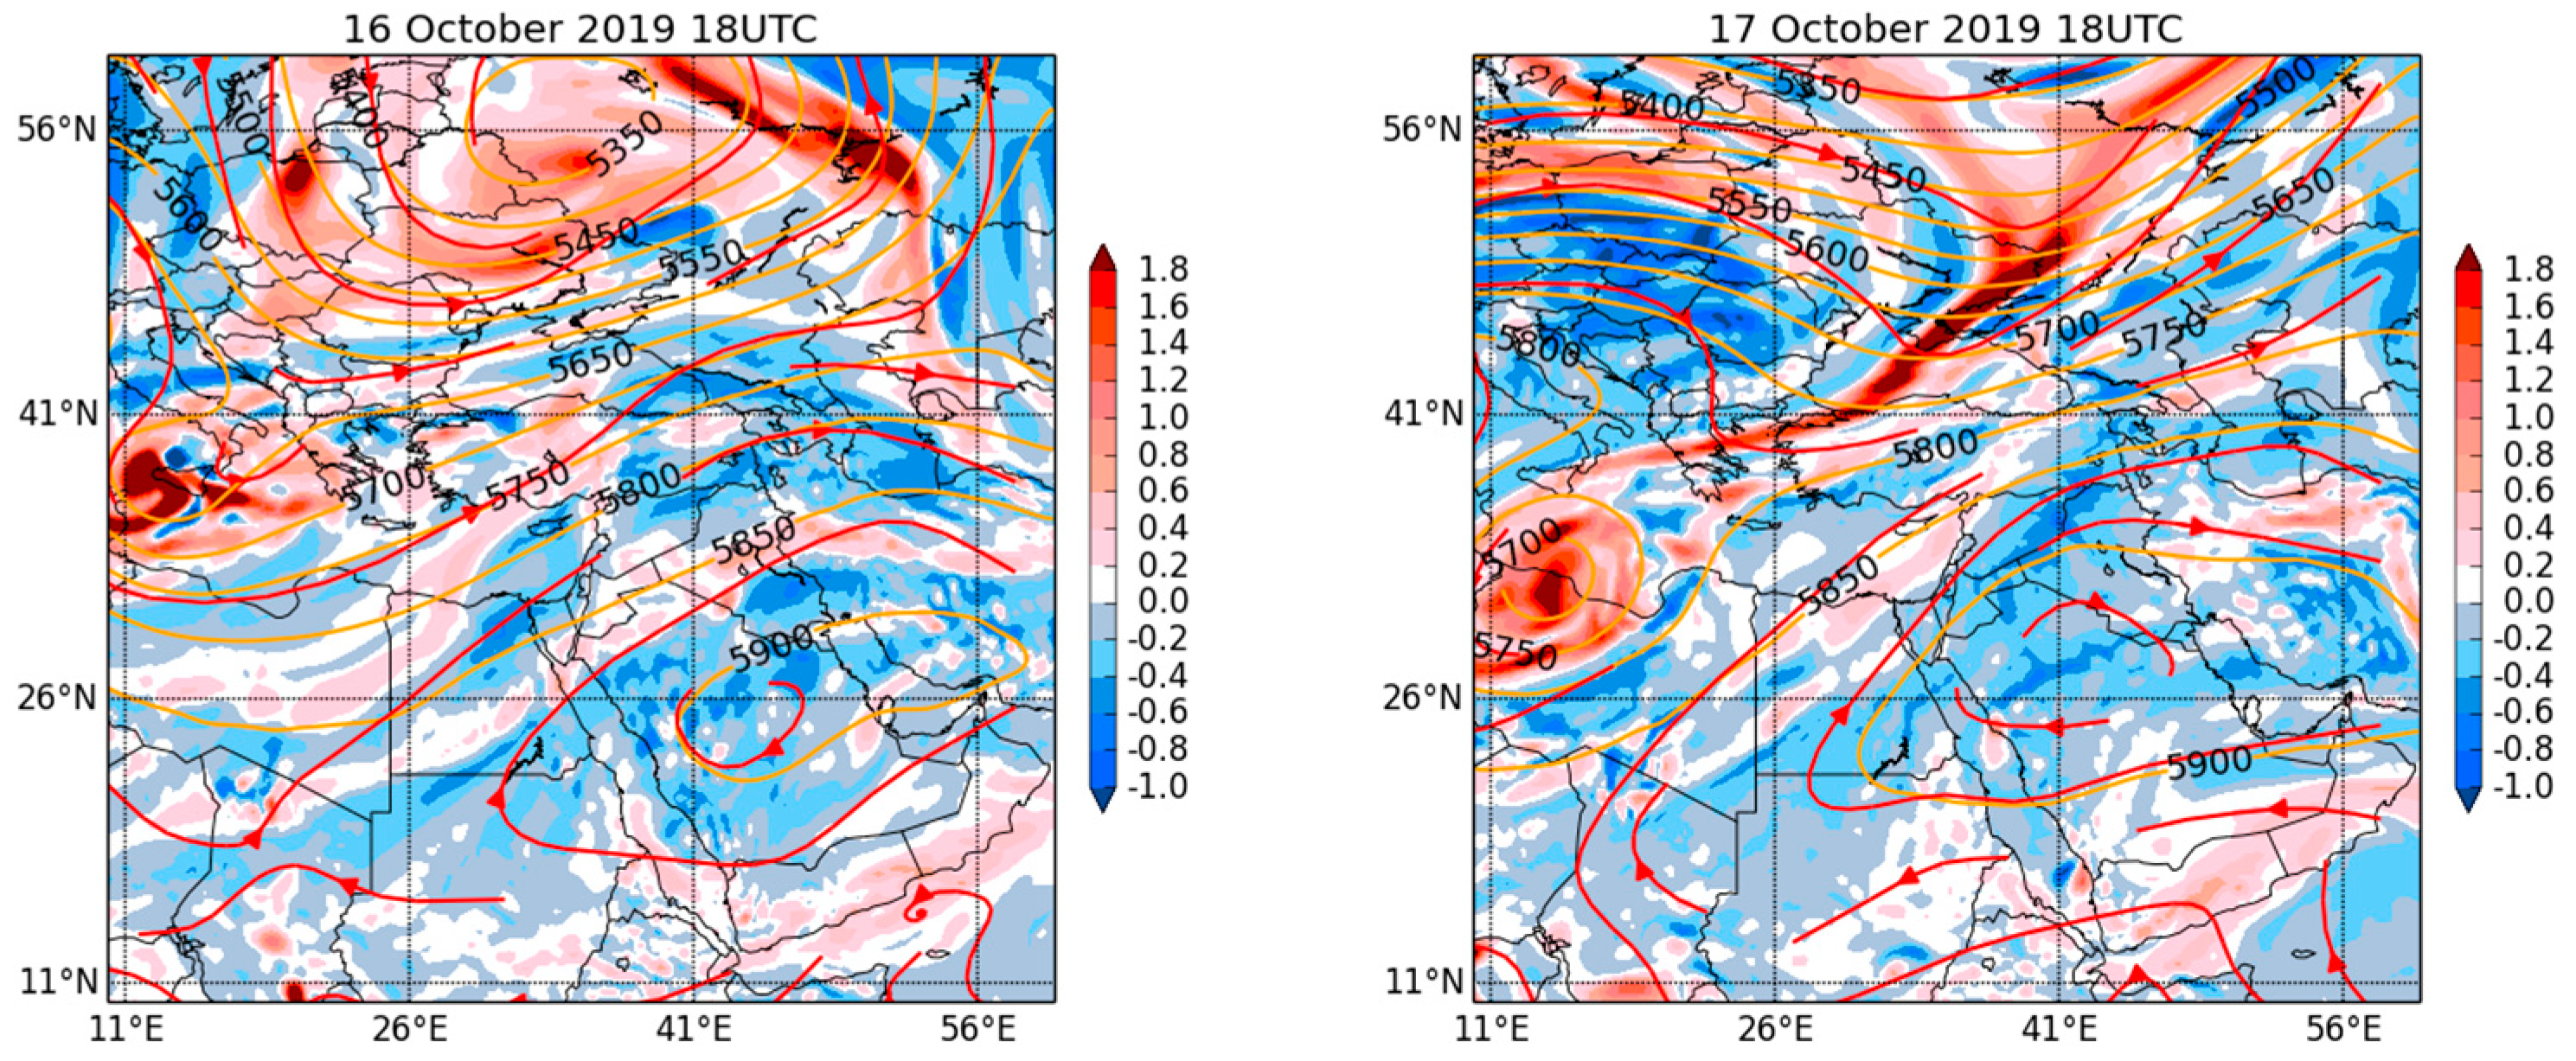
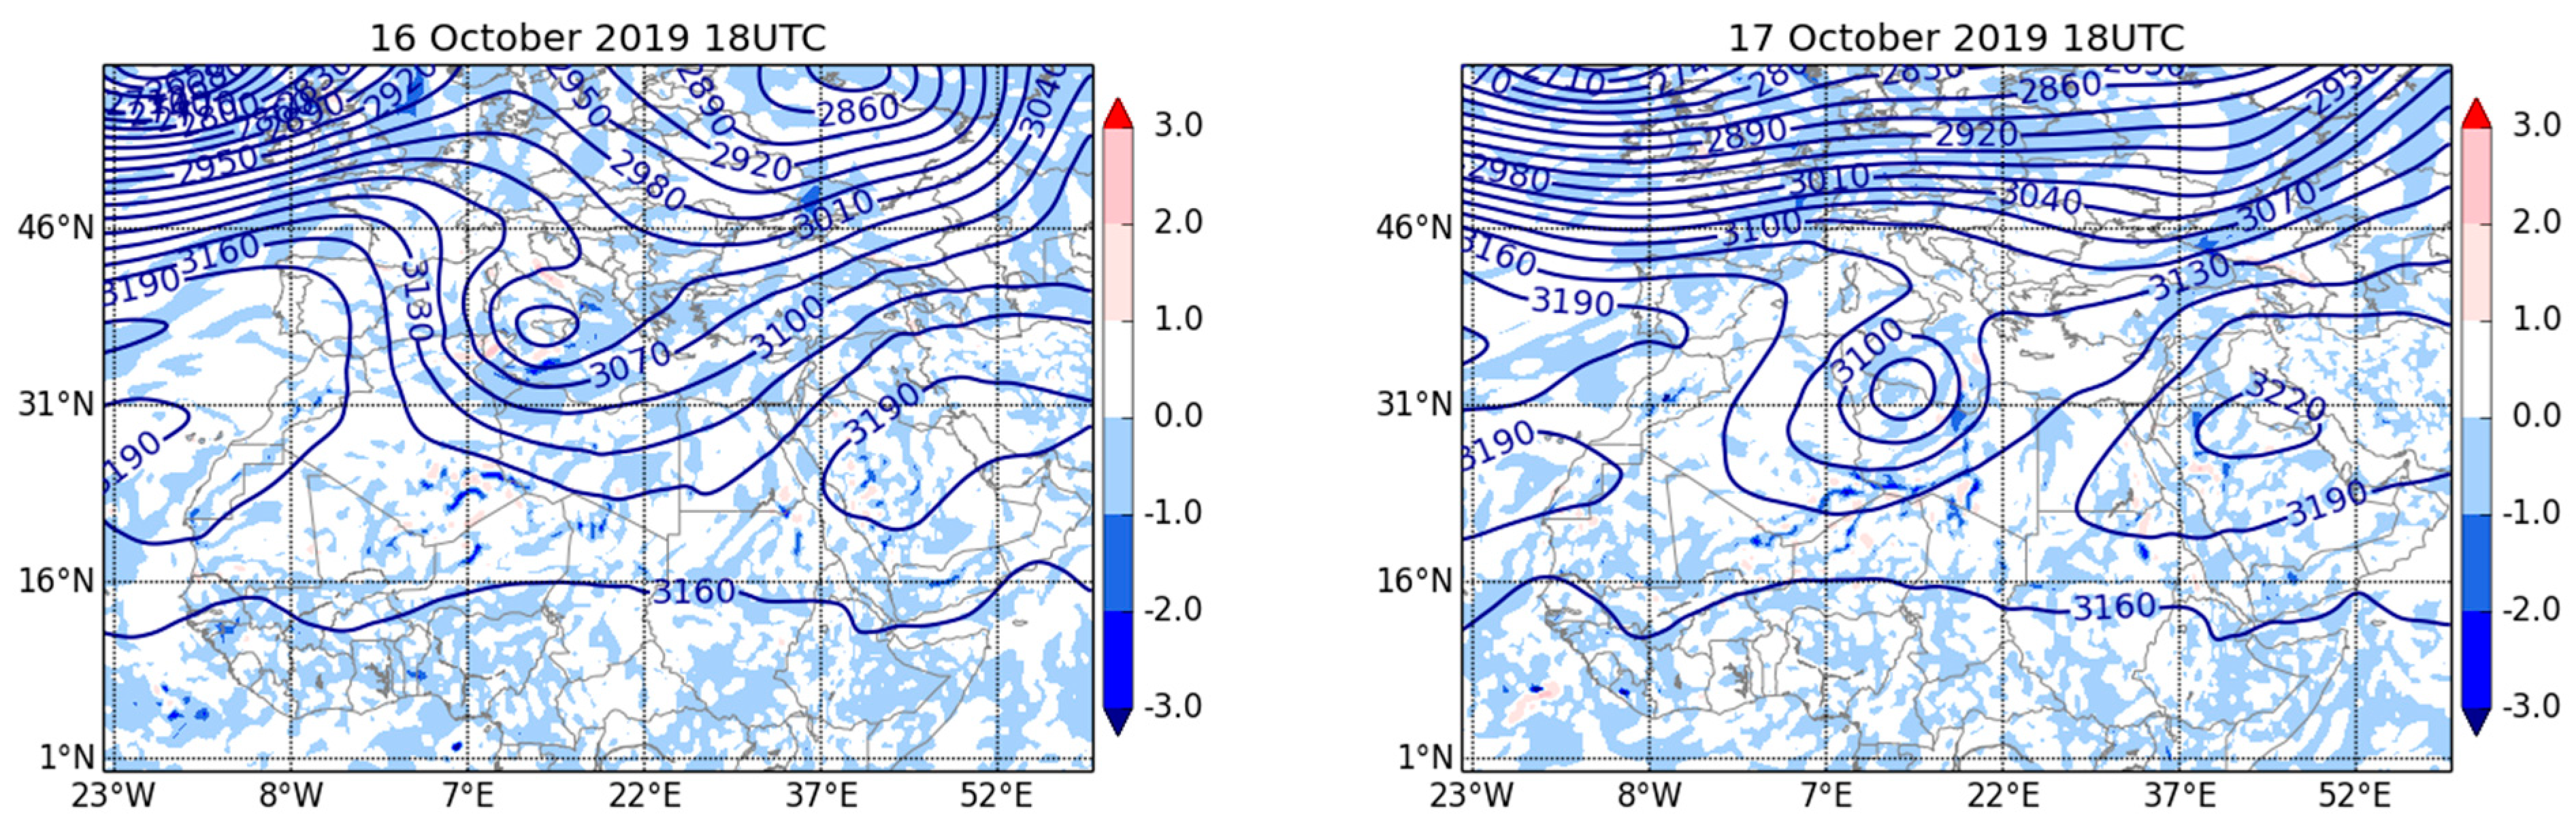
  • Although the Chouf district experienced rainfall on the previous day (Figure 1), which helped fight the fires, fires ignited again in many regions on 16 October, as seen in Figure 1, due to the unstable and warm conditions associated with the upper ridge’s breakdown; the upper trough moved towards the east with a positive tilt, resulting in low surface retrogression, activating the surface high and leading to cold air advection (Figure 5). As a result, the Chouf region experienced lower temperatures, with unstable conditions and gusty wind that triggered the ignition of further fires, as shown in Figure 4.
  • On 17 October, at 18 UTC, the trough (open wave) developed to a cut-off low over the south-western Mediterranean Sea, and the upper ridge over the eastern Mediterranean Sea built up to a notable extent, while the high surface pressure strengthened. Consequently, Lebanon again lay under a blocked atmospheric system, which continued the warming but also forced the sea breeze towards the land (forming a cold front) due to the temperature gradient between the land and sea surfaces, as shown in Figure 4 and Figure 5. This situation resulted in the formation of convective clouds and less precipitation, particularly in high-terrain regions such as Chouf; therefore, the fires continued in many regions, but the situation became less critical, as seen in Figure 1.
  • Consequently, the heat wave receded on 18 October, and fire ignitions stopped in the Chouf district, as shown in Figure 1 and Figure 5.

4. Conclusions

In this study, it was found that the wildfires across Lebanon in mid-October 2019 were due to an atmospheric situation characterized by the domination of an upper ridge and surface high-pressure system, leading to the formation of blocking; this resulted in a heat wave over the eastern Mediterranean region due to adiabatic warming with a sinking motion and warm air advection. Between 13 and 14 October, the eastern movement of the upper open wave towards the eastern Mediterranean caused the breakdown of the upper ridge in which Lebanon lay, within the transition zone between the upper trough and ridge systems. The advection of dry air aloft to a low level with a cold front passage on the surface produced low-level jets. The instability on the surface with the available moisture in the mid-levels due to the upper front lead to the formation of convective clouds that produced thunderstorms with no rain (because of the lack in moisture on the surface) over the Chouf district, causing lightning which is a major incentive of fire ignition especially in dry fuels-rich areas, and the lightning effects were exacerbated with low moisture, higher temperatures and high wind speeds. The fires lasted until 18 October due to the unstable and warm conditions associated to the breakdown of the upper ridge.

Institutional Review Board Statement

Not Applicable.

Informed Consent Statement

Not Applicable.

Data Availability Statement

The data presented in this study related to the detection of burned areas using VIIRS S-NPP 375 m is available on request via https://firms2.modaps.eosdis.nasa.gov/download/ accessed on 20 August 2020, and the ERA5 hourly data on pressure levels from 1979 to present and ERA5 hourly data on single levels from 1979 to present is available on request from the Climate Data Store accessed on 15 April 2020.

Acknowledgments

The authors thank the editors and reviewers of this manuscript, the use of data from NASA’s Fire Information for Resource Management System (FIRMS) (https://earthdata.nasa.gov/firms accessed on 20 August 2020), part of NASA’s Earth Observing System Data and Information System (EOSDIS)as well as the use of ERA5 datasets as stated in the Copernicus C3S/CAMS License agreement.

Conflicts of Interest

The authors declare no conflict of interest.

References

  1. Faour, G. Forest Fire Fighting in Lebanon Using Remote Sensing and Gis. 2004. Available online: https://www.researchgate.net/publication/310796768_FOREST_FIRE_FIGHTING_IN_LEBANON_USING_REMOTE_SENSING_AND_GIS (accessed on 25 September 2021).
  2. Flannigan, M.D.; Krawchuk, M.A.; De Groot, W.J.; Wotton, B.M.; Gowman, L.M. Implications of changing climate for global wildland fire. Int. J. Wildl. Fire 2009, 18, 483–507. [Google Scholar] [CrossRef]
  3. Werth, P.A.; Potter, B.E.; Clements, C.; Finney, M.A.; Goodrick, S.L.; Alexander, M.E.; Cruz, M.; Forthofer, J.A.; McAllister, S.S. Synthesis of knowledge of extreme fire behavior: Volume I for fire managers. Synth. Knowl. Extrem. Fire Behav. Vol. I Fire Manag. 2011, 854. [Google Scholar] [CrossRef]
  4. Dimitrakopoulos, A.; Papaioannou, K.K. Flammability Assessment of Mediterranean Forest Fuels. Fire Technol. 2001, 37, 143–152. [Google Scholar] [CrossRef]
  5. Chuvieco, E.; Aguado, I.; Dimitrakopoulos, A.P. Conversion of fuel moisture content values to ignition potential for integrated fire danger assessment. Can. J. For. Res. 2004, 34, 2284–2293. [Google Scholar] [CrossRef]
  6. Andela, N.; Van Der Werf, G.R. Recent trends in African fires driven by cropland expansion and El Niño to La Niña transition. Nat. Clim. Chang. 2014, 4, 791–795. [Google Scholar] [CrossRef]
  7. De Rigo, D.; Liberta, G.; Durrant, T.; Artes Vivancos, T.; San-Miguel-Ayanz, J. Forest Fire Danger Extremes in Europe under Climate Change: Variability and Uncertainty; EUR 28926 EN; Publications Office of the European Union: Luxembourg, 2017; ISBN 978-92-79-77046-3. JRC108974. [Google Scholar] [CrossRef]
  8. Moriondo, M.; Good, P.; Durão, R.; Bindi, M.; Giannakopoulos, C.; Corte-Real, J.A.M. Potential impact of climate change on fire risk in the Mediterranean area. Clim. Res. 2006, 31, 85–95. [Google Scholar] [CrossRef]
  9. Lucarini, V.; Gritsun, A. A new mathematical framework for atmospheric blocking events. Clim. Dyn. 2020, 54, 575–598. [Google Scholar] [CrossRef] [Green Version]
  10. Dong, L.; Mitra, C.; Greer, S.; Burt, E. The Dynamical Linkage of Atmospheric Blocking to Drought, Heatwave and Urban Heat Island in Southeastern US: A Multi-Scale Case Study. Atmosphere 2018, 9, 33. [Google Scholar] [CrossRef] [Green Version]
  11. Masoompour Samakosh, J.; Soltani, M.; Hanafi, A.; Azizi, G.H.; Mirzaei, E.; Ranjbar Saadat Abadi, A.; Yousefi, Y. The omega blocking condition and extreme rainfall in Northwestern Iran during 25–28 October 2008. J. Earth Space Phys. 2014, 40, 55–74. [Google Scholar] [CrossRef]
  12. Woollings, T.; Barriopedro, D.; Methven, J.; Son, S.-W.; Martius, O.; Harvey, B.; Sillmann, J.; Lupo, A.R.; Seneviratne, S. Blocking and its Response to Climate Change. Curr. Clim. Chang. Rep. 2018, 4, 287–300. [Google Scholar] [CrossRef] [Green Version]
  13. Efe, B.; Sezen, I.; Lupo, A.R.; Deniz, A. The relationship between atmospheric blocking and temperature anomalies in Turkey between 1977 and 2016. Int. J. Clim. 2020, 40, 1022–1037. [Google Scholar] [CrossRef]
  14. Rodrigues, M.; Gonzalez-Hidalgo, J.C.; Peña-Angulo, D.; Jiménez-Ruano, A. Identifying wildfire-prone atmospheric circulation weather types on mainland Spain. Agric. For. Meteorol. 2019, 264, 92–103. [Google Scholar] [CrossRef]
  15. Papagiannaki, K.; Giannaros, T.; Lykoudis, S.; Kotroni, V.; Lagouvardos, K. Weather-related thresholds for wildfire danger in a Mediterranean region: The case of Greece. Agric. For. Meteorol. 2020, 291, 108076. [Google Scholar] [CrossRef]
  16. Illera, P.; Fernández, A.; Delgado, J.A. Temporal evolution of the NDVI as an indicator of forest fire danger. Int. J. Remote. Sens. 1996, 17, 1093–1105. [Google Scholar] [CrossRef]
  17. Bugalho, M.D.L.; Camara, N.; Kogan, F. Study of Wildfire Environmental Conditions in Portugal with NOAA/NESDIS Satellite-Based Vegetation Health Index. J. Agric. Sci. Technol. B 2019, 9. [Google Scholar] [CrossRef]
  18. Zahran, E.S.M.M.; Shams, S.; Said, S.N.M.B.M.; Zahran, E.S.M.M.; Gadong, B.; Brunei-Muara, B.D. Validation of forest fire hotspot analysis in GIS using forest fire contributory factors. Syst. Rev. Pharm. 2020, 11, 249–255. [Google Scholar] [CrossRef]
  19. Mangiameli, M.; Mussumeci, G.; Cappello, A. Forest Fire Spreading Using Free and Open-Source GIS Technologies. Geomatics 2021, 1, 50–64. [Google Scholar] [CrossRef]
  20. Karouni, A.; Daya, B.; Bahlak, S. Forest fire prediction: A comparative study of applicability of fire weather indices for Lebanon. Glob. J. Technol. 2014, 5, 8–17. [Google Scholar]
  21. Mitri, G.; Nasrallah, G.; Gebrael, K.; Beshara, J.; Nehme, M. Assessment of post-fire land degradation risk in Lebanon’s 2019 fire affected areas using remote sensing and GIS. In Proceedings of the SPIE 11524, Eighth International Conference on Remote Sensing and Geoinformation of the Environment (RSCy2020), 115240T, Paphos, Cyprus, 26 August 2020. [Google Scholar] [CrossRef]
  22. Mitri, G.; Saba, S.; Nader, M.; McWethy, D. Developing Lebanon’s fire danger forecast. Int. J. Disaster Risk Reduct. 2017, 24, 332–339. [Google Scholar] [CrossRef]
  23. Hani, N. Sustainable Territorial Management and Action Plan Shouf Biosphere Reserve—Development Zone with Focus on Abandoned Terraces Lebanon. 2015. [Google Scholar]
  24. Jarvis, A.; Reuter, H.I.; Nelson, A.; Guevara, E. Hole-Filled Seamless SRTM Data V4, International Centre for Tropical Agriculture (CIAT). 2008. Available online: https://srtm.csi.cgiar.org (accessed on 25 September 2021).
  25. Hersbach, H.; Bell, B.; Berrisford, P.; Biavati, G.; Horányi, A.; Muñoz Sabater, J.; Nicolas, J.; Peubey, C.; Radu, R.; Rozum, I.; et al. ERA5 hourly data on pressure levels from 1979 to present. Reanal. Datasets 2019. [Google Scholar] [CrossRef]
  26. Hersbach, H.; Bell, B.; Berrisford, P.; Biavati, G.; Horányi, A.; Muñoz Sabater, J.; Nicolas, J.; Peubey, C.; Radu, R.; Rozum, I.; et al. ERA5 hourly data on single levels from 1979 to present. Copernic. Clim. Chang. Serv. (C3S) Clim. Data Store (CDS) 2018. [Google Scholar] [CrossRef]
  27. Schroeder, W.; Oliva, P.; Giglio, L.; Csiszar, I.A. The New VIIRS 375 m active fire detection data product: Algorithm description and initial assessment. Remote Sens. Environ. 2014, 143, 85–96. [Google Scholar] [CrossRef]
Figure 1. The burned areas of 2019 including the catastrophic fires of October 2019 [21].
Environsciproc 08 00037 g001
Figure 2. Major topographic features of Lebanon based on elevation data obtained from the Shuttle Radar Topography Mission (SRTM) database (https://srtm.csi.cgiar.org/srtmdata/, accessed on 25 September 2021) at 30 m spatial resolution [24].
Environsciproc 08 00037 g002
Figure 3. Burned areas in Lebanon on: (a) 13–14 October 2019; (b) 14–15 October 2019; (c) 15–16 October 2019 and (d) 16–17 October 2019.
Environsciproc 08 00037 g003
Figure 4. Time series of some atmospheric parameters over the Chouf district (33.7° N, 35.6° E) during 10–18 October 2019, including: (A) dew point temperature (orange-contour lines) and temperature; (B) total precipitation, convective precipitation and total totals index; (C) pressure, gust wind and wind speed and (D) total cloud cover.
Environsciproc 08 00037 g004
Figure 5. Geopotential height at 500 hPa (contour lines), and the MSLP (shaded) during 10–17 October 2019.
Environsciproc 08 00037 g005aEnvironsciproc 08 00037 g005b
Figure 6. Total cloud (shaded) and surface wind during 10–17 October 2019.
Environsciproc 08 00037 g006aEnvironsciproc 08 00037 g006b
Figure 7. Vertical velocity (shaded) and geopotential height at 700 hPa (contour lines) during 10–17 October 2019.
Environsciproc 08 00037 g007aEnvironsciproc 08 00037 g007b
Figure 8. Wind speed at 500 hPa (red-contour line); geopotential height (orange contour line) and relative vorticity at 500 hPa (shaded).
Environsciproc 08 00037 g008aEnvironsciproc 08 00037 g008b
Figure 9. Vertical cross section of relative humidity during 13–17 October 2019.
Environsciproc 08 00037 g009
Publisher’s Note: MDPI stays neutral with regard to jurisdictional claims in published maps and institutional affiliations.

