Proceeding Paper

Precipitation Forecast Verification of the FFGS and SisPI Tools during the Impact of the Tropical Storm Isaias over the Dominican Republic †

1
Atmospheric Physics Center, Institute of Meteorology, Havana 11700, Cuba
2
Meteorological National Office, Santo Domingo 11603, Dominican Republic
*
Authors to whom correspondence should be addressed.
Presented at the 4th International Electronic Conference on Atmospheric Sciences, 16–31 July 2021; Available online: https://ecas2021.sciforum.net.
Environ. Sci. Proc. 2021, 8(1), 35; https://doi.org/10.3390/ecas2021-10693
Published: 22 July 2021
(This article belongs to the Proceedings of The 4th International Electronic Conference on Atmospheric Sciences)

Abstract

:
During 2020, the Dominican Republic received the impact of several tropical organisms, among those that generated the greatest losses in the country, Tropical Storm Isaias stands out because of the significant precipitation and flooding it caused. The study analyzes the ability of the products of Flash Flood Guidance System (FFGS) and the Nowcasting and Very Short Range Prediction System (Spanish acronym SisPI) for the quantitative precipitation forecast (QPF) of the rains generated by Isaias on 30 and 31 July 2020 over the Dominican Republic. Various traditional verification methods are used in the study. The results show that both numerical weather-based systems are powerful tools for the QPF, and also to contribute to the prevention and mitigation of disasters caused by the extreme hydro-meteorological event analyzed.

1. Introduction

As the Dominican Republic is in the path of tropical cyclones, it is frequently affected by these hydrometeors. To monitor and forecast hydrometeorological events, the country has various systems based on numerical weather models, for example the Haiti−Dominican Republic Flash Flood Guidance System (HDRFFGS, referred to as FFGS; https://public.wmo.int/en/projects/ffgs (accessed on 23 June 2021)) and the Nowcasting and Very Short Term Forecast System (known by its Spanish acronym SisPI). Results described in other studies have shown that weather forecasting systems from FFGS and SisPI have good ability to forecast precipitation and different meteorological variables, however in particular for the Dominican Republic there has not been an exhaustive evaluation of them.
The work presented here aims to verify the quantitative forecast of precipitation generated by FFGS and SisPI during the passage of Tropical Storm Isaías through the Dominican Republic. The evaluation is carried out on the HIRESW ARW (forecast) and HIRESW NMMB (forecast) products of the FFGS (https://www.nco.ncep.noaa.gov/pmb/products/hiresw/ (accessed on 23 June 2021)); and on the 3 km resolution domain of the SisPI. The precipitation measured at the surface stations and the precipitation estimate from the Global Precipitation Mission (GPM) [1] are used in the verification. A verification based on traditional and categorical methods is applied [2]. The document is structured as follows: the Materials and Methods section describes the FFGS, the SisPI and their respective precipitation forecast products used, followed by a brief description of Tropical Storm Isaias as well as the data and verification methods used. The Results and Discussion section presents the results and our analysis according to the evaluation carried out; and finally a Conclusions section is presented.

2. Materials and Methods

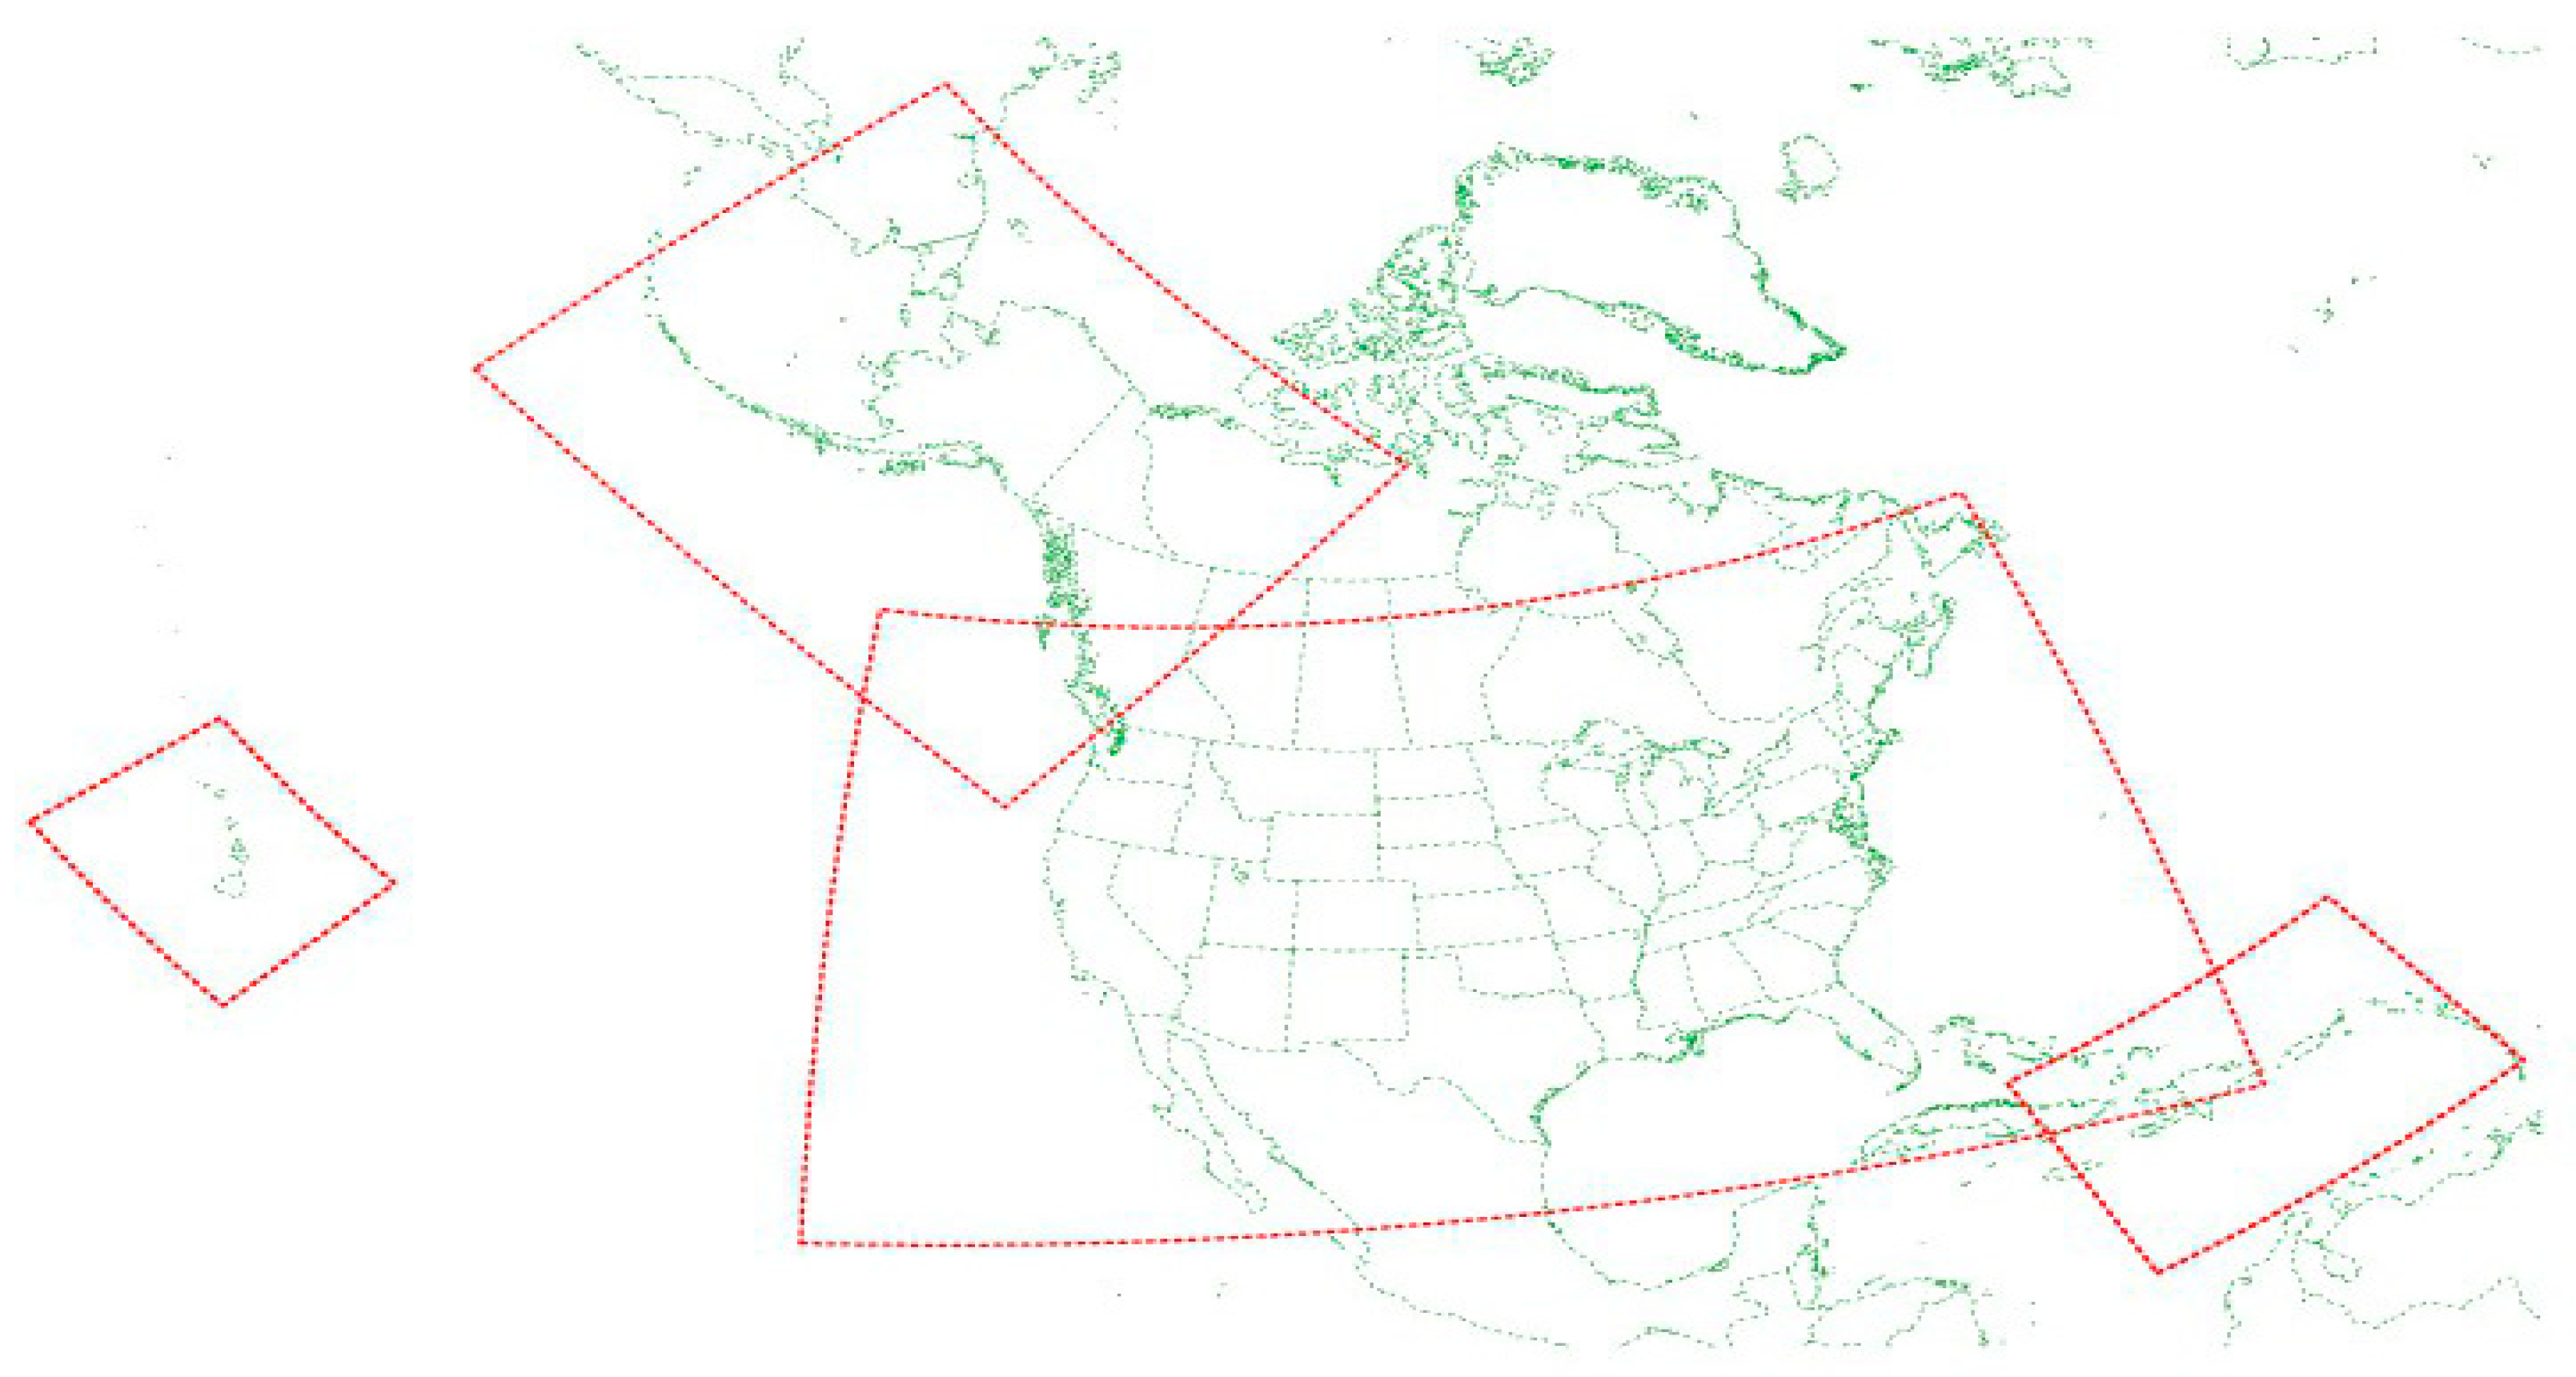
2.1. Flash Flood Guidance System

The FFGS product was developed by the Hydrologic Research Center (HRC) in San Dieg (CA, USA). The primary objective of the FFGS is to provide forecasters and disaster management agencies with real-time informational guidance products related to the threat of small-scale flash floods in a specific country or region. The FFGS provides products to support the development of flash flood warnings associated with rainfall events through the use of remotely sensing such as, radar and satellite-based rainfall estimates, numerical weather predictions and hydrological approaches.
The FFGS implemented in the Dominican Republic integrates products from the numerical forecast model WRF, specifically from two dynamic cores (NonHydrostatic Mesoescale Model − NMM and Advanced Research WRF − ARW). Recently products from the AROME model were also incorporated (https://donneespubliques.meteofrance.fr/?fond=produit&id_produit=241&id_rubrique=51 (accessed on 23 June 2021)). This study evaluates the WRF products of the high-resolution window for Puerto Rico, which is elaborated by the National Center for Environmental Prediction (NCEP) High-Resolution Window (HIRESW) Forecast System (http://www.nco.ncep.noaa.gov/pmb/products/hiresw/ (accessed on 23 June 2021)). Both WRF cores have 5 km of spatial resolution, while the microphysics is WRF single-moment microphysics class 6 (WSM6) for ARW and Ferrier-Aligo for NMM. These outputs are available with the 0600 and 1800 UTC initializations. Figure 1 shows the simulation domains that include the Dominican Republic.

2.2. Nowcasting and Very Short Term Forecast System
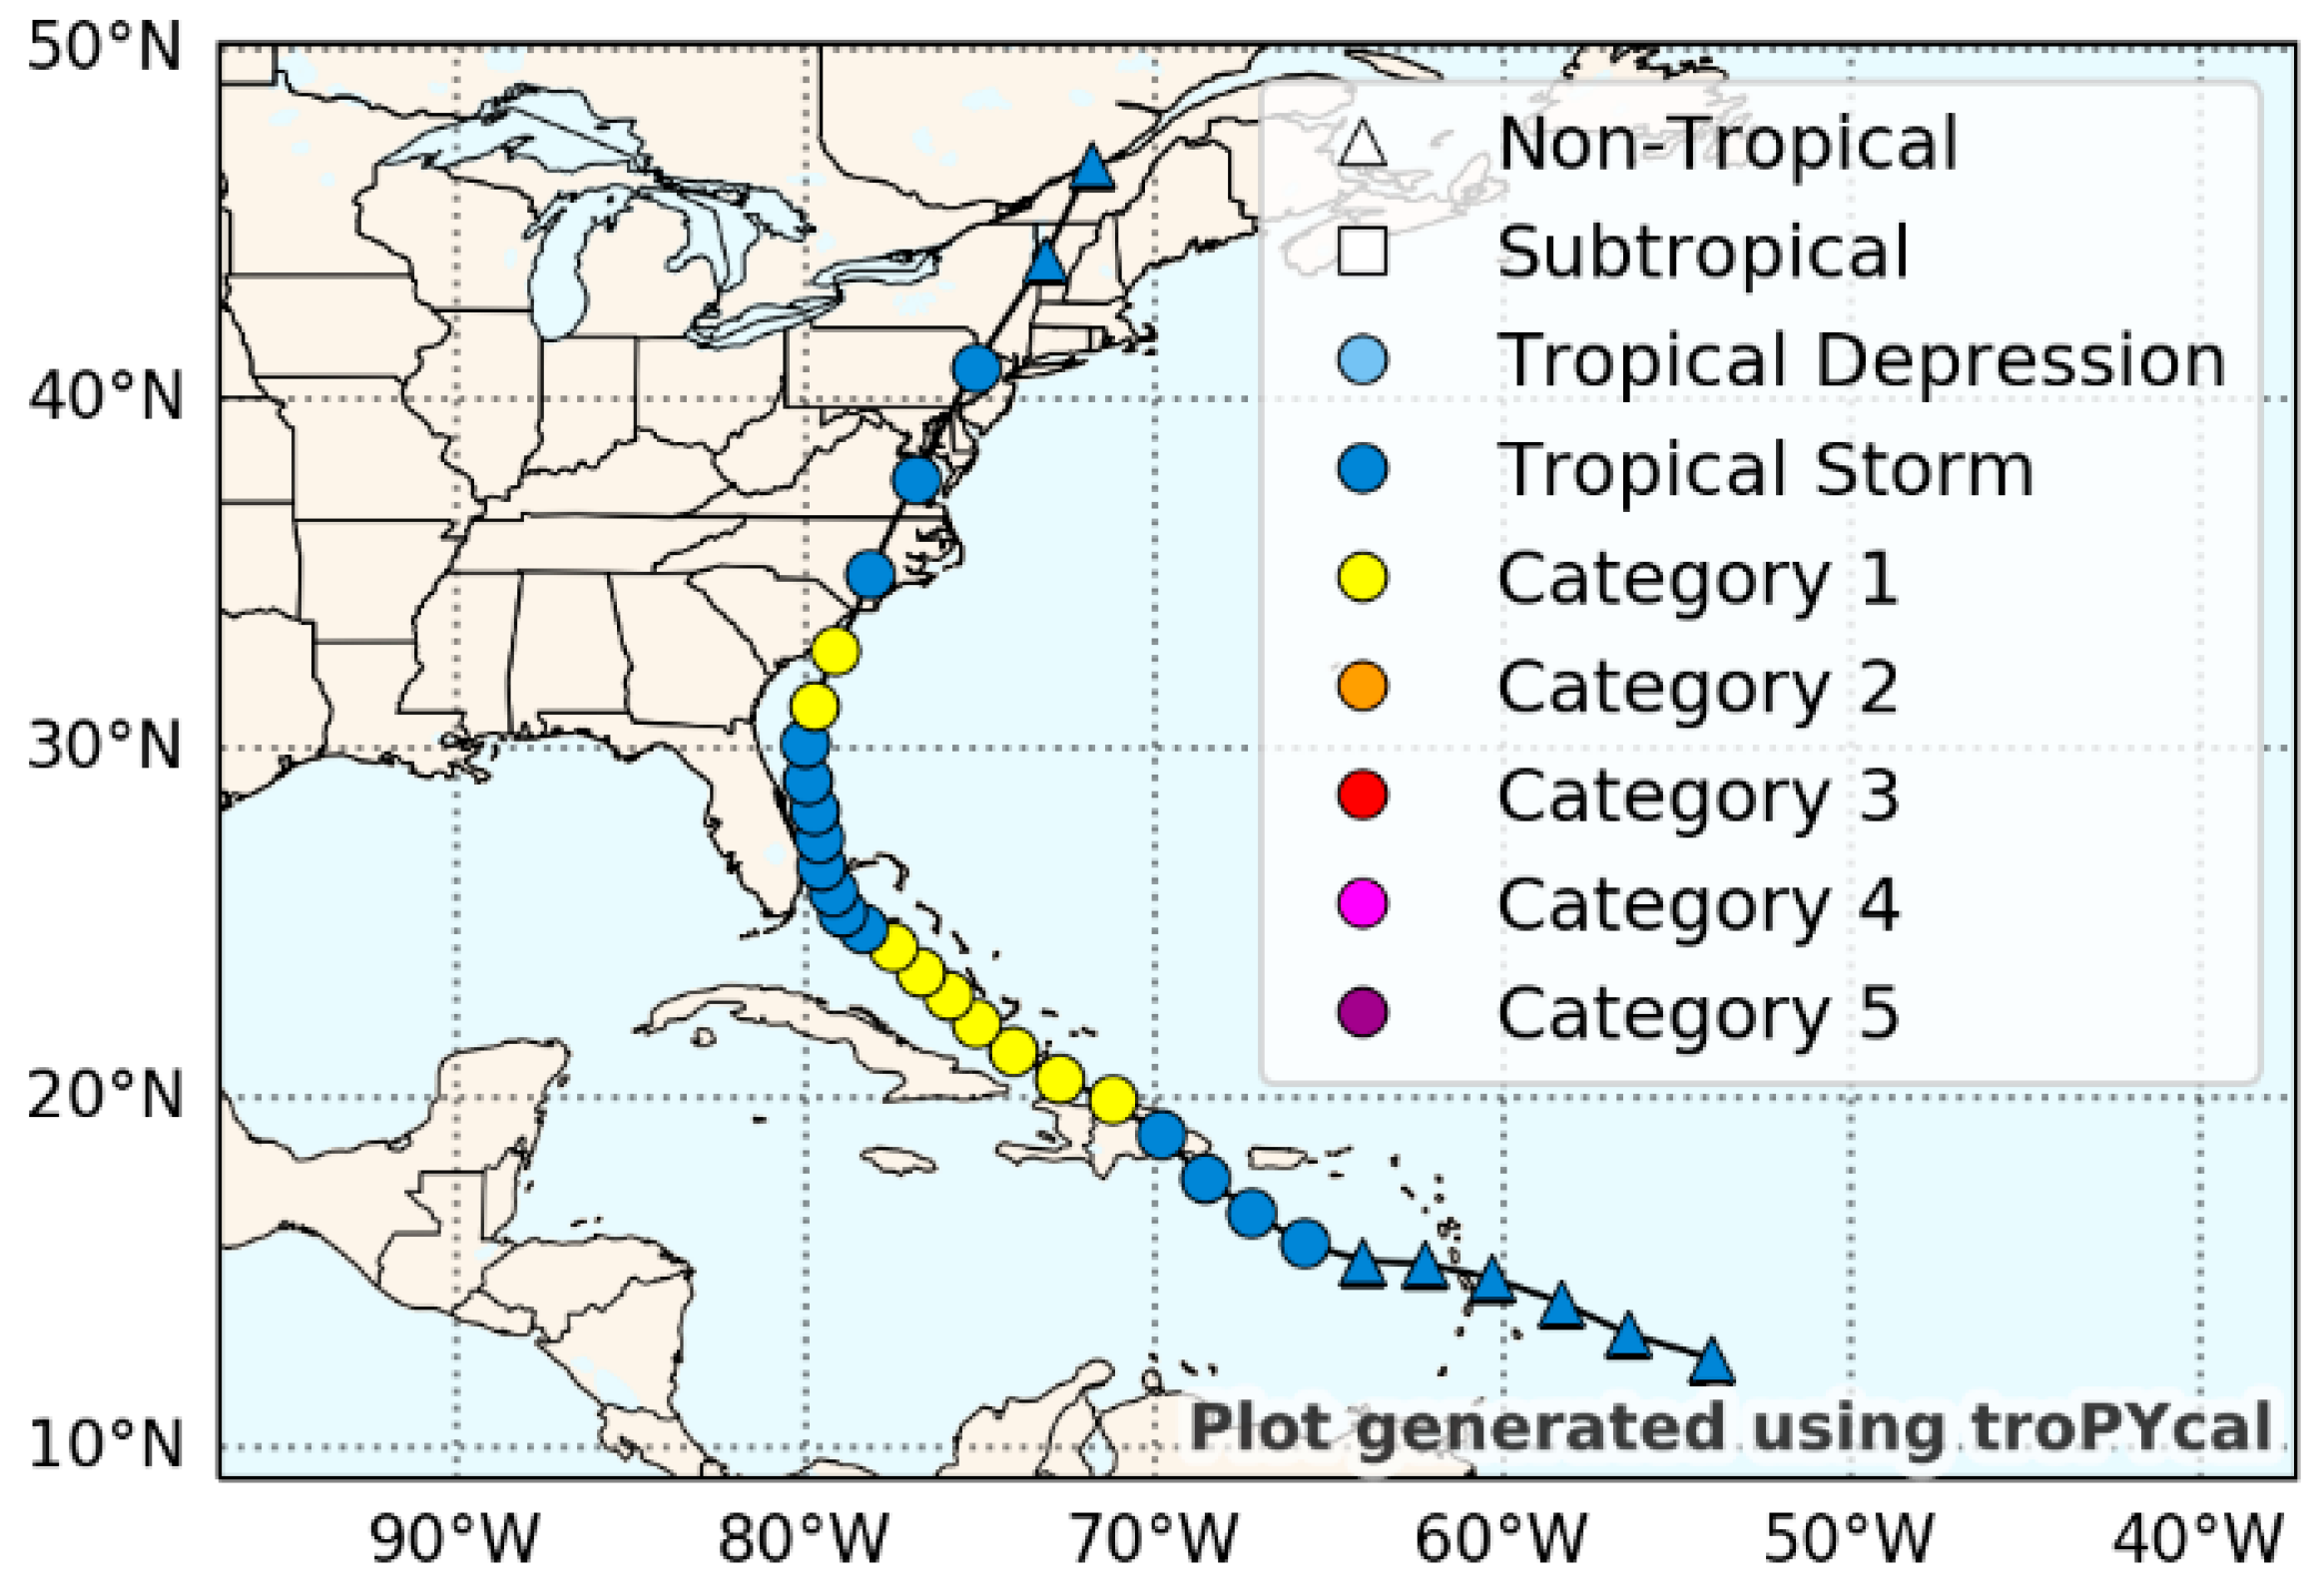
SisPI is a numerical forecasting system that uses the WRF with the ARW core. It was developed by the Center for Atmospheric Physics of the Cuban Meteorological Institute (INSMET, in Spanish) [3,4] and implemented in the National Meteorological Office (ONAMET) of the Dominican Republic in 2019. The objective of SisPI is to provide numerical precipitation to support meteorological warning and act as a source for hydrological forecasting systems. In this case, the WRF is run for three nested domains of 27, 9 and 3 km of spatial resolution with the following configurations in microphysics: WSM5, WSM5, double moment Morrison; cumulus: Grell-Freitas, Grell-Freitas, not activated and Planetary Boundary Layer (PBL): Mellor-Yamada-Janjic, Mellor-Yamada-Janjic and Mellor-Yamada-Janjic, respectively. The SisPI runs four times using the GFS outputs at 0000, 0600, 1200 and 1800 UTC as initial and boundary conditions. Figure 2 shows the simulation domains for the Dominican Republic. The operational outputs can be consulted at http://186.149.199.244/sispi.php (accessed on 3 July 2021).

2.3. Isaias

Isaías was the ninth named tropical storm and the second hurricane of the 2020 cyclone season. This tropical cyclone was formed from a tropical wave that left the coasts of Africa on 23 July 2020. Several days before reaching a closed circulation and being named as a tropical cyclone by the National Hurricane Center (NHC), Isaías had already registered tropical storm force winds. Isaias impacted the Dominican Republic with its center entering through the San Pedro de Macorís province around noon on Thursday, 30 July with maximum sustained winds of up to 95 km/h, and then moving northwest over the Dominican territory during the afternoon and night until it exited the national territory around midnight on Thursday. During its transit over the Dominican Republic, this tropical storm caused heavy rains accompanied by electrical storms and winds with tropical storm force (https://www.nhc.noaa.gov/data/tcr/AL092020_Isaias.pdf (accessed on 4 July 2021)). The track followed by Isaias is shown in Figure 3.
Although its center traveled through Dominican territory for about 12 h, from noon on Thursday 30 to midnight the same day, the meteorological effects began to be felt indirectly a day before and continued to affect the country a day after its passage, due to the huge cloud field that accompanied this storm. The accumulated total of precipitation throughout this period of impact (both direct and indirect) translated into a maximum of 327.6 mm of rainfall recorded at the Sabana de la Mar meteorological station, followed by Samana where an accumulated 300.4 mm was recorded, during 29–31 July being, therefore, the east and northeast of the country were the areas that suffered the greatest rainfall impact due to the passage of this tropical storm (http://onamet.gob.do/index.php/pronosticos/temporada-ciclonica?download=4088:temporada-ciclonica-2020 (accessed on 7 July 2021)).

2.4. Data Used and Verification Methods

The verification process was carried out using 24-h precipitation records from 57 surface meteorological stations. These data were used to evaluate the satellite precipitation estimate generated by the GPM product in order to be able to use it as verification reference for the QPFs. In particular the Integrated Multi-satellite Retrievals for GPM (Integrated Multi-satellite Retrievals − IMERG) Final Precipitation L3 product (version 06) was used with temporal resolution of 30 min and spatial resolution of 0.1 degree × 0.1 degree [1].
Regarding verification methods, the following were used: (i) the traditional method based on point-to-point computing of different statistical metrics and (ii) the categorical verification method based on grid-to-grid computing of the hits, misses, correct rejection and false alarms parameters (see [2] for more details, and also [6] for an example of usage). The first method was applied with the station meteorological surface and the GPM data, while the second one was used with the FFGS products and SisPI, taking as precipitation reference the estimated by the GMP product. The bias, RMSE, critical success index (CSI), probability of detection (POD), and false alarms index (FAR) metrics were computed. The verification was applied to the FFGS forecast products and SisPI for 30 July 2020, using in both cases the outputs initialized at 0600 and 1800 UTC.

3. Results Discussion

An analysis of the results is presented below. As a first step, a comparison between the precipitation measurements of surface meteorological stations and the precipitation estimation of the GPM product is performed. The purpose of this is to know the correspondence between the real precipitation measured by the stations and the estimation of the same variable from the GPM. In this way, we would have an idea of how well the precipitation is represented via satellite over the Dominican Republic for this case study, which is very important since the estimation of precipitation by satellite is used for the spatial verification of the quantitative forecasts of precipitation employed by FFGS and produced by SisPI. This first part is followed by the presentation of the results of the evaluation by categories.

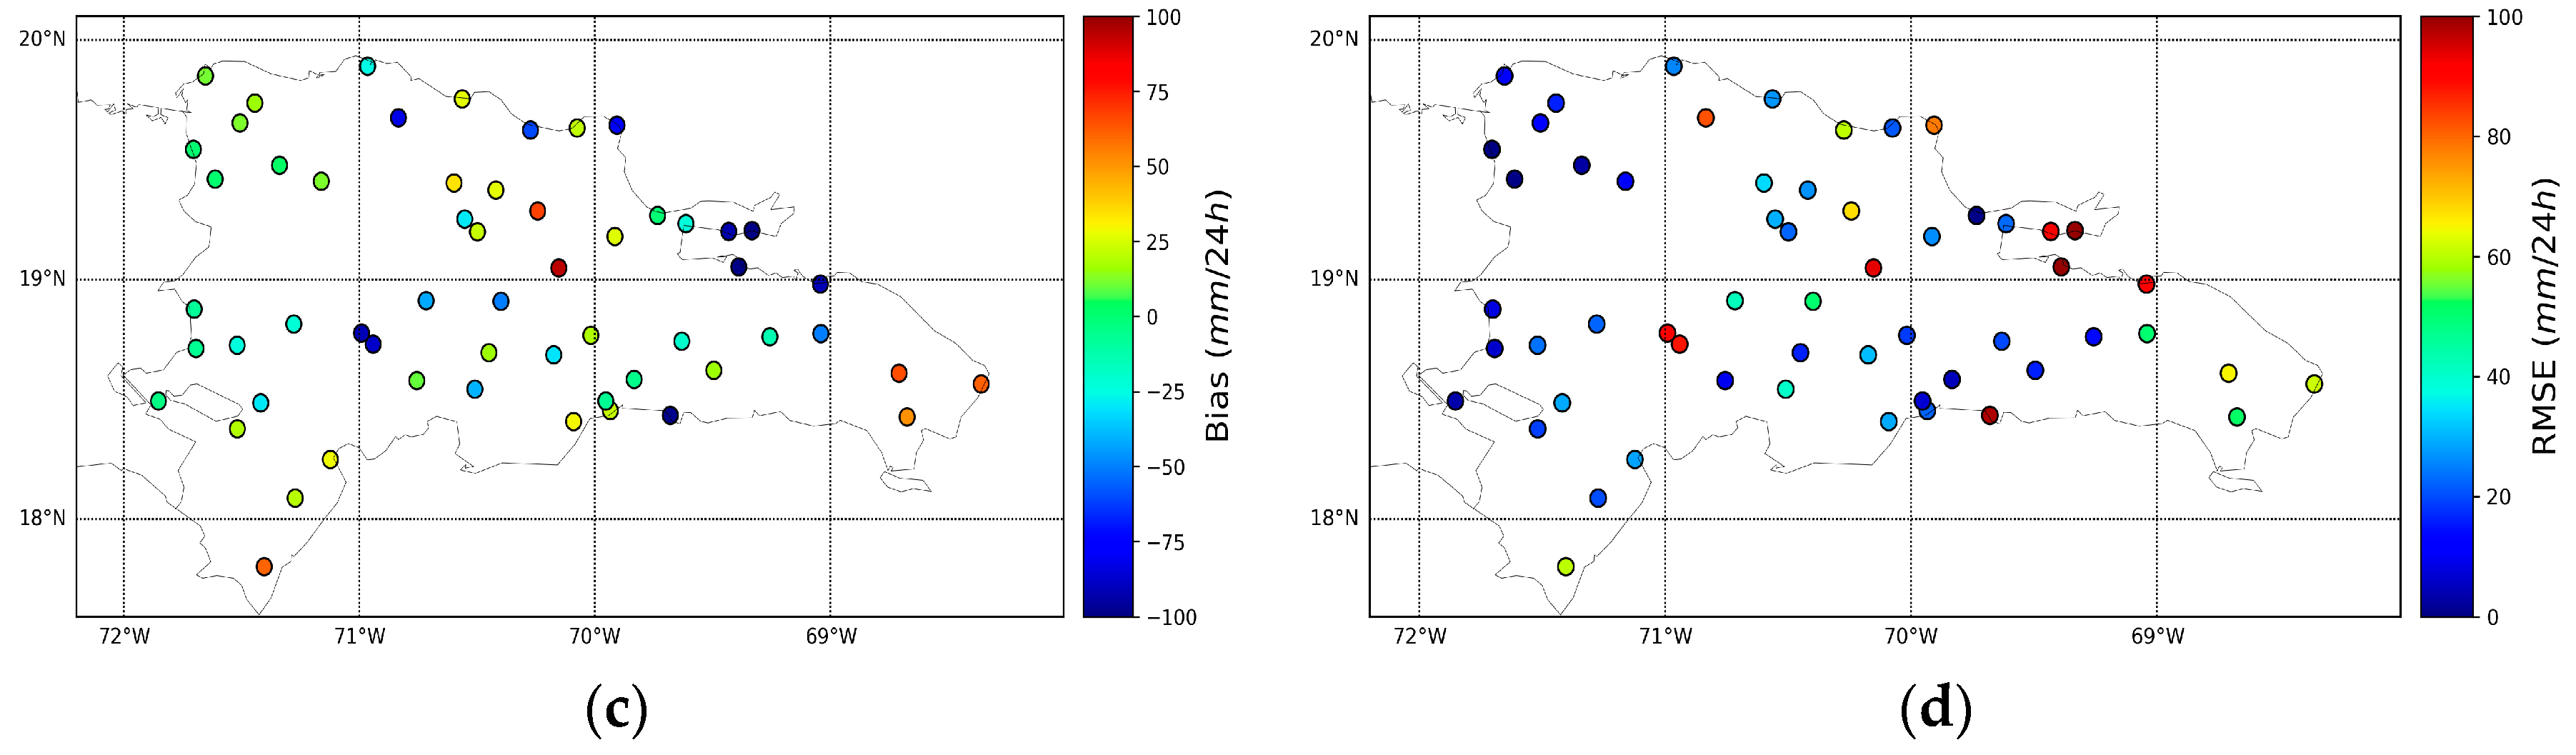
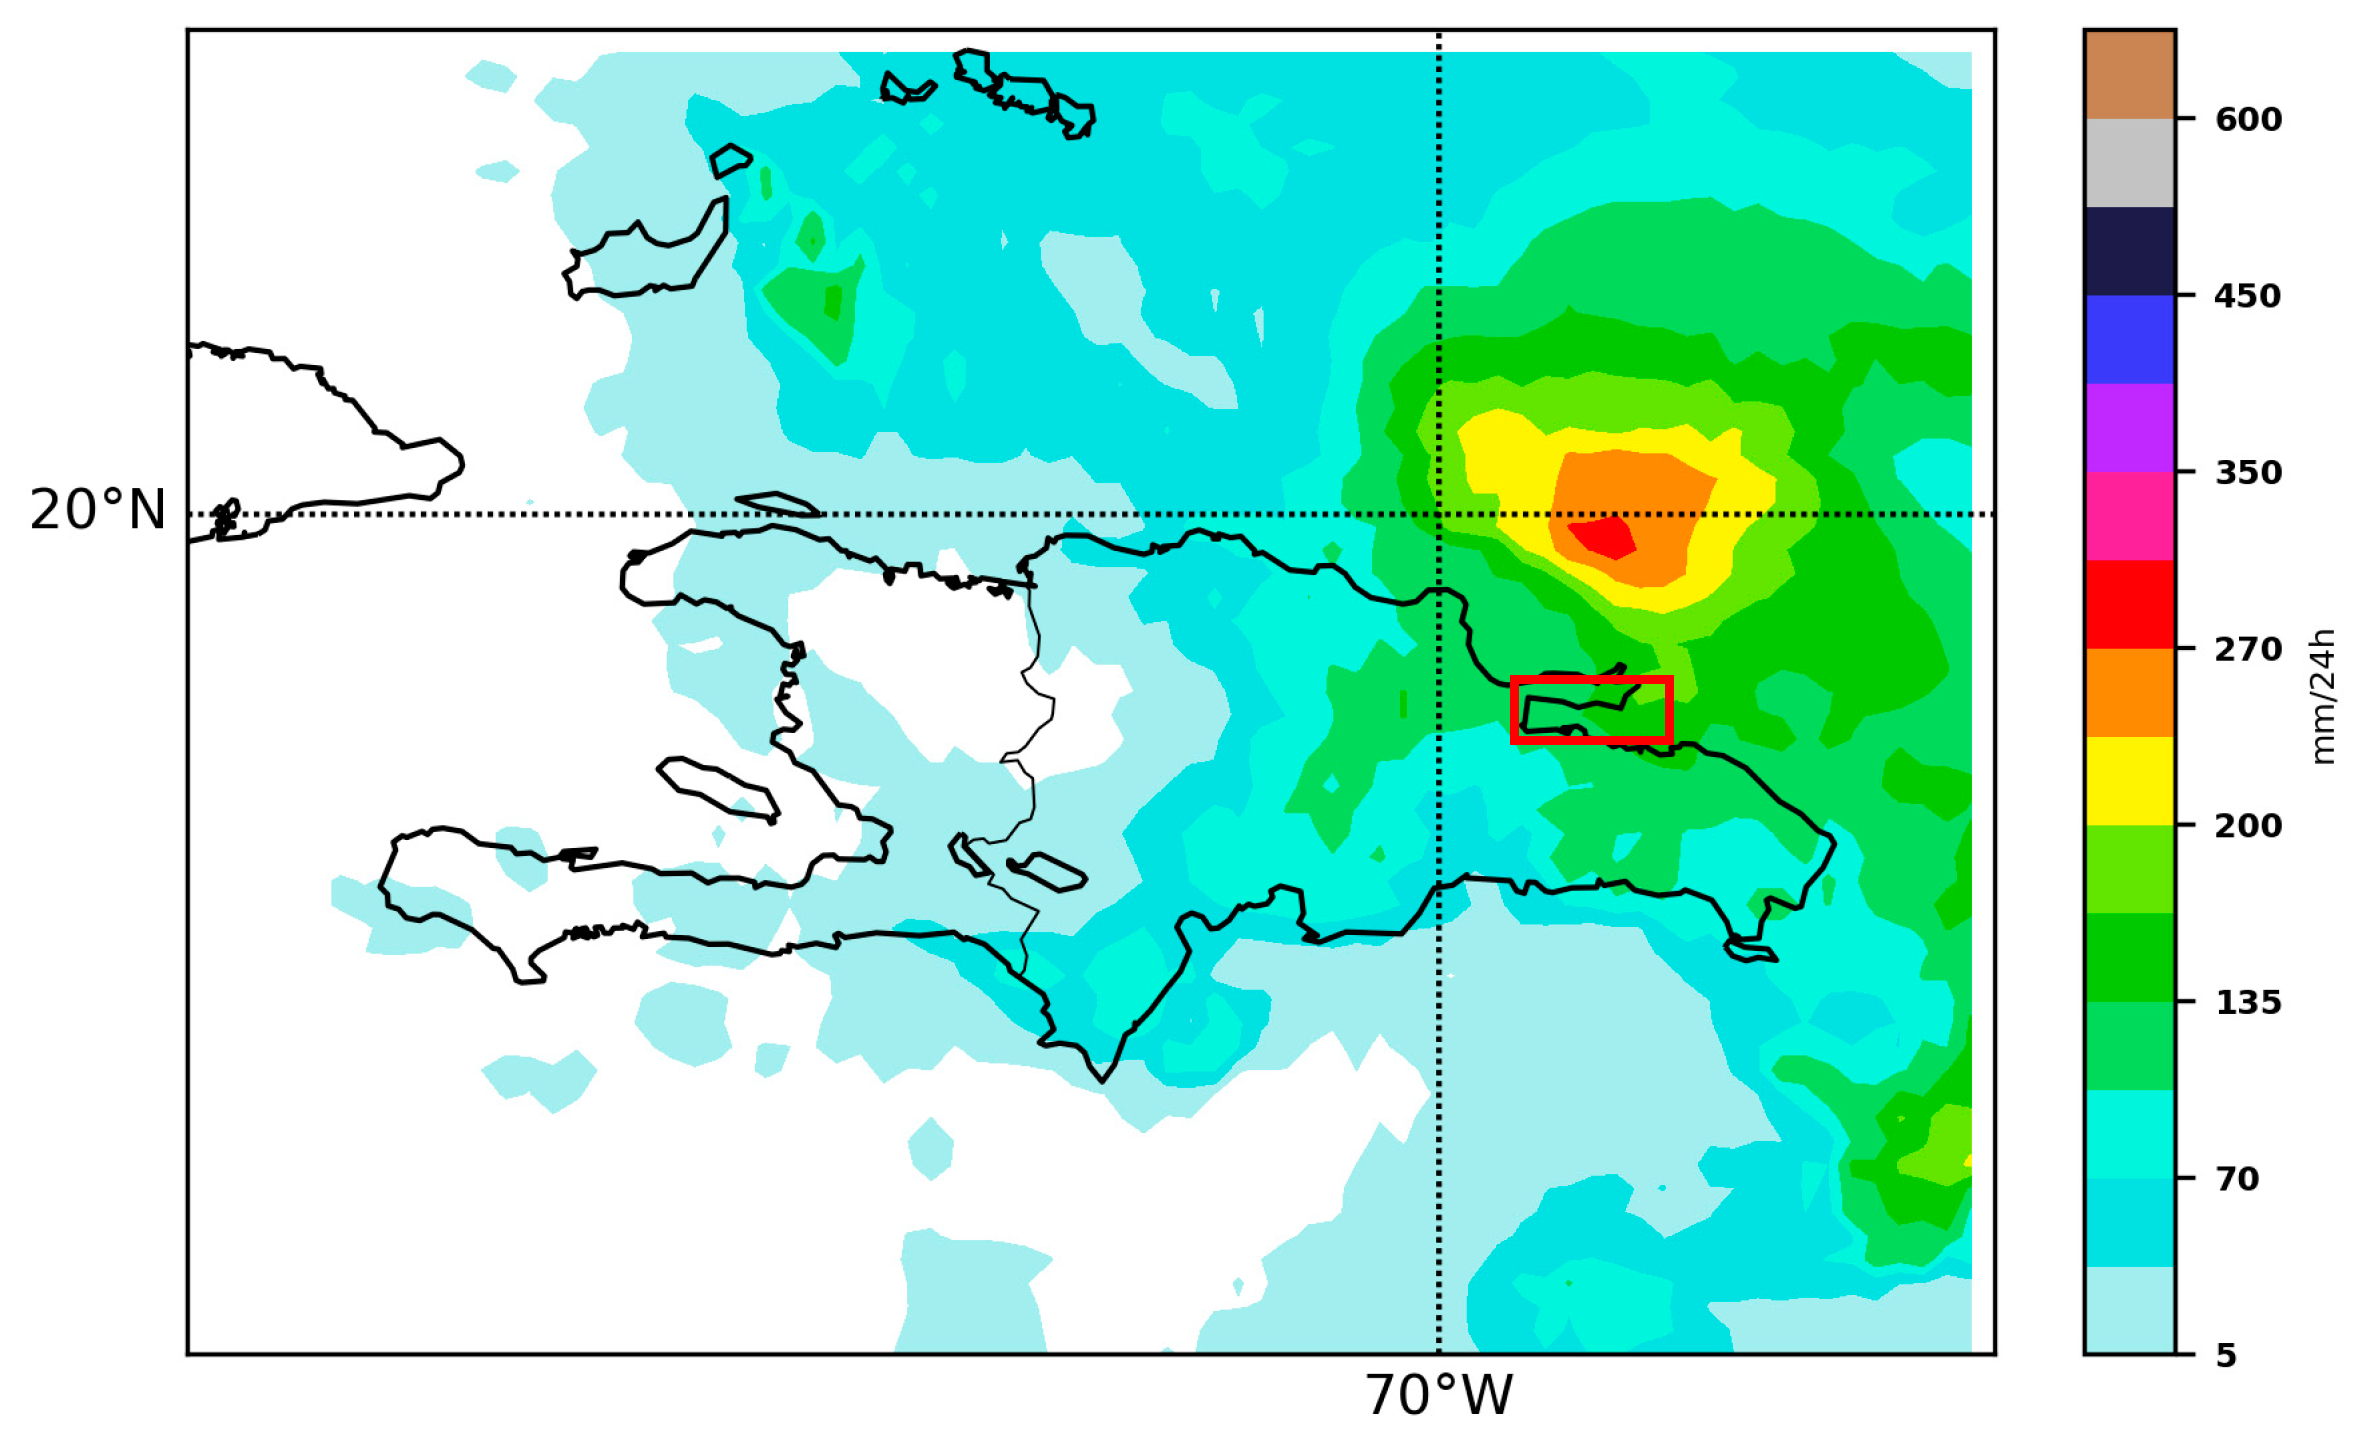
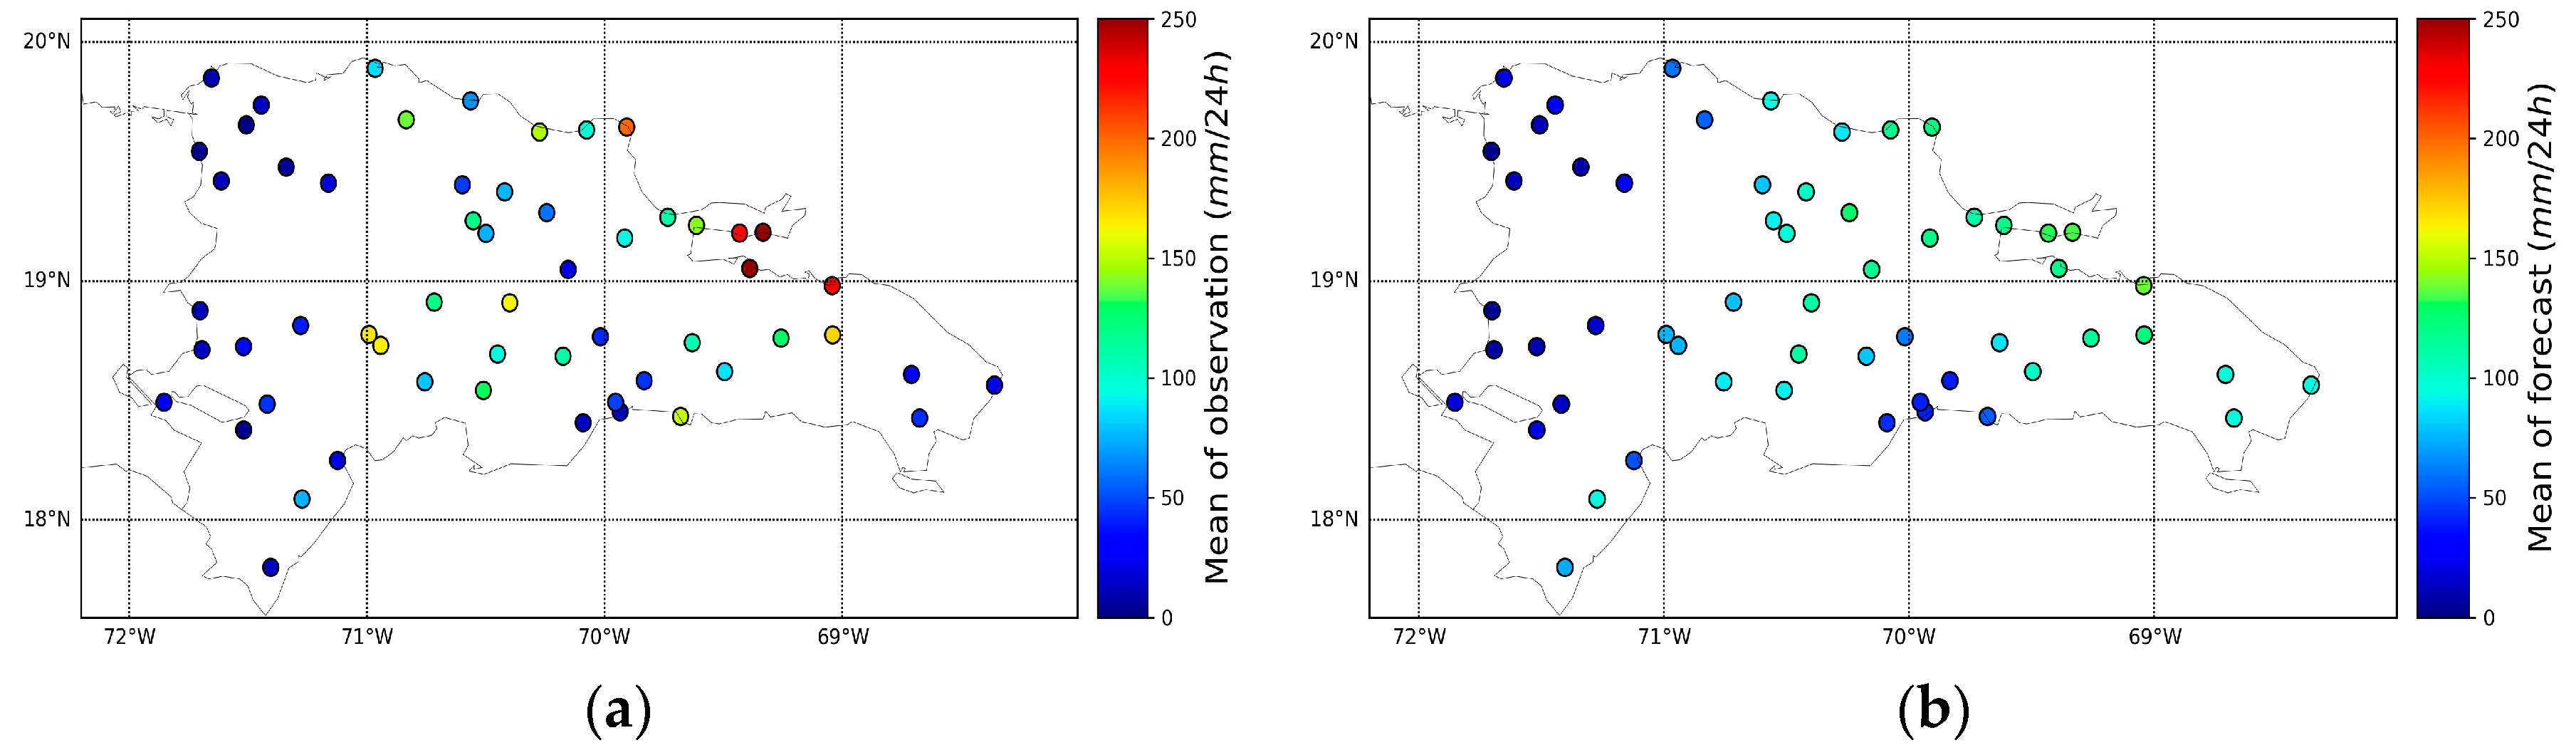
3.1. Comparison between GPM and Surface Stations

Figure 4 shows the 24 h accumulated rainfall estimated by the GPM product. The region where values of precipitation higher than 250 mm/24 h were reported is highlighted with a red square (includes Sabana del Mar 279.4 mm/24 h, Samana 276.1 mm/24 h). The precipitation estimated by GPM in the same region takes values between 100 and 200 mm/24 h showing a clear underestimation. A more detailed analysis can be done by observing Figure 5, where the real values (a) and the estimated values are presented on the coordinates of the stations (b). Indeed, it is observed that an underestimation predominates over the entire Dominican territory. Figure 5c,d present the bias and RMSE values. Notice that for Sabana del Mar and Samana a bias of −100 mm is obtained.
From another point of view, in Figure 5a,b it can be observed that although the quantitative errors of the estimation are high, principally in those places where heavy rain occured, in terms of where precipitation was reported or not, we can say that a correspondence exists between the GPM products and the data of the meteorological surface stations. Notice that GPM estimated the higher values in the same places that the highest preciptations were reported and a similar behavior occurs for the lower precipitation values.
Taking into account the above, it can be concluded that it is feasible to use the estimation of the precipitation of the GPM product to carry out a spatial verification in order to have a better coverage of the country, especially in those areas where there are no on-ground observations.

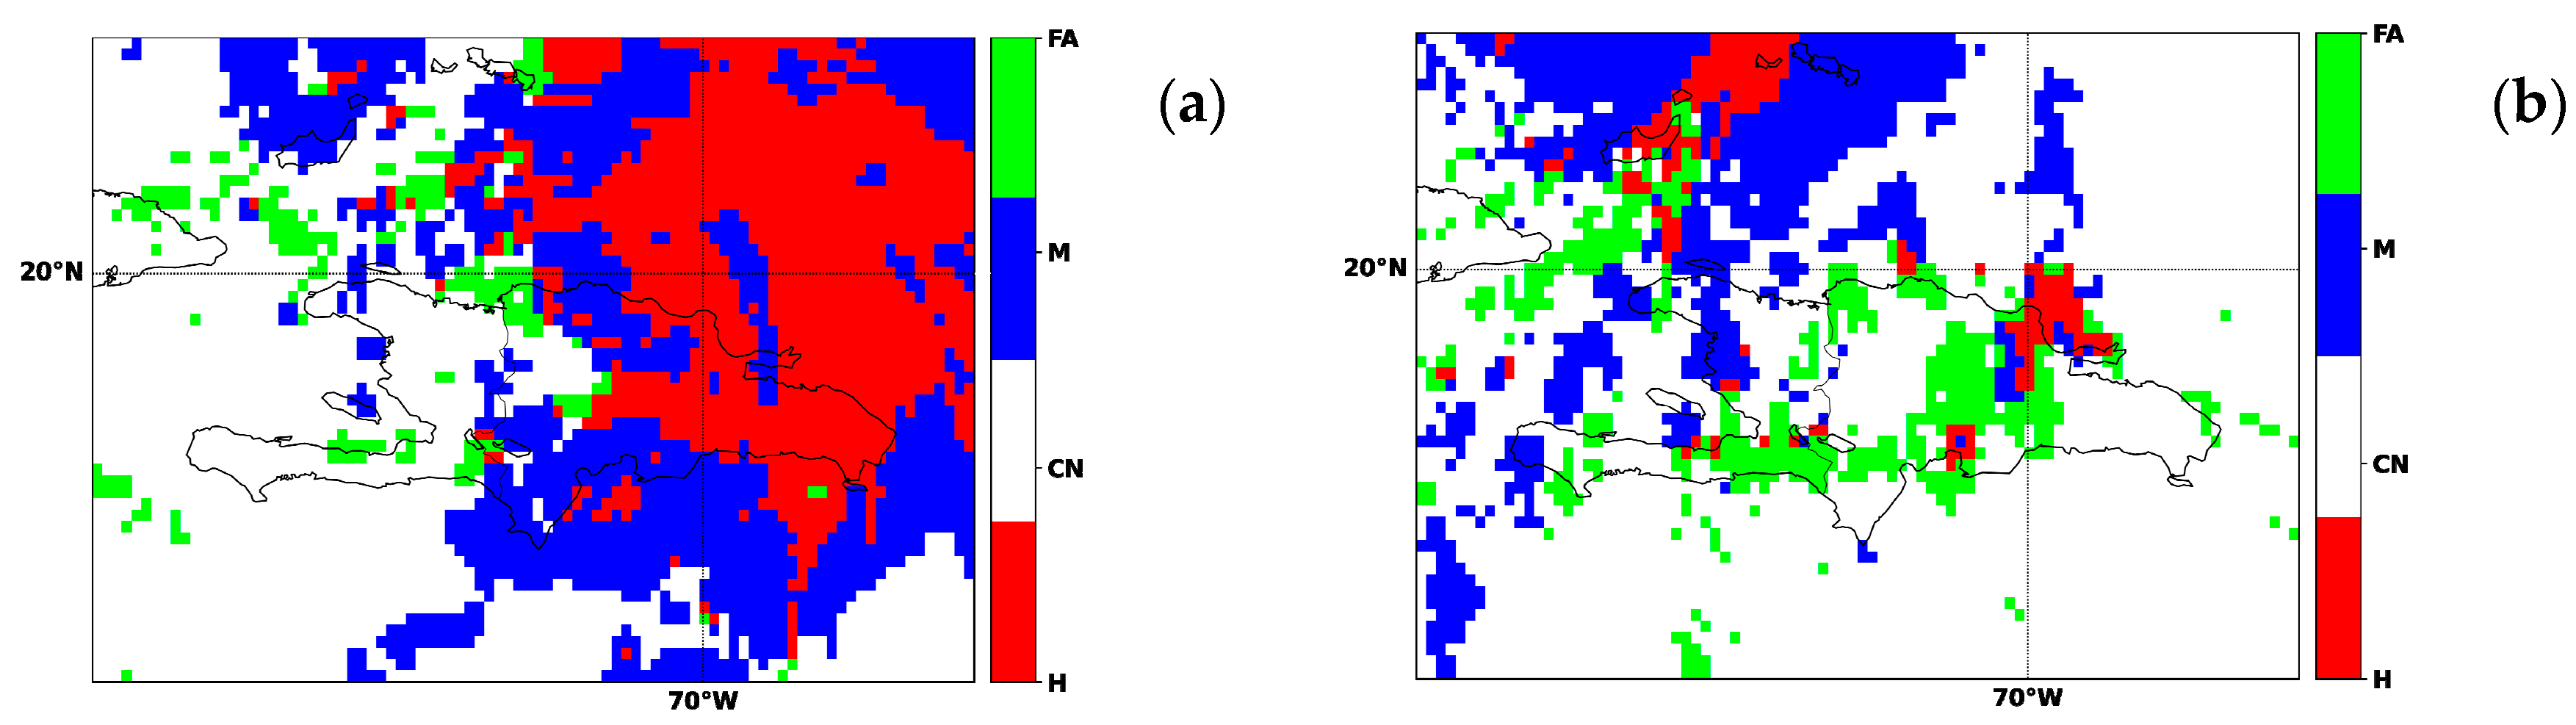
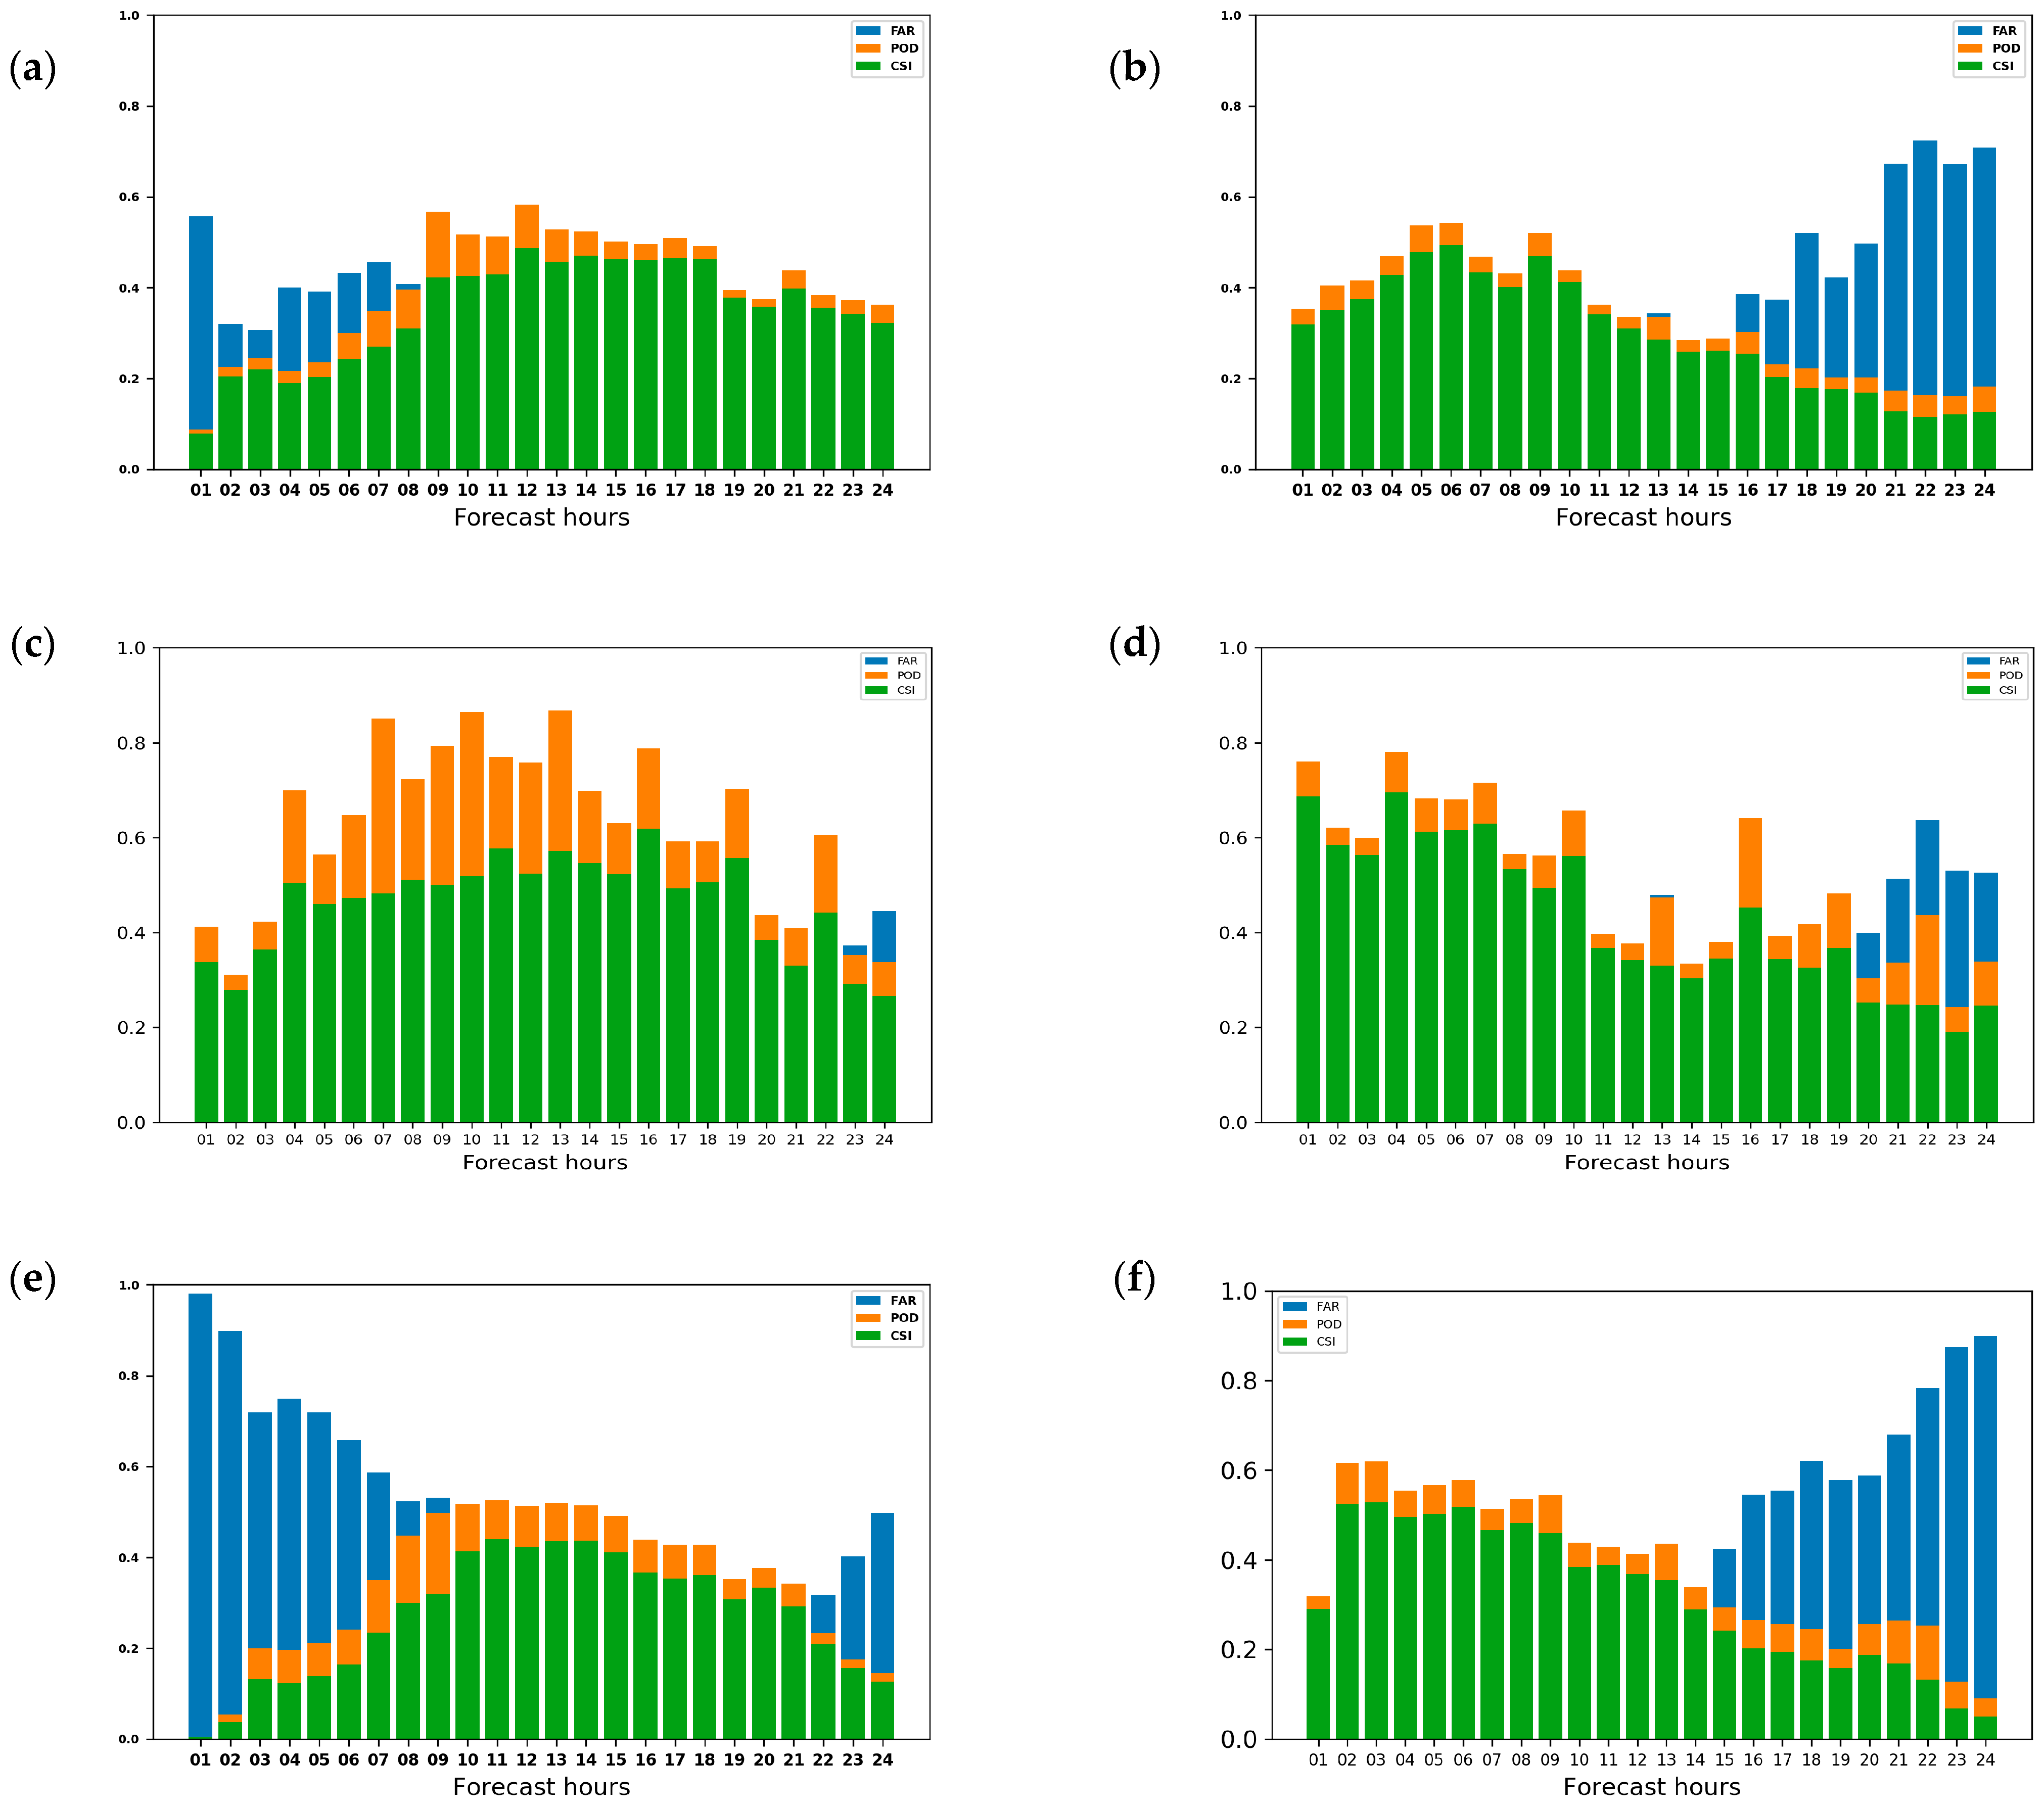
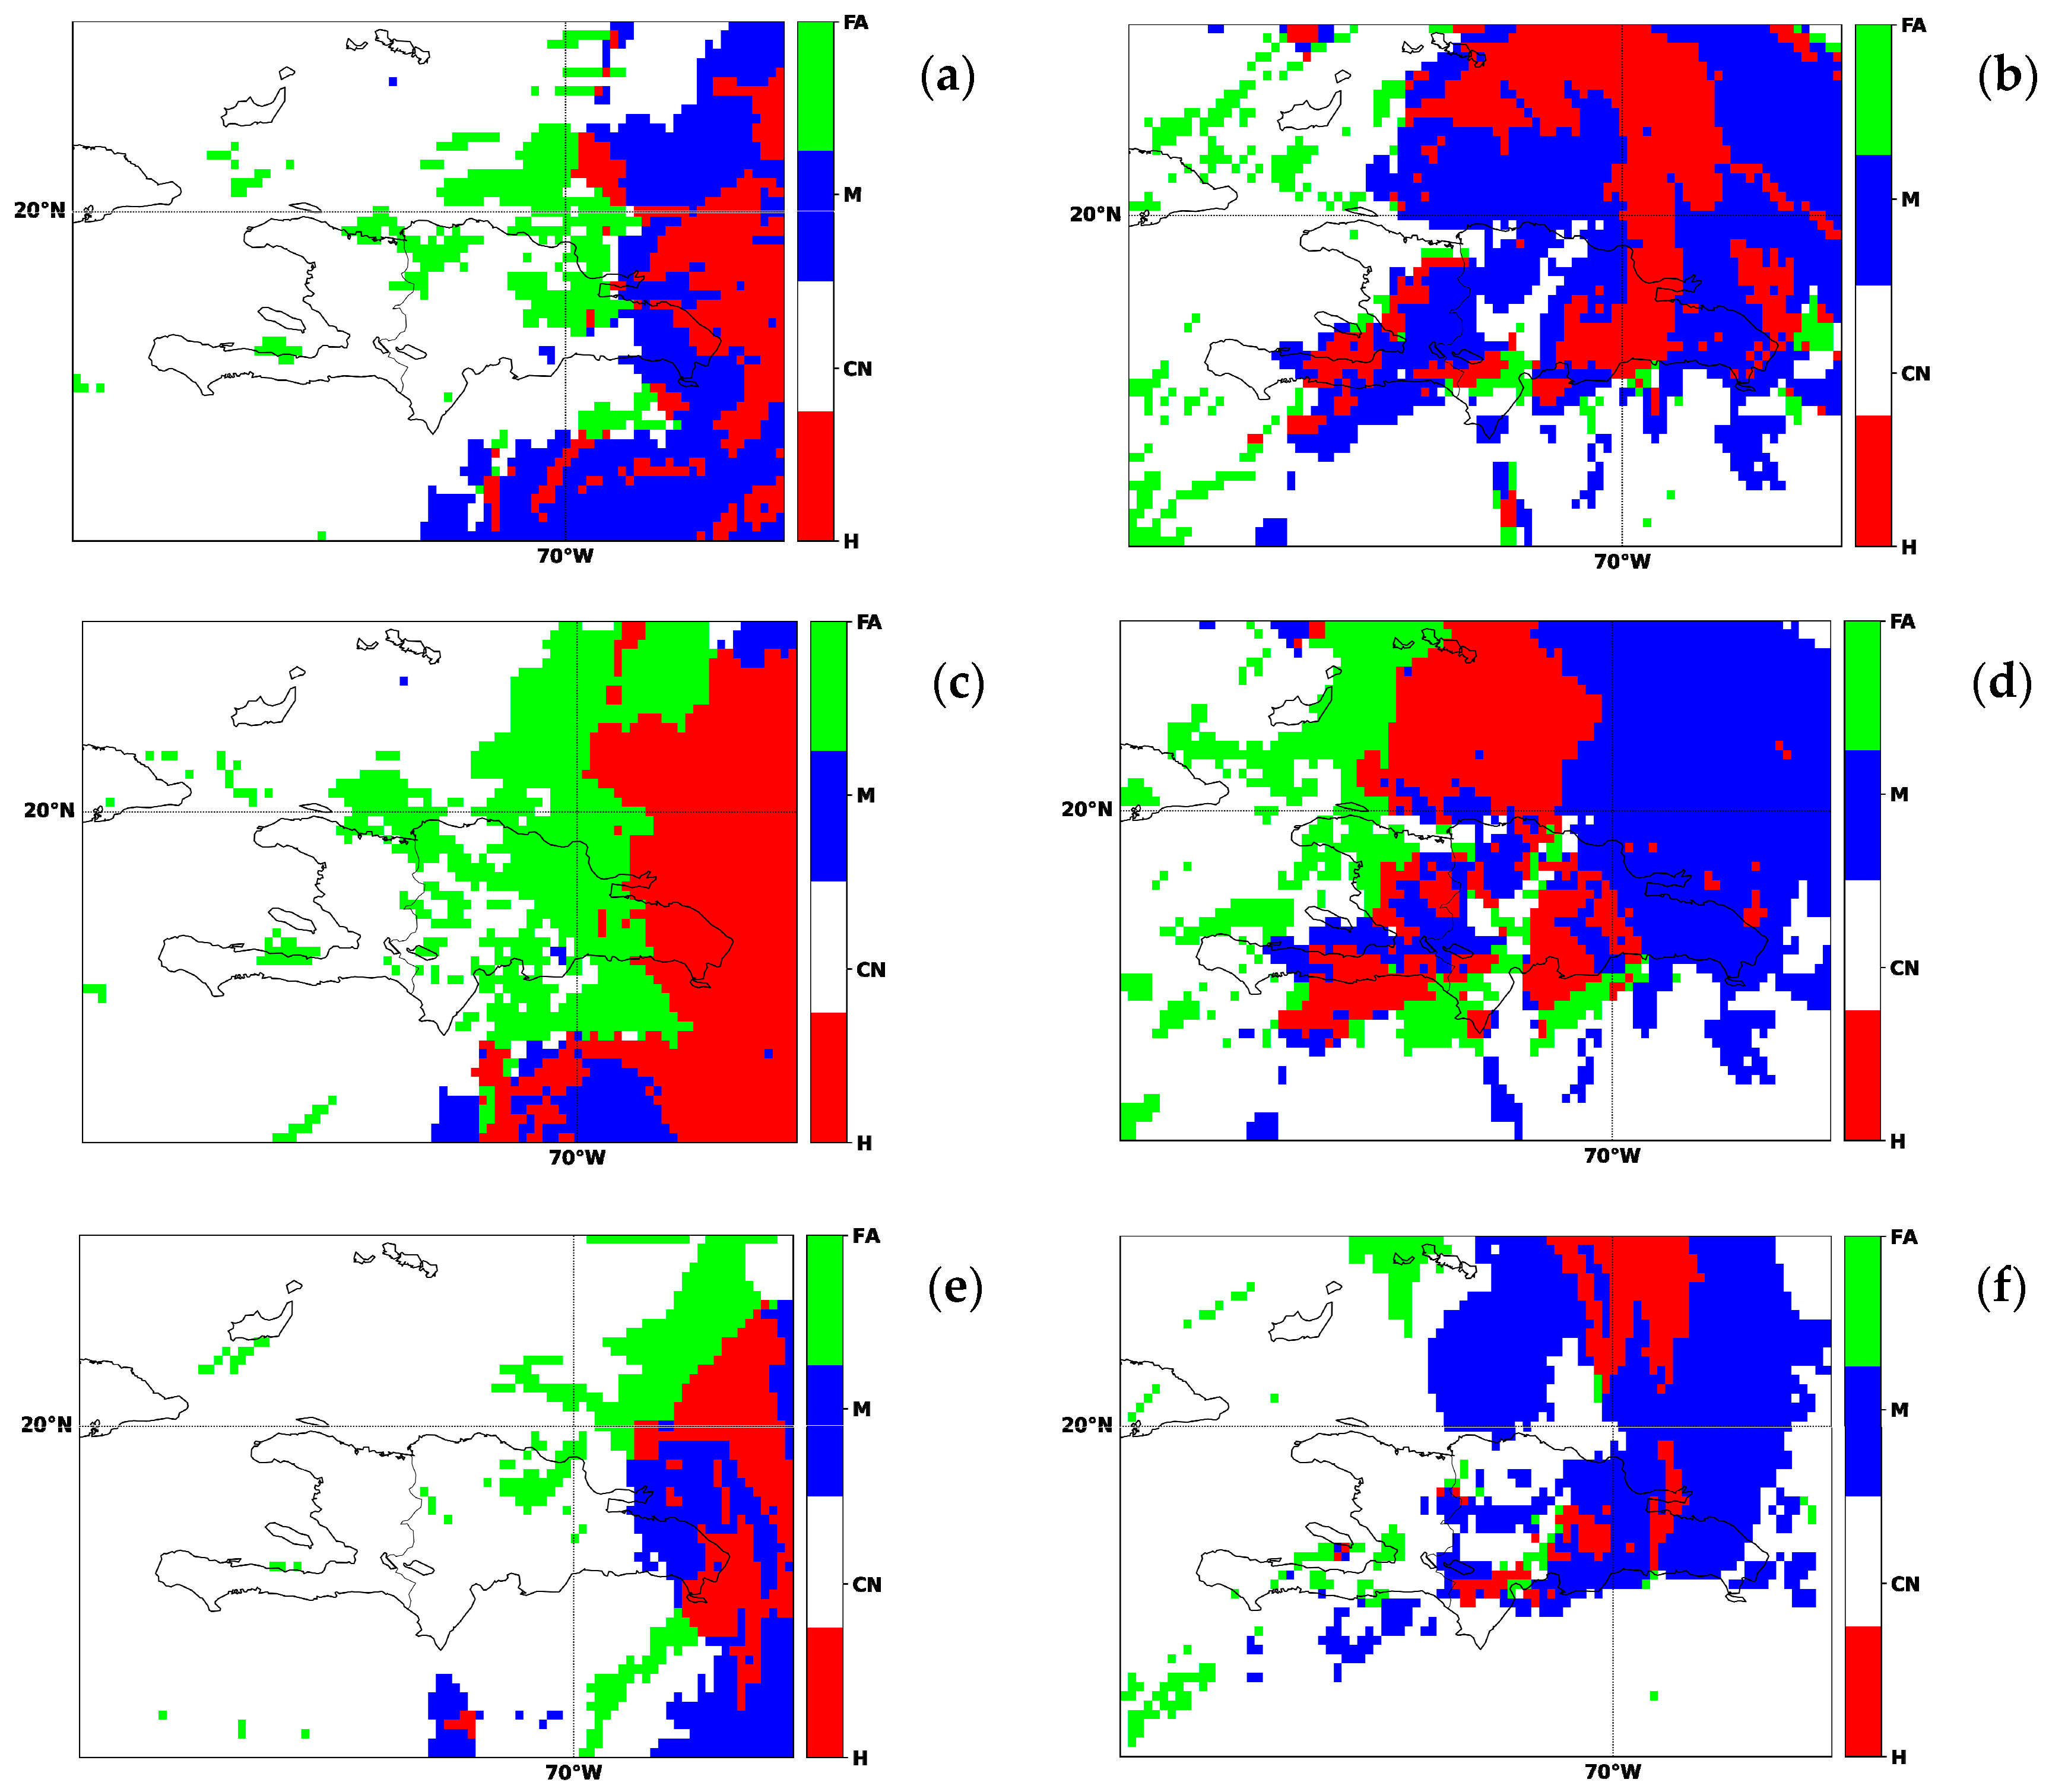
3.2. Categorical Verification

In order to know and characterize the behavior of the forecast products used by the FFGS as well as the forecast generated by SisPI in the quantitative prediction of rain for 24 h, the evaluation by categories is applied for different precipitation thresholds: 0.1, 50, 100, 150 and 200 mm. With the parameters hits, misses, corrected negative and false alarms calculated, the critical success index is obtained. Table 1 shows the values of this index for each forecast and each mentioned threshold. Notice that in the rain or no rain category (0.1 threshold) the HIRESW-NMMB presents the best performance. However, when we look at the categories that comprise the extreme values, the HIRESW-ARW and the SisPI have better skill.
A complete picture of the behavior of the CSI, the POD and the FAR for each initialization 0600 and 1800 UTC and, for each forecast term is shown in Figure 6 Again, the forecast obtained with HIRESW-NMMB, which reaches values of POD greater than 0.8 in various forecast periods and values greater than 0.4 for the CSI, stands out. It is also the system that produces the fewest false alarms. On the other hand, the most discrete values are obtained with SisPI, which presents as the greatest deficiency a high value of the false alarm index. In relation to this difference in false alarms between HIRESW-ARW, HIRESW-NMMB and SisPI, it can be pointed out as a possible influencing factor the fact that the SisPI does not have a data assimilation system.
Figure 7 and Figure 8 allow an approach to the behavior of the evaluation metrics from the spatial point of view. Figure 7 shows the spatial distribution of hits, misses, corrected negative and false alarms for the forecast for 30 July 2020 1400 UTC and 31 July 2020 0500 UTC, generated by the three systems with initialization 0600 UTC. It is evident that the highest number of hits is exhibited by the HIRESW-NMMB, at the same time that HIRESW-ARW and SisPI show higher areas of misses and false alarms.
In Figure 8, where the same metrics are shown but for the runs initialized at 1800 UTC and the forecast periods, an increase in the hitting areas is observed, with HIRESW-NMMB still being the system with the best results.

4. Conclusions

In the work presented, a first verification of the quantitative forecast of precipitation which is obtained from the HIRESW-ARW and HIRESW-NMMB forecast products used by the FFGS and the forecast generated by SisPI was carried out. In particular, the evaluation was applied to the Tropical Storm Isaias that affected the Dominican Republic during 29–31 July 2020. Although it is necessary to carry out an evaluative exercise considering more case studies, for the meteorological situation analyzed in this study, some preliminary conclusions can be put forth:
  • In general, the three evaluated forecast systems showed good ability to forecast the rainy areas of Tropical Storm Isaias.
  • For the forecast of rain occurrence, the HIRESW-NMMB presents the best results, with a probability of detection that reaches a value of 0.8.
  • The HIRESW-ARW and SisPI systems have better performance than the HIRESW-NMMB for heavy rain values.
  • SisPI presents the highest FAR index values.

Author Contributions

Conceptualization, M.S.L. and J.M.; methodology, M.S.L., J.M. and A.F.B.; software, M.S.L., S.A.Á. and A.F.B.; validation, M.S.L., S.A.Á., A.F.B. and M.S.L.; formal analysis, J.M. and M.S.L.; investigation, M.S.L.; resources, J.M. and M.S.L.; data curation, M.S.L. and A.F.B.; writing—original draft preparation, M.S.L.; writing—review and editing, M.S.L., J.M. and J.S.; visualization, M.S.L. and A.F.B.; supervision, M.S.L. All authors have read and agreed to the published version of the manuscript.

Data Availability Statement

The data from the numerical forecasting systems evaluated in this investigation are available at http://186.149.199.244/data/.

Acknowledgments

Authors wants to thanks the support provided under the Caribbean component of the Canada CREWS project: “Building Resilience to High-Impact Hydro-meteorological Events through Strengthening Multi-Hazard Early Warning Systems (MHEWS) in Small Island Developing States (SIDS) and Southeast Asia (SEA)”, funded by the Environment and Climate Change of Canada (ECCC).

Conflicts of Interest

The authors declare no conflict of interest.

References

  1. Hou, A.Y.; Kakar, R.K.; Neeck, S.; Azarbarzin, A.A.; Kummerow, C.D.; Kojima, M.; Oki, R.; Nakamura, K.; Iguchi, T. The Global Precipitation Measurement Mission. Bull. Am. Meteorol. Soc. 2014, 95, 701–722. [Google Scholar] [CrossRef]
  2. WWRP/WGNE Joint Working Group on Verification. Forecast Verificacion-Issues, Methods and FAQ (pdf Version). 2018. Available online: http://www.cawcr.gov.au/staff/eee/verif/verif_web_page.html (accessed on 15 May 2020).
  3. Sierra-Lorenzo, M.; Ferrer-Hernández, A.L.; Hernández-Valdés, R.; González-Mayor, Y.; Cruz-Rodríguez, R.C.; Borrajero-Montejo, I.; Rodríguez-Genó, C.F. Sistema Automático de Predicción a Mesoescala de Cuatro Ciclos Diarios; Technical Report; Instituto de Meteorología de Cuba: La Habana, Cuba, 2014. [Google Scholar]
  4. Sierra-Lorenzo, M.; Borrajero-Montejo, I.; Ferrer-Hernández, A.L.; Hernández-Valdés Morfa-Ávalos, Y.; Morejón-Loyola, Y.; Hinojosa-Fernández, M. Estudios de Sensibilidad del Sispi a Cambios de la pbl, la Cantidad de Niveles Verticales y, las Parametrizaciones de Microfısica y Cúmulos, a muy alta Resolución; Technical Report; Instituto de Meteorología de Cuba: La Habana, Cuba, 2017. [Google Scholar]
  5. Landsea, C.; Franklin, J.; Beven, J. The Revised Atlantic Hurricane Database; Relatório Técnico, National Hurricane Center: Miami, FL, USA, 2015. [Google Scholar]
  6. Sierra-Lorenzo, M.; Bezanilla-Morlot, A.; Centella-Artola, A.; León-Marcos, A.; Borrajero-Montejo, I.; Ferrer-Hernández, A.; Salazar-Gaitán, J.; Lau-Melo, A.; Picado-Traña, F.; Pérez-Fernández, J. Assessment of Different WRF Configurations Performance for a Rain Event over Panama. Atmos. Clim. Sci. 2020, 10, 280–297. [Google Scholar] [CrossRef]
Figure 1. Simulation domain for HIRESW-ARW and HIRESW-NMMB that includes Dominican Republic.
Environsciproc 08 00035 g001
Figure 2. Simulation domains for SisPI.
Environsciproc 08 00035 g002
Figure 3. Hurricane Isaias’ track [5].
Environsciproc 08 00035 g003
Figure 4. Precipitation estimated for 24 h by the GPM product for 30 July 2020.
Environsciproc 08 00035 g004
Figure 5. Precipitation measurements reported by surface stations (a) and precipitation estimated by the GPM product interpolated at the stations coordinates (b). The bias and rmse metrics are shown in panels (c) and (d) respectively.
Environsciproc 08 00035 g005aEnvironsciproc 08 00035 g005b
Figure 6. CSI, POD and FAR index for 0600 (a,c,e) and 1800 (b,d,f) runs for 30 July 2020 of HIRESW-ARW (a,b), HIRESW-NMMB (c,d) and SisPI (e,f).
Environsciproc 08 00035 g006
Figure 7. Hits, misses, corrected negative and false alarms (0.1 threshold) for the 30 July 2020 runs initialized at 0600 UTC: at 30 July at 1400 UTC forecast time (a,c,e) and 31 July at 0500 UTC forecast time (b,d,f). Result for HIRESW-ARW, HIRESW-NMMB and SisPI are shown in the panels (a,b), (c,d) and (e,f) respectively.
Environsciproc 08 00035 g007
Figure 8. Hits, misses, corrected negative and false alarms (0.1 threshold) for the 30 July 2020 runs initialized at 1800 UTC: at 31 July at 0100 UTC forecast time (a,c,e) and 31 July at 1800 UTC forecast time (b,d,f). Result for HIRESW-ARW, HIRESW-NMMB and SisPI are shown in the panels (a,b), (c,d) and (e,f) respectively.
Environsciproc 08 00035 g008aEnvironsciproc 08 00035 g008b
Table 1. CSI values for the 24 h rainfall forecast of the HIRESW-ARW, HIRESW-NMMB and SisPI.
ThresholdHIRESW-ARW
0600/1800
HIRESW-NMMB
0600/1800
SisPI
0600/1800
0.10.7250.8510.8240.8520.6680.702
500.4570.4840.2630.2690.3970.472
1000.1380.2740.0420.1360.3170.254
1500.0380.1600.0030.1320.1770.129
2000.0250.10.00.0480.0410.009
Publisher’s Note: MDPI stays neutral with regard to jurisdictional claims in published maps and institutional affiliations.

