Proceeding Paper

Analysis of Possible Physical Factors That Accelerate Downdrafts in Storm Clouds over Cuba †

by
Gleisis Alvarez-Socorro
1,*,
Mario Carnesoltas-Calvo
2,
Alis Varela-de la Rosa
2 and
José C. Fernández-Alvarez
1,3
1
Departamento de Meteorología, Instituto Superior de Tecnologías y Ciencias Aplicadas, Universidad de la Habana, La Habana 10400, Cuba
2
Instituto de Meteorología de Cuba, La Habana 10400, Cuba
3
Centro de Investigación Mariña, Environmental Physics Laboratory (EPhysLab), Universidade de Vigo, Campus As Lagoas s/n, 32004 Ourense, Spain
*
Author to whom correspondence should be addressed.
Presented at the 4th International Electronic Conference on Atmospheric Sciences, 16–31 July 2021; Available online: https://ecas2021.sciforum.net.
Environ. Sci. Proc. 2021, 8(1), 23; https://doi.org/10.3390/ecas2021-10321
Published: 22 June 2021
(This article belongs to the Proceedings of The 4th International Electronic Conference on Atmospheric Sciences)

Abstract

:
One of the manifestations of severe local storms is strong linear winds, which are known as a downburst and which are capable of causing great losses to the country’s economy and society. Knowing which factors in the atmosphere are necessary for the occurrence of this phenomenon is essential for its better understanding and prediction. The objective of this study was to analyze the possible physical factors that accelerate downdrafts in the storm clouds in Cuba. To do so, 10 study cases simulated with the weather research and forecasting (WRF) model at 3 km of the spatial resolution were used. The factors capable of discriminating between downbursts and thunderstorms without severity were obtained. These were the absorption of latent heat by evaporation and fusion, the equivalent potential temperature difference between the level of maximum relative humidity in the low levels and of minimum relative humidity in the middle levels, the speed of the downdraft, and the downdraft available convective potential energy (DCAPE). Unlike previous research, they discriminated against updraft buoyancy and energy advection, both at the middle levels of the troposphere.

1. Introduction

Severe local storms (SLS) are considered one of the most dangerous phenomena on the mesoscale. The need to predict them has increased in recent decades in an attempt to mitigate the major socio-economic impact they often cause, including the loss of human lives. One of the manifestations of severity in the SLS is the strong horizontal linear winds (greater than or equal to 25 m/s) observed along a line that moves through the land surface called the Gust Front. This air mass is due to the cold downward current of the storm cloud, known as downbursts (DB) [1].
The prediction of DB in Cuba continues to be a task of great interest for specialists. The prevention of its occurrence is very complex since it affects a very small area and its onset, development, and dissipation can occur in a short time. Knowing what pre-existing factors in the atmosphere are necessary for this phenomenon to occur, especially in tropical island conditions, is essential for its better understanding and better prediction.
Numerous studies have been carried out around the world on DB, most of them to achieve a more effective prediction of them. Doswell’s [2] findings are among the most important to consider. These show that liquid water content and negative buoyancy due to the cooling by evaporation are key factors that initiate and maintain a downward current. Srivastava [3] also stated that among the factors that make possible the strengthening of the downdraft is advection of relatively dry air with the consequent cooling by evaporation and the reinforcement by a large amount of liquid water per unit volume. A study performed by Caracena and Maier [4] for South Florida also emphasizes the importance of dry air in the middle levels of the troposphere, as an environment that produces humid micro-downbursts (micro–DB). Recently, Oreskovic [5], carried out an investigation from numerical simulations of a DB taking into account a parametric study and a comparison with a meteorological model. Furthermore, Burlando [6], carried out a study of a DB using laser imaging detection and ranging (LIDAR) measurements and the modeling of the cumulonimbus cloud (Cb) from the weather research and forecasting model (WRF).
The first research carried out in Cuba about SLS was climatological, highlighting the studies of Alfonso [7] and Aguilar [8]. Afterward, Aguilar [9] and Carnesoltas [10] focused their research on finding the conditions that favor the occurrence of SLS in Cuba on a synoptic scale. Carnesoltas [11] referred to three necessary and one sufficient conditions for the occurrence of manifestations of local severity as a set of cause–effect processes and not as threshold values of independent variables.
Specifically, Gutierrez [12] determined the pre-existing physical–meteorological factors in the tropospheric mean levels that allow the occurrence of DB in Cuba. This author used the rapid refresh weather numerical forecast modeling system (RAP), which has 13.5 km of spatial resolution. According to the author, this resolution is not ideal for mesoscale work because it produces difficulties in representing the physical processes that generate DB. For this reason, it was necessary to use a higher spatial resolution, which would allow the obtainment of a better detail of the pre-existing physical factors in the environment, where the storm that could produce the severe event would develop. Therefore, the objective of this study was to analyze the possible physical factors that accelerate downdrafts in storm clouds in Cuba with a model of better spatial resolution.

2. Material and Methods

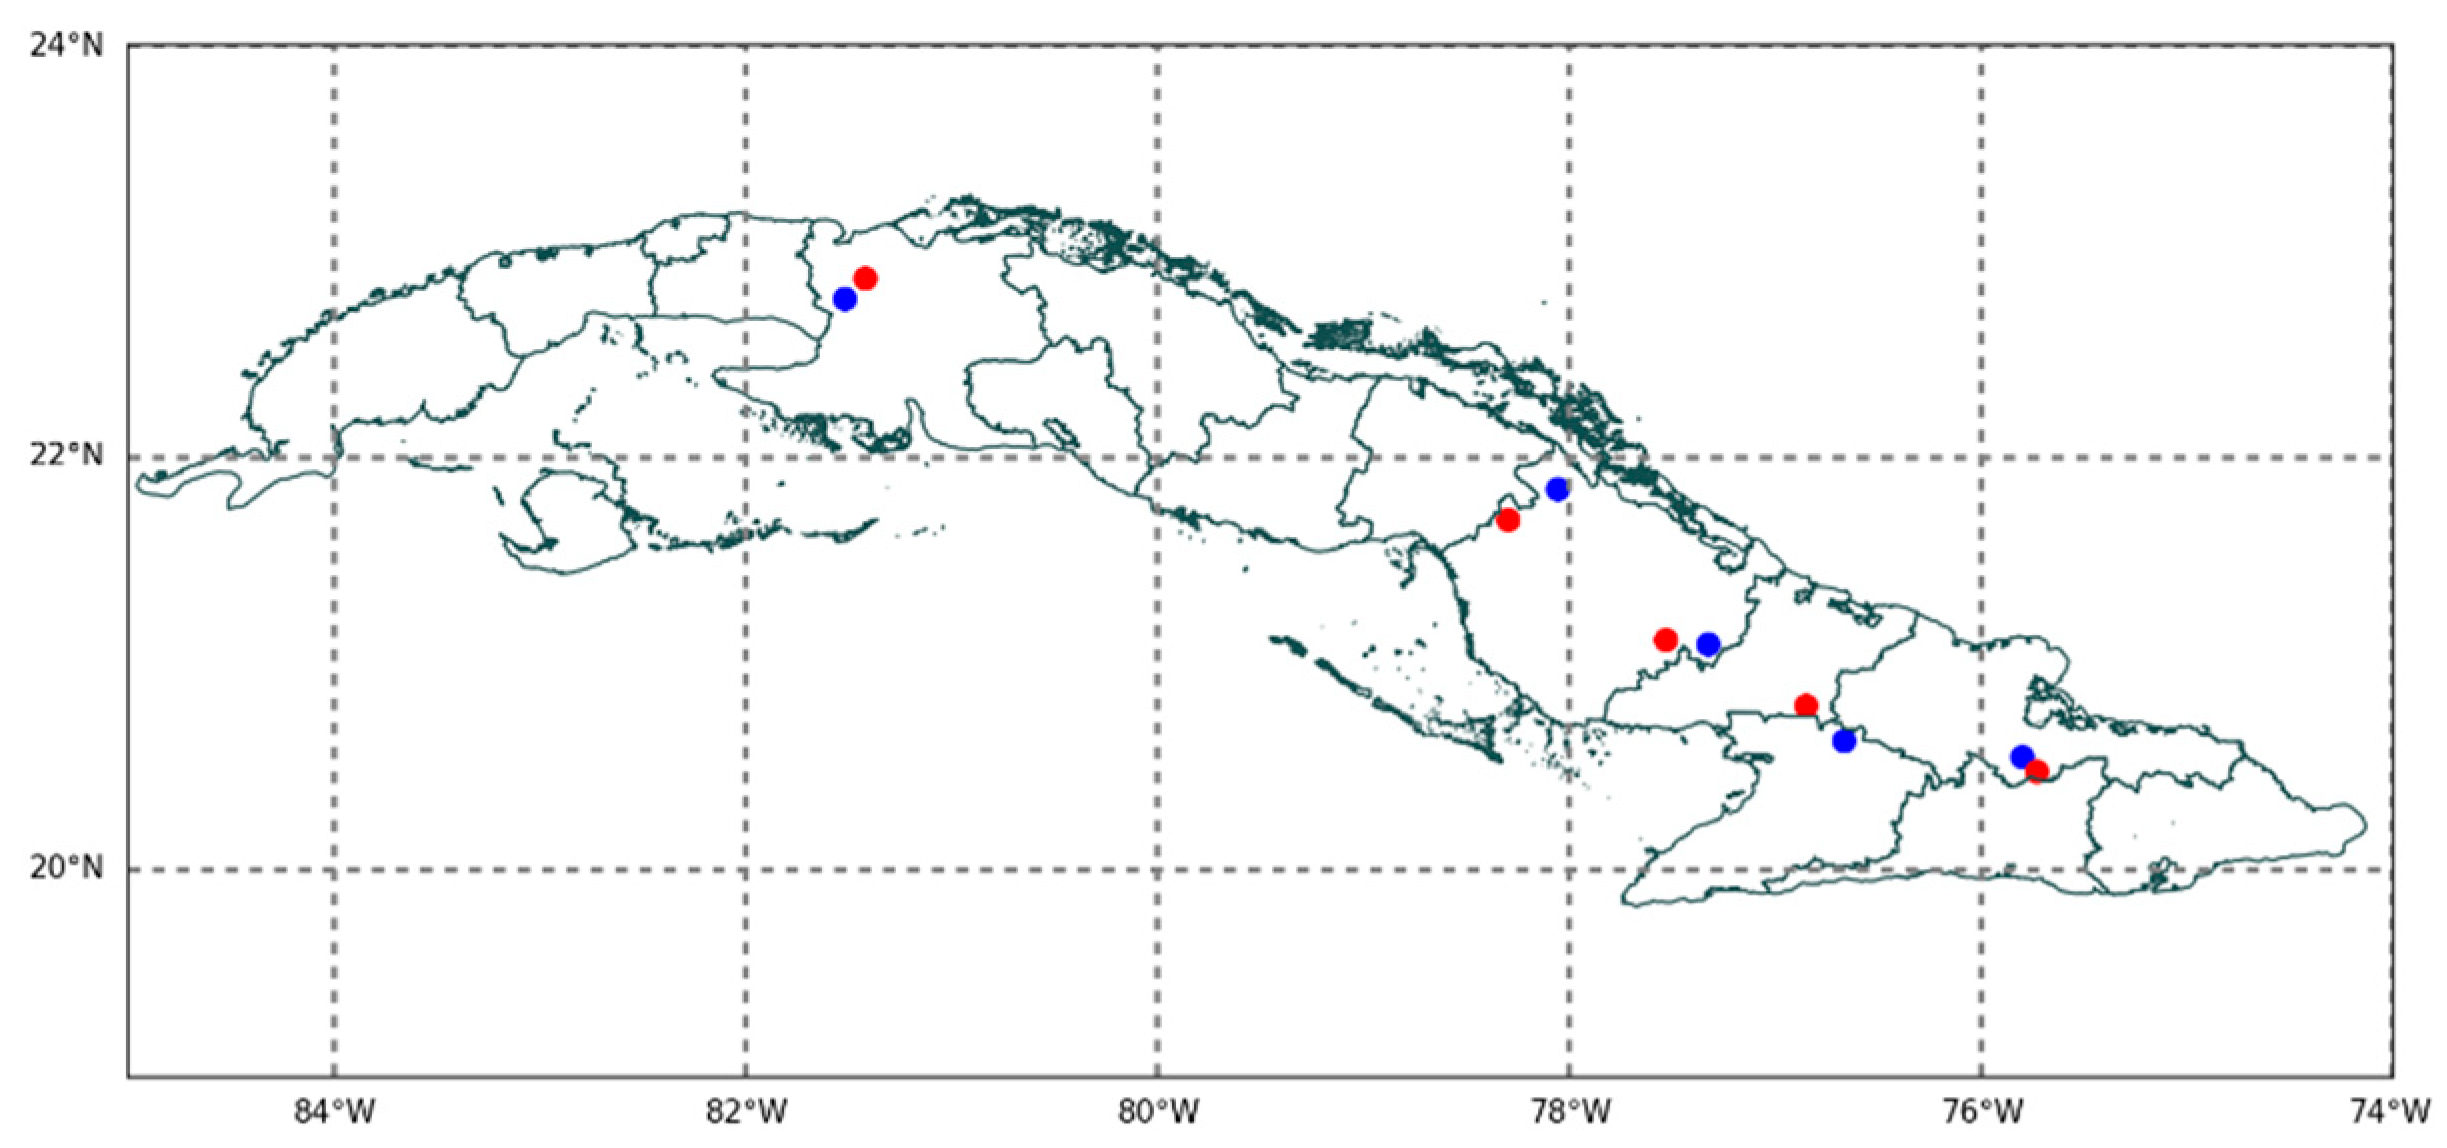
2.1. Region of Study and Selection of the Cases Analyzed

The study region included the entire Cuban territory since reports of DB and non-severe thunderstorms (TS) from different provinces of the country were analyzed. For this selection, it was taken into account that Cuba is affected by various meteorological systems during the rainy and dry periods, which, on many occasions, are associated with TS with severity and without it. The geographical distribution of the 10 cases selected for this research is shown in Figure 1. The red points represent the DB, which was obtained from the SLS reports in the Centro de Pronósticos del Instituto de Meteorología de Cuba (INSMET), taking into account that no other severe event occurred this day. The blue points correspond to the TS considering days and hours close to the DB reports so that changes in the terrain or seasonal variations would not influence the results.

2.2. Data

The numerical outputs of the atmospheric model were used, and WRF [13], version 3.8.1, was initialized with the output of the global forecast system (GFS) model, with 0.5 degrees of spatial resolution and the dynamic core advanced research WRF (ARW). These outputs have a time resolution of 1 h. The configuration used is shown in Table 1; in bold appears the specific characteristics of the domain used (3 km). This resolution permitted more details of the pre-existing physical factors in the environment where the storm developed.

2.3. Methodology

The numerical outputs of the WRF with 3 km of the spatial resolution were used as a new tool to more accurately determine the position of the downdraft and to identify the significant physical factors existing in the atmosphere that could accelerate the downdrafts within the downdraft cloud storm. Specifically, the atmospheric pressure, the potential temperature, the geopotential height, the components of wind speed (u, v, w), and the mixing ratio of water vapor, cloud, rain, and ice were used. The cubic spline method was used to interpolate the variables at the corresponding latitude and longitude of each position of the storm. The equations of the dynamic and thermodynamic variables that were used to calculate the possible factors that were able to discriminate between the occurrence or not of DB are shown in Table 2, following the methodology proposed by Gutierrez [12].
In addition, the speed of the downdraft was determined, from the DCAPE [14], using the following formula:
w max d = 2 DCAPE 2
The vertical speed of the downdraft was used to combine it with the factors mentioned above, to carry out a specific analysis of each one, and to be able to determine whether or not they managed to discriminate between the occurrence of DB. To do so, methodology presented by Gutierrez was utilized [12].
The results obtained for the downburst of 27 April 2017 and the thunderstorm of 30 April 2017 are presented. The selection criterion was based on the same representativeness where the differences of both phenomena were evident.

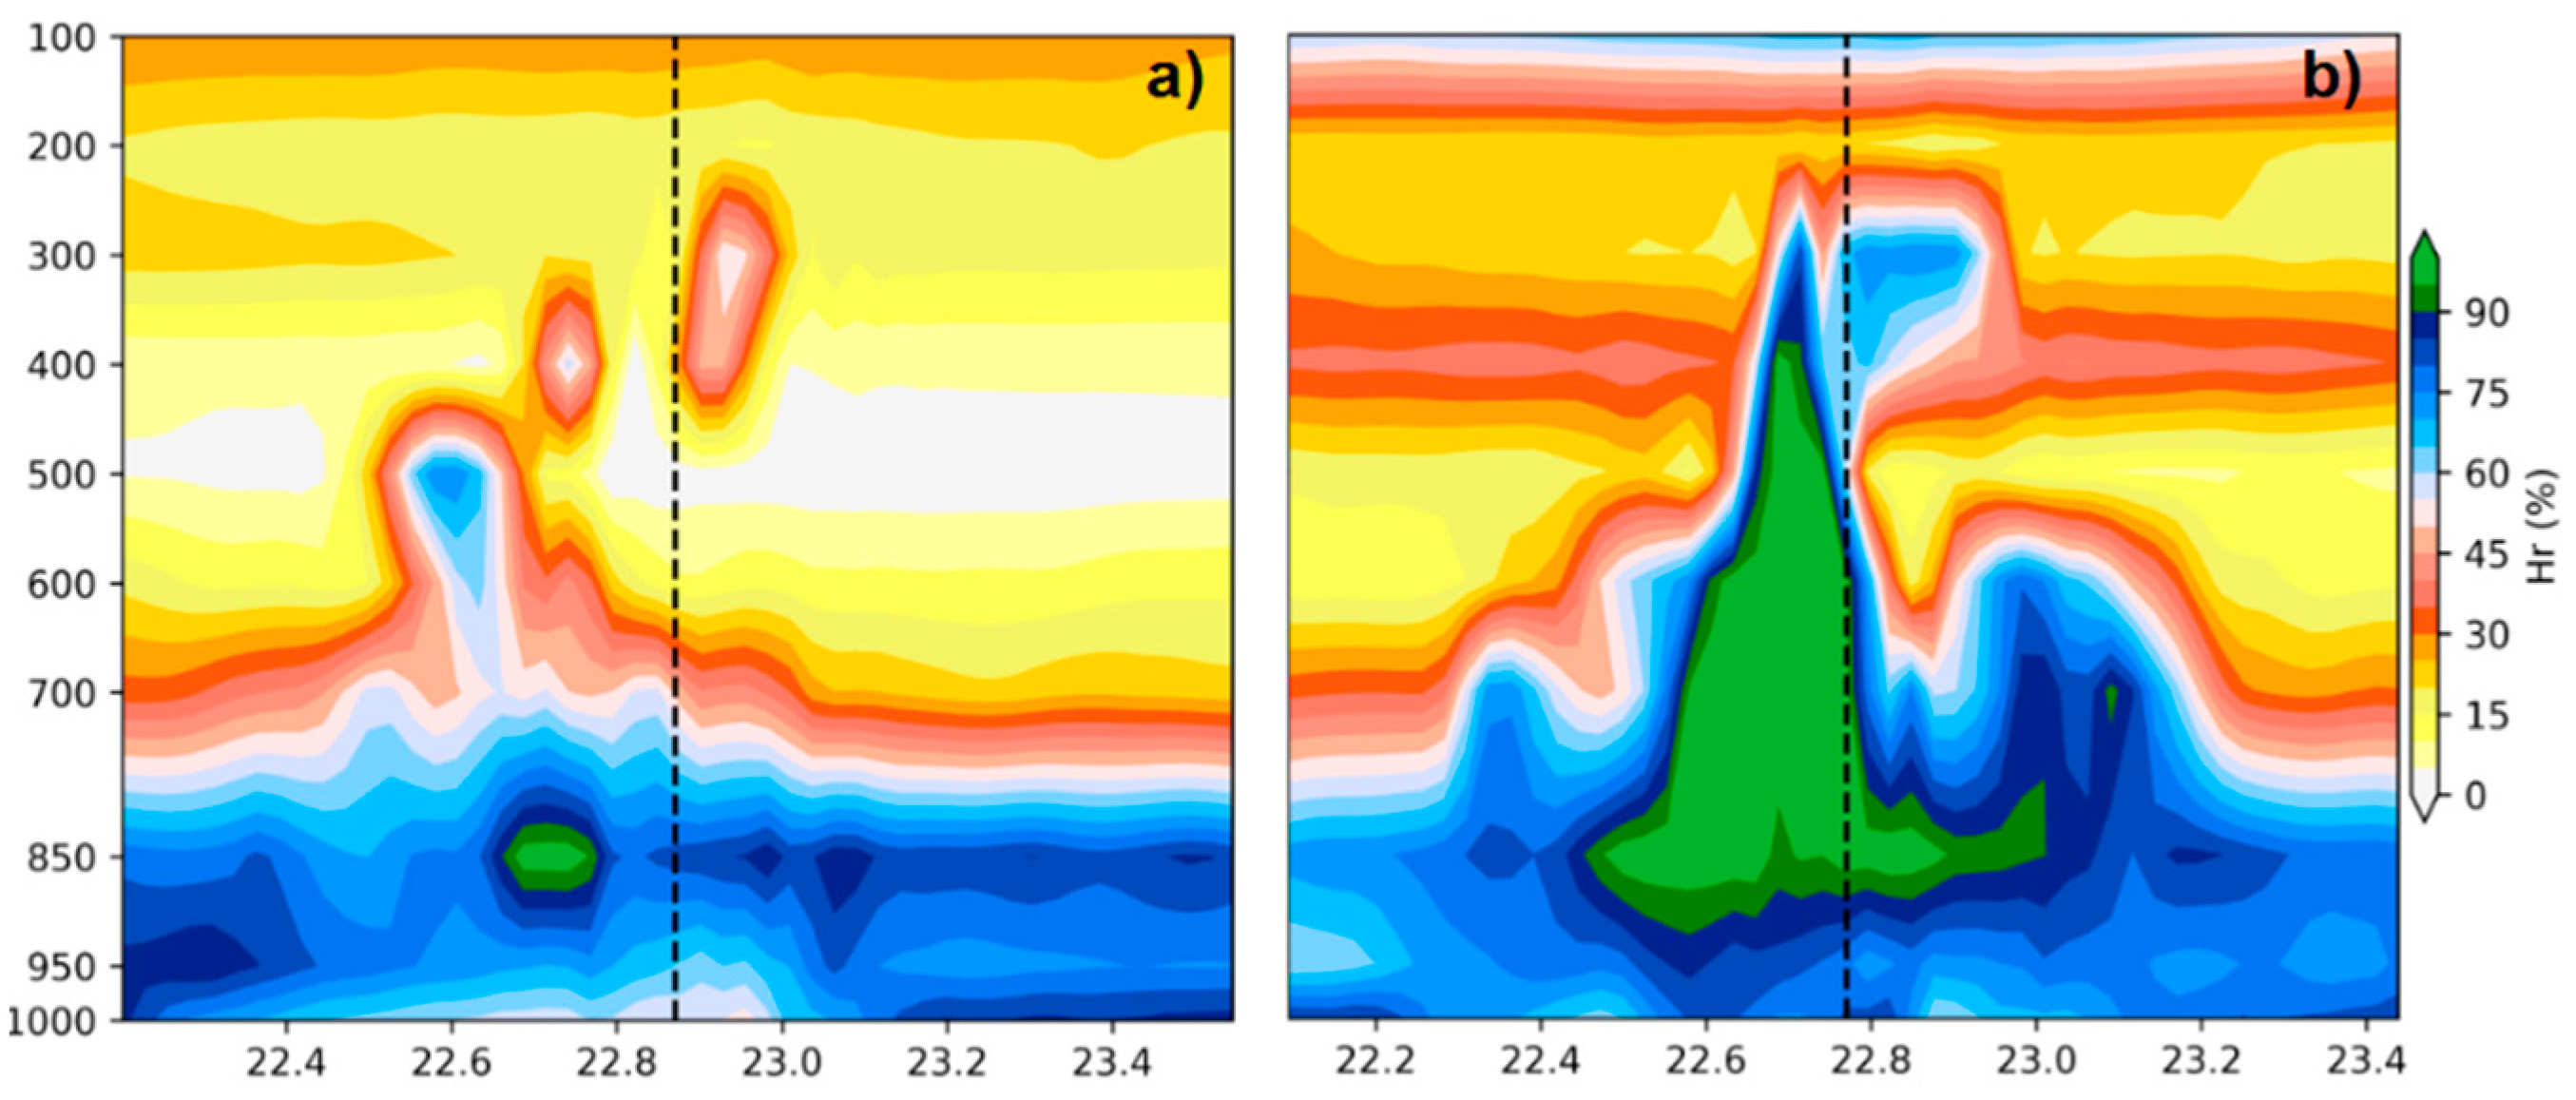
3. Results and Discussion

The factors related to viscosity, precipitable water, Coriolis vertical acceleration, and horizontal mass advection, failed to discriminate between the occurrence of DB and TS, coinciding with that obtained by Gutierrez [12]. One of the causes of these results may be related to their small order of magnitude, making a minimal contribution to the acceleration of downdrafts. It can even be considered that they are not able to discriminate between the two storms, since, despite the use of a higher spatial resolution, the results do not differ from previous research.
The most satisfactory results correspond to those related to the existence of the dry layer in the middle levels of the troposphere and the consequent absorption of latent heat by evaporation and fusion, ratifying what was obtained by Gutierrez [12]. Next, Table 3 is presented, which shows all the variables that were able to discriminate between the occurrence of DB and TS, each with its respective possible critical values.
For the analysis of the dry layer, zonal and southern vertical cuts of the relative humidity for the location of each of the storms were made. In both cases, there was a high moisture content in the low levels up to approximately 700 hPa, reaching humidity values that ranged between 75 and 100% (Figure 2). This result agrees with the previous findings of Carnesoltas [11], who suggested that “the formation of deep convection, and even severity within it, necessitates the presence of elevated humidity values at low levels.”
The difference between both days was observed mainly in the middle levels of the troposphere, approximately between 700 and 400 hPa. In the case of DB, there was a deep dry layer at the aforementioned levels, with relative humidity values below 20%. However, in the case of the TS, the relative humidity reached higher values in the average levels, even reaching 100%, as shown in Figure 2; in the other cases, they ranged between 35–50%. The low values of relative humidity in the middle levels of the troposphere, in the case of DB, favored the absorption of latent heat by evaporation and fusion mentioned before. This caused the air surrounding the water particles to cool down, become denser, with higher specific gravity, and accelerate toward the surface, helping to strengthen the downdraft.
In addition, the spatial fields of the equivalent potential temperature difference between the level of maximum relative humidity in the low levels and of minimum relative humidity in the middle levels were analyzed. DB tended to be located in places where this difference was higher concerning TS, which can be seen in Figure 3, confirming what was obtained by Gutierrez [12]. This variable is representative of the humidity contrast that is generated in the case of DB [15].
The advection of energy in the average levels, the speed of the downdraft, and the DCAPE was discriminated for all the cases analyzed, except for the DB that occurred on 21 November 2017, as shown in Table 4. This could be because it occurred in the dry season of the year. This can influence the behavior of the variables, as well as the conditions present in the atmosphere that allow the occurrence of this severe event. In addition, the departures available for this day corresponded to 2000 UTC, which had a difference of 40 min concerning the time of the report, which may suggest that the conditions had not been fully formed. That is why it is recommended that more cases of the dry season of the year be used in other investigations to analyze the behavior of the variables in this period.
Unlike the results obtained by Gutierrez [12], the buoyancy and horizontal advection of energy, both in the middle levels of the troposphere, discriminated between the occurrence of DB and TS, as can be seen in Figure 4. The exception was the DB energy advection of 21 November 2017, which presented 2.03 × 10⁻¹ J/s, and whose possible causes were raised above. The increase in buoyancy in the updraft contributes to a greater amount of mass rising in the case of DB, which makes it possible to also increase the amount of mass that descends, while the decrease in the horizontal advection of energy allows more flow to return to the surface, thus increasing the speed of the downdraft in both cases. It is considered that the resolution used in this investigation was related to these results, since it determines a better detail of the physical processes that take place within the storm cloud.

4. Conclusions

The factors that discriminated between the downbursts and thunderstorms without severity for different study cases in Cuba were determined. For all the cases analyzed, these were the absorption of latent heat by evaporation and fusion, both in the updraft, the buoyancy at the mean levels, and the equivalent potential temperature difference between the maximum humidity level in the low levels and the minimum humidity level in the middle levels. Unlike previous research, buoyancy and energy advection, both in the middle levels of the troposphere, were identified as discriminating factors between the occurrence of downbursts and non-severe thunderstorms. Viscosity, precipitable water, Coriolis vertical acceleration, and horizontal mass advection, although contributing to the acceleration of downdrafts, were not able to discriminate between the occurrence of downbursts and thunderstorms without severity, due to the order of magnitude, which was so small that they were compared to the rest of the factors. The downbursts of 21 November 2017 did not comply with the critical values established for the horizontal advection factors of energy in the medium levels, the speed of the downdraft, and the DCAPE, which related them to the time of the exit used and suggested that they belong to the dry season of the year.

Author Contributions

G.A.-S., M.C.-C. and A.V.-d.l.R. conceived the idea of the study. J.C.F.-A. processed the data and made the figures. G.A.-S. analyzed the results and wrote the manuscript. All authors have read and agreed to the published version of the manuscript.

Funding

This research received no external funding.

Institutional Review Board Statement

Not applicable.

Informed Consent Statement

Not applicable.

Acknowledgments

The authors wish to thank the specialists from the Atmospheric Physics Center, the Forecasting Center, and the Camagüey Radar Center, all belonging to INSMET, for providing all the necessary data to carry out this research.

Conflicts of Interest

The authors declare no conflict of interest.

References

  1. Carnesoltas, M.; (Instituto de Meteorología, La Habana, Cuba). Personal communication, 2020.
  2. Doswell, C.A., III. The Operational Meteorology of Convective Weather. NOAA, Technical Memorandum NWS NSSFC-5. I, NTIS Accession No. PB83-162321. 1982. Available online: http://citeseerx.ist.psu.edu/viewdoc/download?doi=10.1.1.459.9956&rep=rep1&type=pdf (accessed on 15 November 2020).
  3. Srivastava, R.C. A simple model of evaporatively driven down draft: Application to microburst downdraft. J. Atmos. Sci. 1985, 42, 1004–1023. [Google Scholar] [CrossRef] [Green Version]
  4. Caracena, F.; Maier, M. Analysis of microburst in the FACE Meteorological Mesonetwork in Southern Florida. Mon. Weather Rev. 1987, 115, 969–985. [Google Scholar] [CrossRef] [Green Version]
  5. Oreskovic, C. Numerical Investigation of Full Scale Thunderstorm Downbursts: A Parametric Study and Comparison to Meteorological Model. Master’s Thesis, The University of Western Ontario, London, ON, Canada, 19 April 2016. Available online: https://ir.lib.uwo.ca/etd/3743 (accessed on 19 December 2020).
  6. Burlando, M.; Romanic, D.; Boni, G.; Lagasio, M.; Parodi, A. Investigation of the weather conditions during the collapse of the Morandi Bridge in Genoa on 14 august 2018. Nat. Hazards Earth Syst. Sci. 2019. [Google Scholar] [CrossRef] [Green Version]
  7. Alfonso, A.P. Climatología de las Tormentas Locales Severas de Cuba: Cronología; Editorial Academia: La Habana, Cuba, 1994; 168p, ISBN 978-95-902-0060-1. [Google Scholar]
  8. Aguilar, G.; Carnesoltas, M.; Naranjo, L.; Balseiro, C. Climatología de las tormentas locales severas en Cuba en el período 1987–2002. Resultados de la modelación de un caso de estudio. Rev. Cuba. Meteorol. 2005, 12, 3–10. [Google Scholar]
  9. Aguilar, G.; Carnesoltas, M.; Naranjo, L. Condiciones a escala sinóptica favorables para la aparición de tormentas locales severas en Cuba. Período poco lluvioso. Rev. Cuba. Meteorol. 2009, 15, 85–108. [Google Scholar]
  10. Carnesoltas, M.; Aguilar, G.; Naranjo, L. Condiciones sinópticas favorables para la aparición de tormentas locales severas en Cuba. Período lluvioso. Rev. Cuba. Meteorol. 2010, 16, 13–31. [Google Scholar]
  11. Carnesoltas, M. Tormentas locales severas. Tres condiciones necesarias. Rev. Cuba. Meteorol. 2019, 25, 90–97. [Google Scholar]
  12. Gutierrez, M.; Carnesoltas-Calvo, M.; Varela-de la Rosa, A. Factores físicos—Meteorológicos en los niveles medios troposféricos que determinan la ocurrencia de aeroavalanchas en Cuba. Rev. Cuba. Meteorol. 2020, 26, 1–15. [Google Scholar]
  13. Skamarock, W.; Klemp, J.; Dudhi, J.; Gill, D.; Barker, D.; Duda, M.; Huang, X.-Y.; Wang, W.; Powers, J. A Description of the Advanced Research WRF Version 3; Technical Report; University Corporation for Atmospheric Research: Boulder, CO, USA, 2008; p. 113. [Google Scholar] [CrossRef]
  14. Stull, R. Practical Meteorology: An Algebra-Based Survey of Atmospheric Science; Department of Earth, Ocean and Atmospheric Sciences, University of British Columbia: Vancouver, BC, Canada, 2015; 939p, ISBN1 978-0-88865-283-6. Available online: http://www.eos.ubc.ca/books/Practical_Meteorology/ (accessed on 20 November 2020)ISBN2 978-0-88865-283-6.
  15. Atkins, N.T.; Wakimoto, R. Wet microburst activity over the southeastern United States. Implications for forecasting weather. Forecasting 1991, 6, 470–482. [Google Scholar] [CrossRef] [Green Version]
Figure 1. Geographical distribution of the storms analyzed. Red dots represent storms that produced downbursts, and blue dots represent thunderstorms.
Environsciproc 08 00023 g001
Figure 2. Cross section of relative humidity in latitude from the numerical outputs of the WRF. (a) 27 April 2017 (DB) and (b) 30 April 2017 (TS).
Environsciproc 08 00023 g002
Figure 3. Equivalent potential temperature difference fields from the numerical outputs of the WRF. (a) 27 April 2017 (DB) and (b) 30 April 2017 (TS).
Environsciproc 08 00023 g003
Figure 4. Relationships between: (a) buoyancy and vertical speed; (b) horizontal advection of energy and vertical velocity.
Environsciproc 08 00023 g004
Table 1. WRF model configuration.
ParametersConfiguration
Spatial resolution27, 9, and 3 km
Number of points in x145, 262, 469
Number of points in y82, 130, 184
Vertical levels28, 28, 28
Domain center21.8° N and −79.74° W
Time step150 s
MicrophysicsWSM5, WSM5, Morrison double moment
CumulusGrell–Freitas, Grell–Freitas, not activated
PBLMellor–Yamada–Janjic, Mellor–Yamada–Janjic, Mellor–Yamada–Janjic
Table 2. Physical formulas of the different dynamic and thermodynamic variables used to calculate the possible discriminating factors.
VariableFormulaPossible Discriminating Factor
Latent heat Δ Q L = L · Δ m a Absorption of latent heat by evaporation and fusion
Equivalent potential temperature θ eq = θ + ( L v · θ C P · T ) Equivalent potential temperature difference (dry layer in the middle levels of the troposphere)
DCAPE DCAPE = g θ vp θ ve θ ve Dry layer in the middle levels of the troposphere
Buoyancy F M = θ ve θ vp T ve g = B Increased buoyancy in the updraft
Precipitable water d w = r T g · ρ l · ( P 1 P 2 ) Increased water load
Dynamic viscosity μ 0 T 0 + C T + C ( T T 0 ) 3 2 Decrease in viscosity
Kinematic viscosity ν = μ / ρ Decrease in viscosity
Coriolis vertical component A cz = 2 Ω u cos φ Coriolis vertical component with an eastern flow
Horizontal advection of energy Adv e ( ρ p · w 2 d 2 ) z Decrease in horizontal advection of energy
Horizontal advection of mass Adv m ρ p z Decrease in horizontal mass advection
Table 3. Possible critical values of the variables that can discriminate between the occurrence of DB and TS. Latent heat absorption by evaporation, latent heat absorption by fusion, the equivalent potential temperature difference between the level of maximum humidity in the low levels and minimum humidity in the middle levels, and buoyancy.
DateType∆QLE (J)∆QLF (J)∆θeq (K)B (m/s2)
27 April 2017DB47,766.236346.7214.730.1429
1 July 2017DB48,338.426435.0311.990.1572
20 July 2017DB41,797.155562.4112.190.1376
21 November 2017DB39,596.145269.8415.050.1133
14 May 2017DB32,799.184364.378.990.1345
30 April 2017TS12,749.921688.766.300.0456
3 July 2017TS30,537.164064.281.680.1002
18 July 2017TS27,030.773587.756.480.0828
23 November 2017TS24,607.773277.134.620.0869
13 May 2019TS21,510.582860.203.080.0785
Possible critical value 32,000420080.11
Table 4. Possible critical values of the variables that can discriminate between the occurrence of DB and TS. Energy advection, downdraft velocity, DCAPE.
DataTypeAdve (nm) (10−3J/s)wDCAPE (m/s)DCAPE (J/kg)
27 April 2017DB62.5048.624727.8
1 July 2017DB30.3444.653986.69
20 July 2017DB36.7736.332640.2
21 November 2017DB147.1934.522382.71
14 May 2017DB54.9636.182618.66
30 April 2017TS123.8630.221826.79
3 July 2017TS74.1733.192203.25
18 July 2017TS79.5935.972587.93
23 November 2017TS124.2827.821547.9
13 May 2019TS131.0934.472375.98
Possible critical value 70362600
Publisher’s Note: MDPI stays neutral with regard to jurisdictional claims in published maps and institutional affiliations.

