1. Introduction
Tropical cyclones (TCs) are low-pressure systems with a warm core that form over tropical and subtropical waters [
1]. TCs are one of the most destructive natural catastrophes in the world due to strong surface winds, tornadoes, storm surges, and heavy rainfall events [
2]. The destructive effect of TCs mostly depends on changes in its intensity and the trajectory followed by the TC during its lifetime [
3]. Therefore, accurate forecasting of a TC’s trajectory and intensity plays an important role in mitigating the impact of these atmospheric phenomena [
4].
TC track forecast errors have continuously decreased in the last decades; however, the same tendency has not been observed for the intensity forecast [
5]. This difference may be related to the complex interactions that lead to the intensification of TCs. TC intensity is not only governed by the interaction between the system and the environment that surrounds it but also depends on other non-linear factors inherent to the dynamics of the TCs, such as those occurring within or near the eye wall [
6]. Moreover, several factors that modulate TC intensity changes range from hundreds of kilometers, as the environmental shear, to tens of meters, as microphysics processes and turbulent flows within the atmospheric boundary layer. [
7].
In recent years, numerical prediction models have been widely implemented to provide high-resolution spatial and temporal TC forecasts [
4]. Since 1999, the trajectory forecasts have improved substantially, not only in the Global Forecast System (GFS) model but also in the Geophysical Fluid Dynamics Laboratory (GFDL) model [
8]. Combining the advancements of the GFDL and GFS models, the US National Centers for Environmental Prediction (NCEP)/Environmental Modeling Center (EMC) developed the Hurricane Weather Research and Forecast (HWRF) model to address the nation’s next-generation hurricane forecasting problems. The HWRF became operational in 2007 in the NCEP and has been constantly improved since then using annual updates to increase the forecast skill for all global basins [
9]. As part of the National Oceanic and Atmospheric Administration (NOAA) Hurricane Forecast Improvement Project (HFIP) [
10], the HWRF has advanced and evolved as one of the best models for tropical cyclone forecasting [
9]. Furthermore, since 2017, the Hurricanes in a Multi-scale Ocean-coupled Non-hydrostatic (HMON) model has been operational at the NCEP, which is an important step towards implementing a long-term strategy for multiple static and moving nests [
9].
However, both the HWRF and HMON models require high computing resources for their operational runs, which limits their use and implementation in research centers in low-income countries. In Cuba, for example, Pérez-Alarcón et al. [
11] developed the Numerical Tools for Hurricane Forecast (NTHF) system, which is based on the atmospheric component of the HWRF model and can be implemented using low computational power. NTHF has been operating during the North Atlantic basin TC season since 2019 in the Department of Meteorology of the Higher Institute of Technologies and Applied Sciences, University of Havana.
The main goal of this work is to assess the NTHF system’s skill in forecasting the intensity and trajectory of TCs during the 2020 North Atlantic season. In the next section, we provide a brief description of the NTHF system, especially the physics and computing domain configurations. The results are discussed in
Section 3 and conclusions are drawn in
Section 4.
2. Material and Methods
2.1. Brief Description of the NTHF System
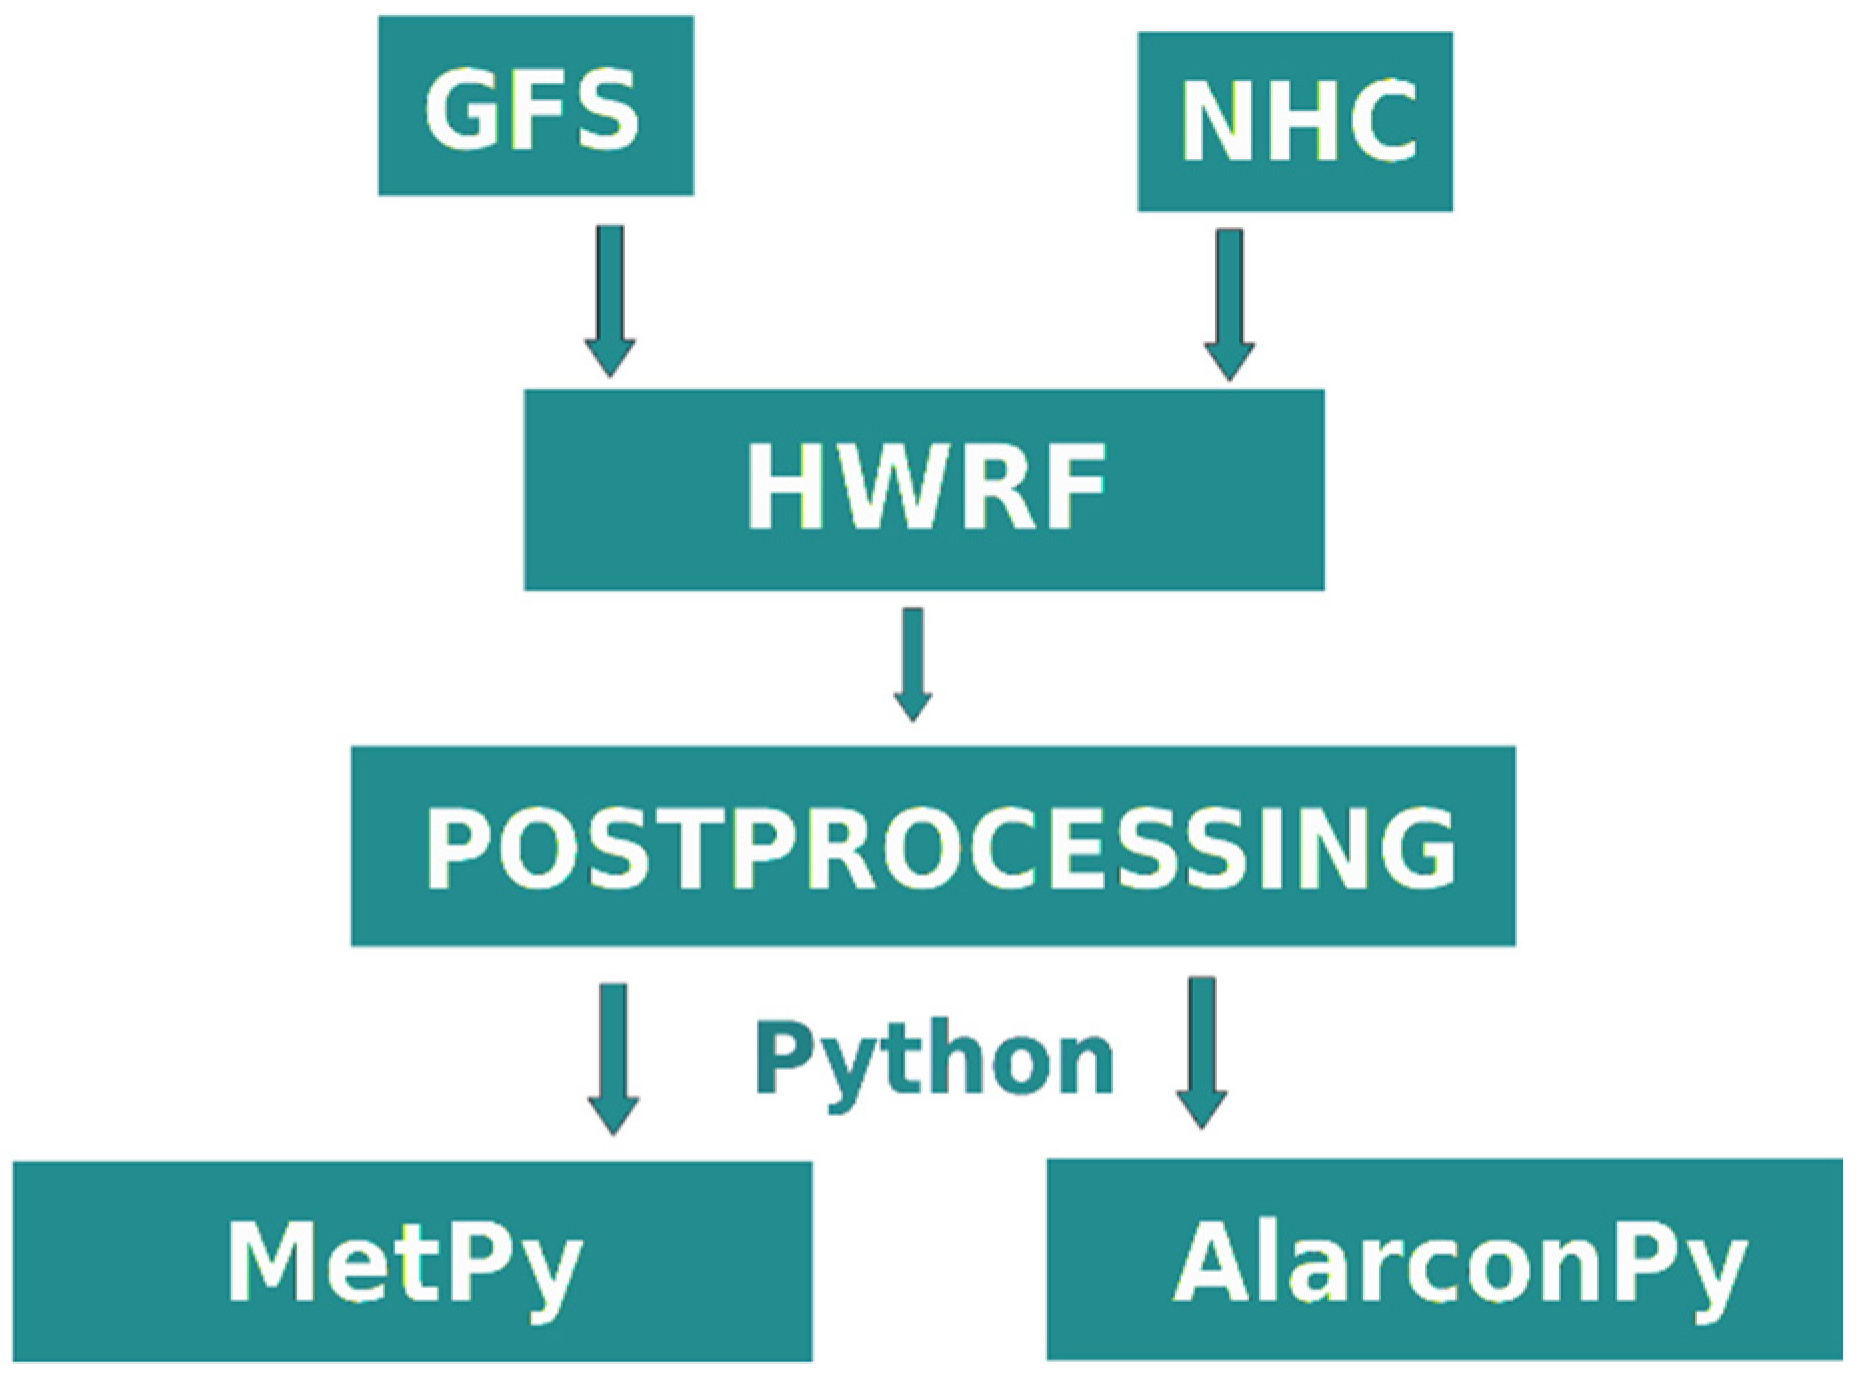
The NTHF system is based on the atmospheric component of the HWRF model as the dynamic core, following the recommendations of Pérez-Alarcón et al. [
11]. Furthermore, it is composed of computational algorithms that guarantee the initialization of the model during the operational runs, with the position of the storm provided by the NHC and the forecast outputs of the GFS model. Moreover, the NTHF system contains some post-processing Python scripts.
Figure 1 shows the block diagram of the NTHF system.
Furthermore, the NTHF uses two bidirectional interactive nested domains with 27 and 9 km of horizontal resolution and 32 vertical levels. The parent grid covers an approximately 72° × 72° area with 0.18 horizontal grid spacing, while the nested domain covers an 11° × 10° area with 0.06 grid spacing. It also uses a rotated latitude/longitude staggered Arakawa E-grid and has the possibility of moving meshes for vortex tracking [
11]. The NTHF is also skillful in forecasting the precipitation associated with TCs [
12]. The NTHF operational runs cover a 120 h forecast and are initialized at 0000 and 1200 UTC with the GFS outputs at 0.25º of spatial resolution (update for 2020 NATL TC season forecast), while the boundary conditions were updated every 6 h.
Table 1 shows the most important aspects of the physical configuration of the NTHF. The NTHF outputs are mainly processed using the Python packages Metpy [
13] and Alarconpy [
14].
2.2. Data
The 2020 North Atlantic TC season was the most active on record since 1851, with 30 named storms, of which 7 reached the hurricane category and 6 reached the major hurricane category (3+ on the Saffir–Simpson Hurricane Wind Scale).
During the 2020 NATL TC season, there were 247 NTHF forecasts, which is notably higher than the 82 long-term average (2016–2019) number of NTHF forecasts.
Table 2 summarizes the number of NTHF predictions analyzed in each forecast hour.
For verification, the operational NHC best track available on
https://ftp.nhc.noaa.gov/atcf/btk/, (accessed on 8 April 2021) was used. From this, the positions, maximum wind speeds, and minimum central pressures of each system were extracted. The Atlantic hurricane database (HURDAT2) [
15] with 2020 NATL TCs is not available yet. Furthermore, the official NHC forecast, the HWRF, and the HMON predictions were extracted from the Automated Tropical Cyclone Forecasting System (ATCF) files on
https://ftp.nhc.noaa.gov/atcf/aid_public/ (accessed on 8 April 2021).
2.3. Methodology
The NTHF provides output for the tropical cyclone’s position, its minimum central pressure, and its maximum simulated wind speed. To gain a more complete overview of the NTHF system’s performance, the NTHF forecast was statistically compared with the NHC official forecast and the prediction of the HWRF, the HMON, the Climatology and Persistence (CLIPER), and the Decay Statistical Hurricane Intensity Prediction Scheme (D-SHIPS) models for the same forecast hours and cases.
To evaluate the performance of the NTHF system in predicting the 2020 NATL TCs’ trajectory and intensity, a set of statigraphs was used: mean absolute error, bias, and forecasting skill. The latest statigraphs were widely applied by NHC for the official forecast verification and are defined as follow:
where
eb is the baseline error and
ef is the forecast error. The CLIPER and D-SHIPS errors were used as references to quantify the skill in the track and intensity forecasts, respectively.
3. Results and Discussion
3.1. Track Forecast Errors
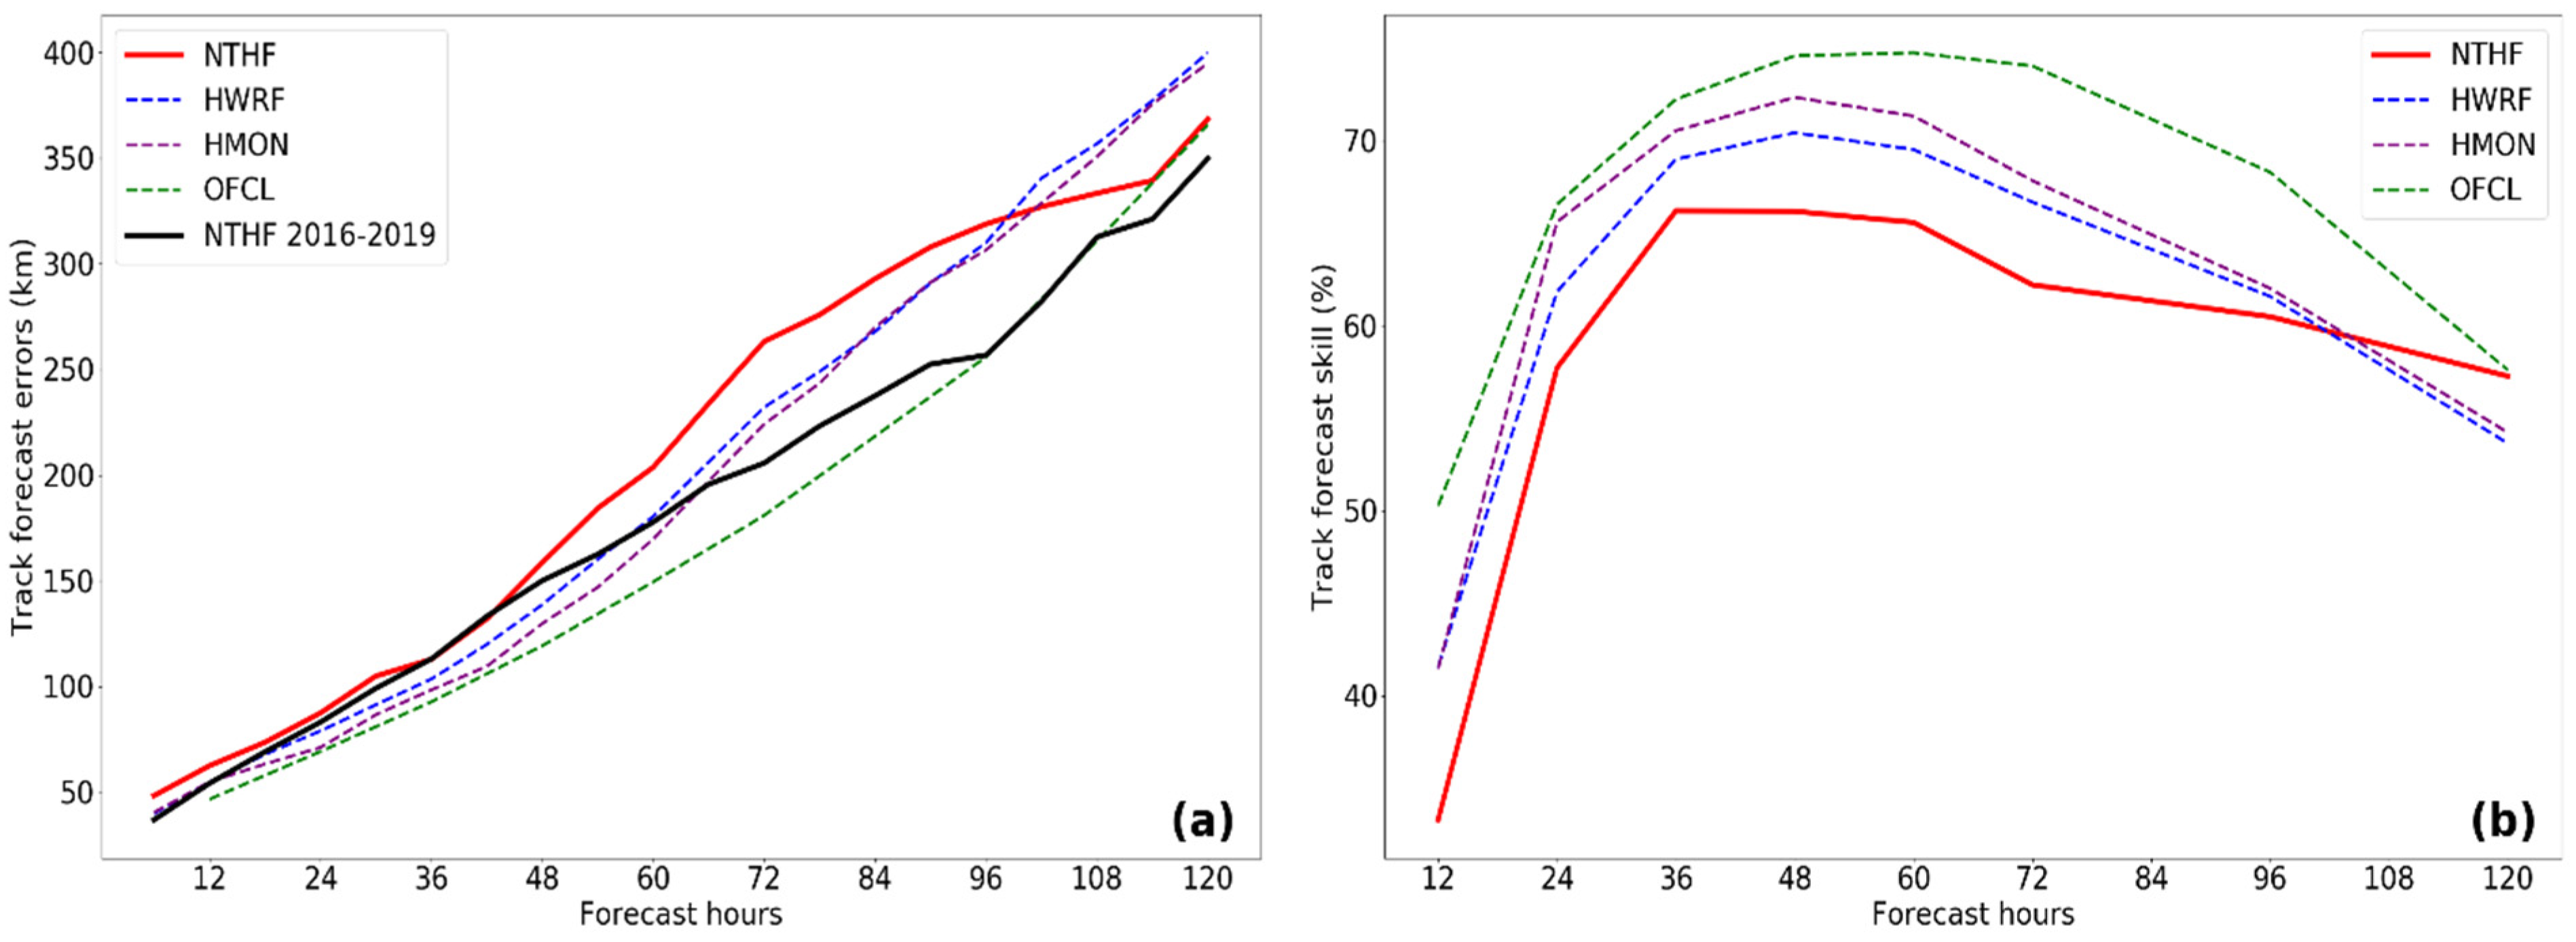
Track forecast errors, which are defined as the distance between the forecast storm center and the storm best track center, were conducted for all NTHF runs. During the 2020 NATL TC season, the NTHF track forecast errors ranged from 62 km at 12 h to 368 km at 120 h, as shown in
Figure 2a. For all forecast hours, the NTHF track forecasts are comparable at most lead times with the HWRF, the HMON, and the official NHC forecasts; however, it exhibits the highest error rate of all between 48 h and 96 h.
Moreover, the mean track forecast error rate of the NTHF is close to or higher than the NTHF average errors from 2016 to 2019 for almost all of the lead times throughout 120 h. On average, NTHF errors during the 2020 NATL TC season were 13% higher than the NTHF average for the previous four years (2016–2019). Furthermore,
Figure 2b reveals that the NTHF’s skill level for the track forecast was 40–60% over the CLIPER’s ability during all forecast hours, but the NTHF exhibited the worst performance of all models used as guidance.
This slight increase in the mean track forecast errors may be linked to the 190 (76%) initializations of the NTHF when TCs were tropical depressions or tropical storms. Previously, Pérez-Alarcón et al. [
11] pointed out that the largest track errors produced by the NTHF are observed in the trajectory forecasts of tropical depressions and tropical storms. At these stages, the vortex is generally weak, thus the vortex tracking algorithm (the GFDL vortex tracker) can track secondary vortices, which are not directly related to the TC center.
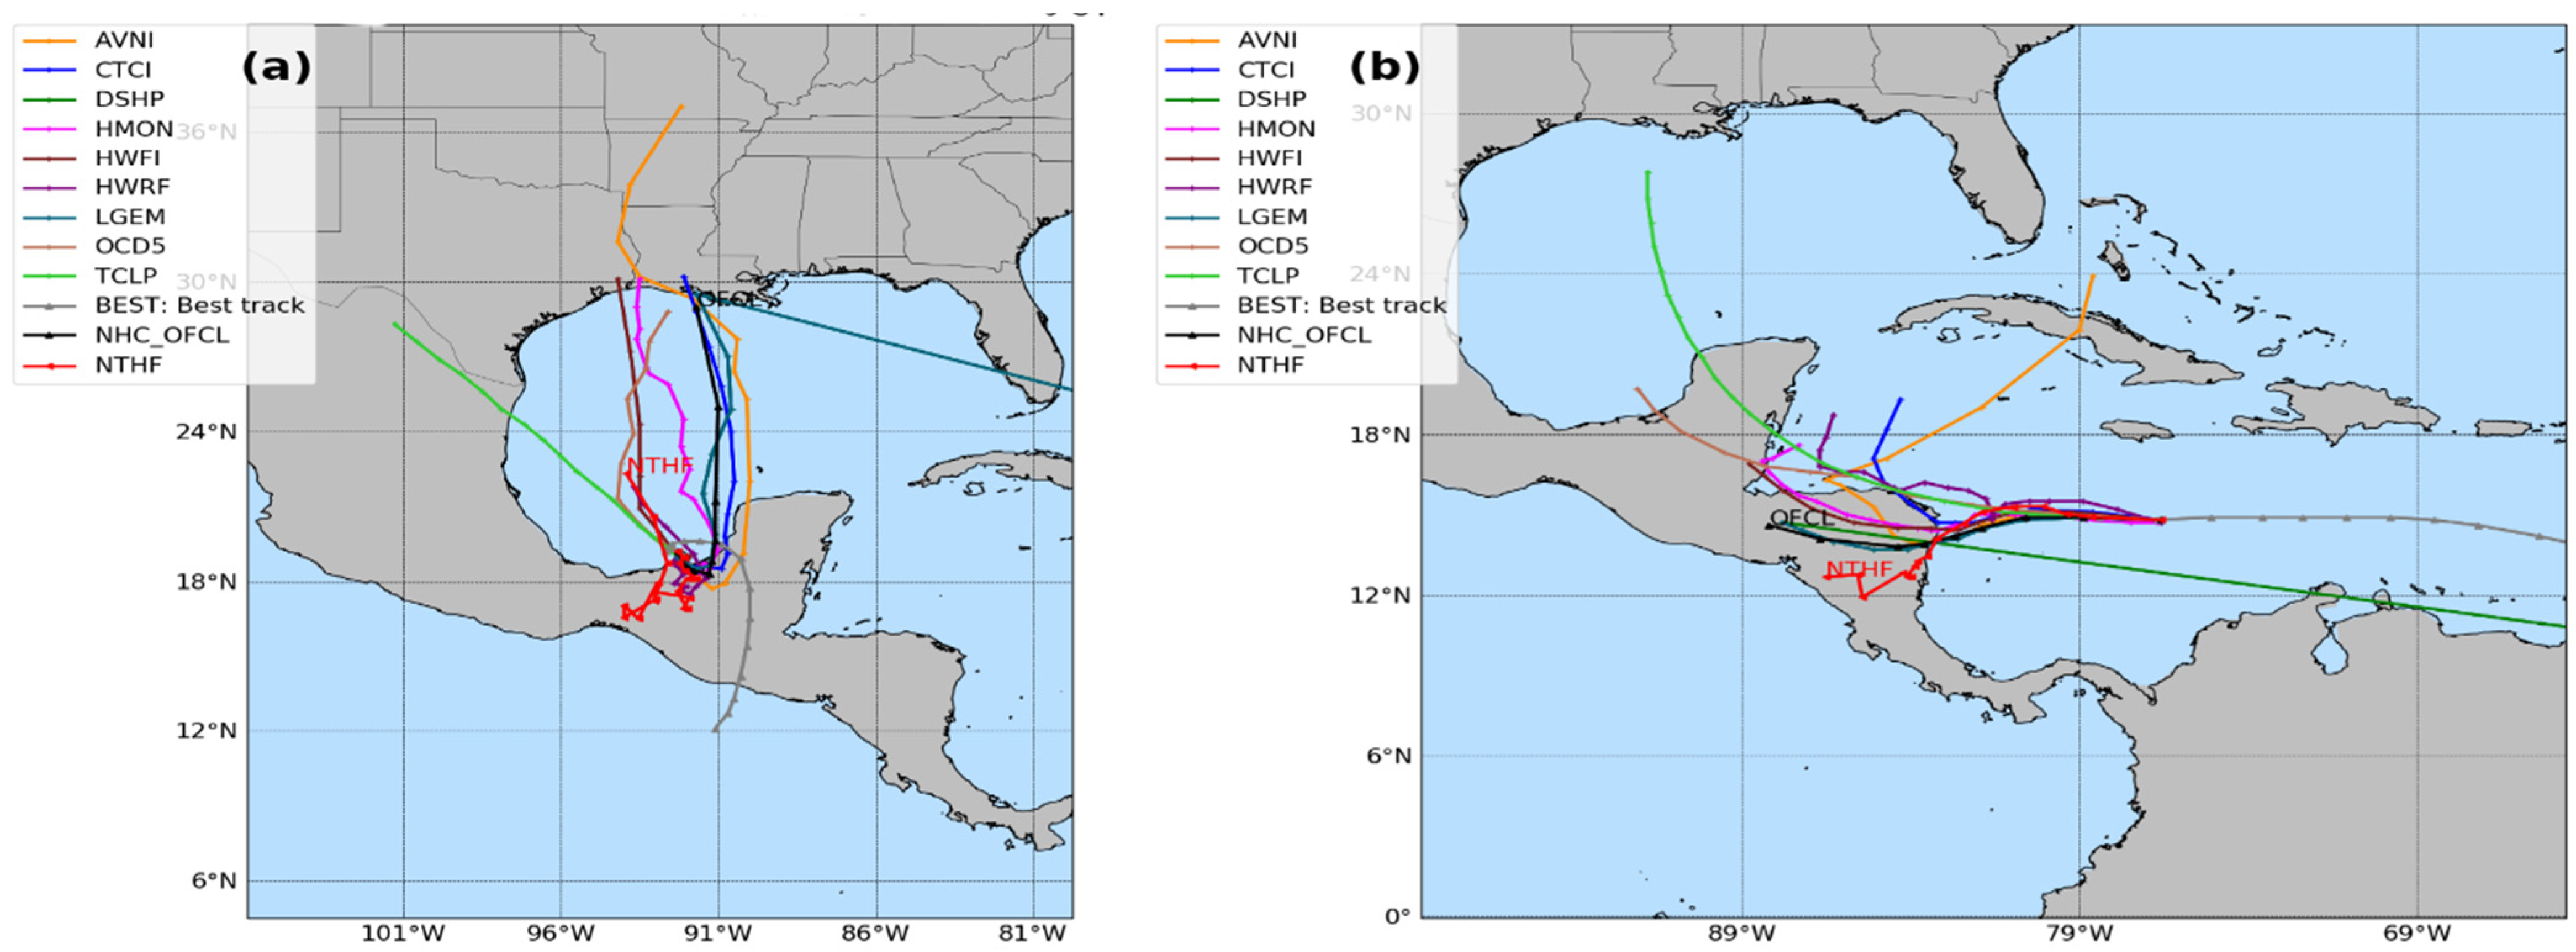
The NTHF track errors were also examined for every Atlantic basin TC individually for the 2020 TC season (not shown). It is remarkable that track errors and the NTHF’s ability vary considerably from one TC to another. The highest rates of track errors were found during the operational runs of tropical storm Cristobal and hurricane Eta. Both TCs had complex trajectories, as shown in
Figure 3, that affected the NTHF system’s skill.
Furthermore, the operational NTHF track guidance has generally remained inferior to global model track guidance [
11]. TC tracks are primarily determined by the large-scale environment, especially the large-scale wind fields [
16,
17]. Regarding the former issue, the operational NTHF has two important limitations: it is storm-centric and it has a small outermost domain.
3.2. Intensity Forecast Errors
The TCs’ intensity forecasts were verified against the operational NHC best-track data, as mentioned earlier.
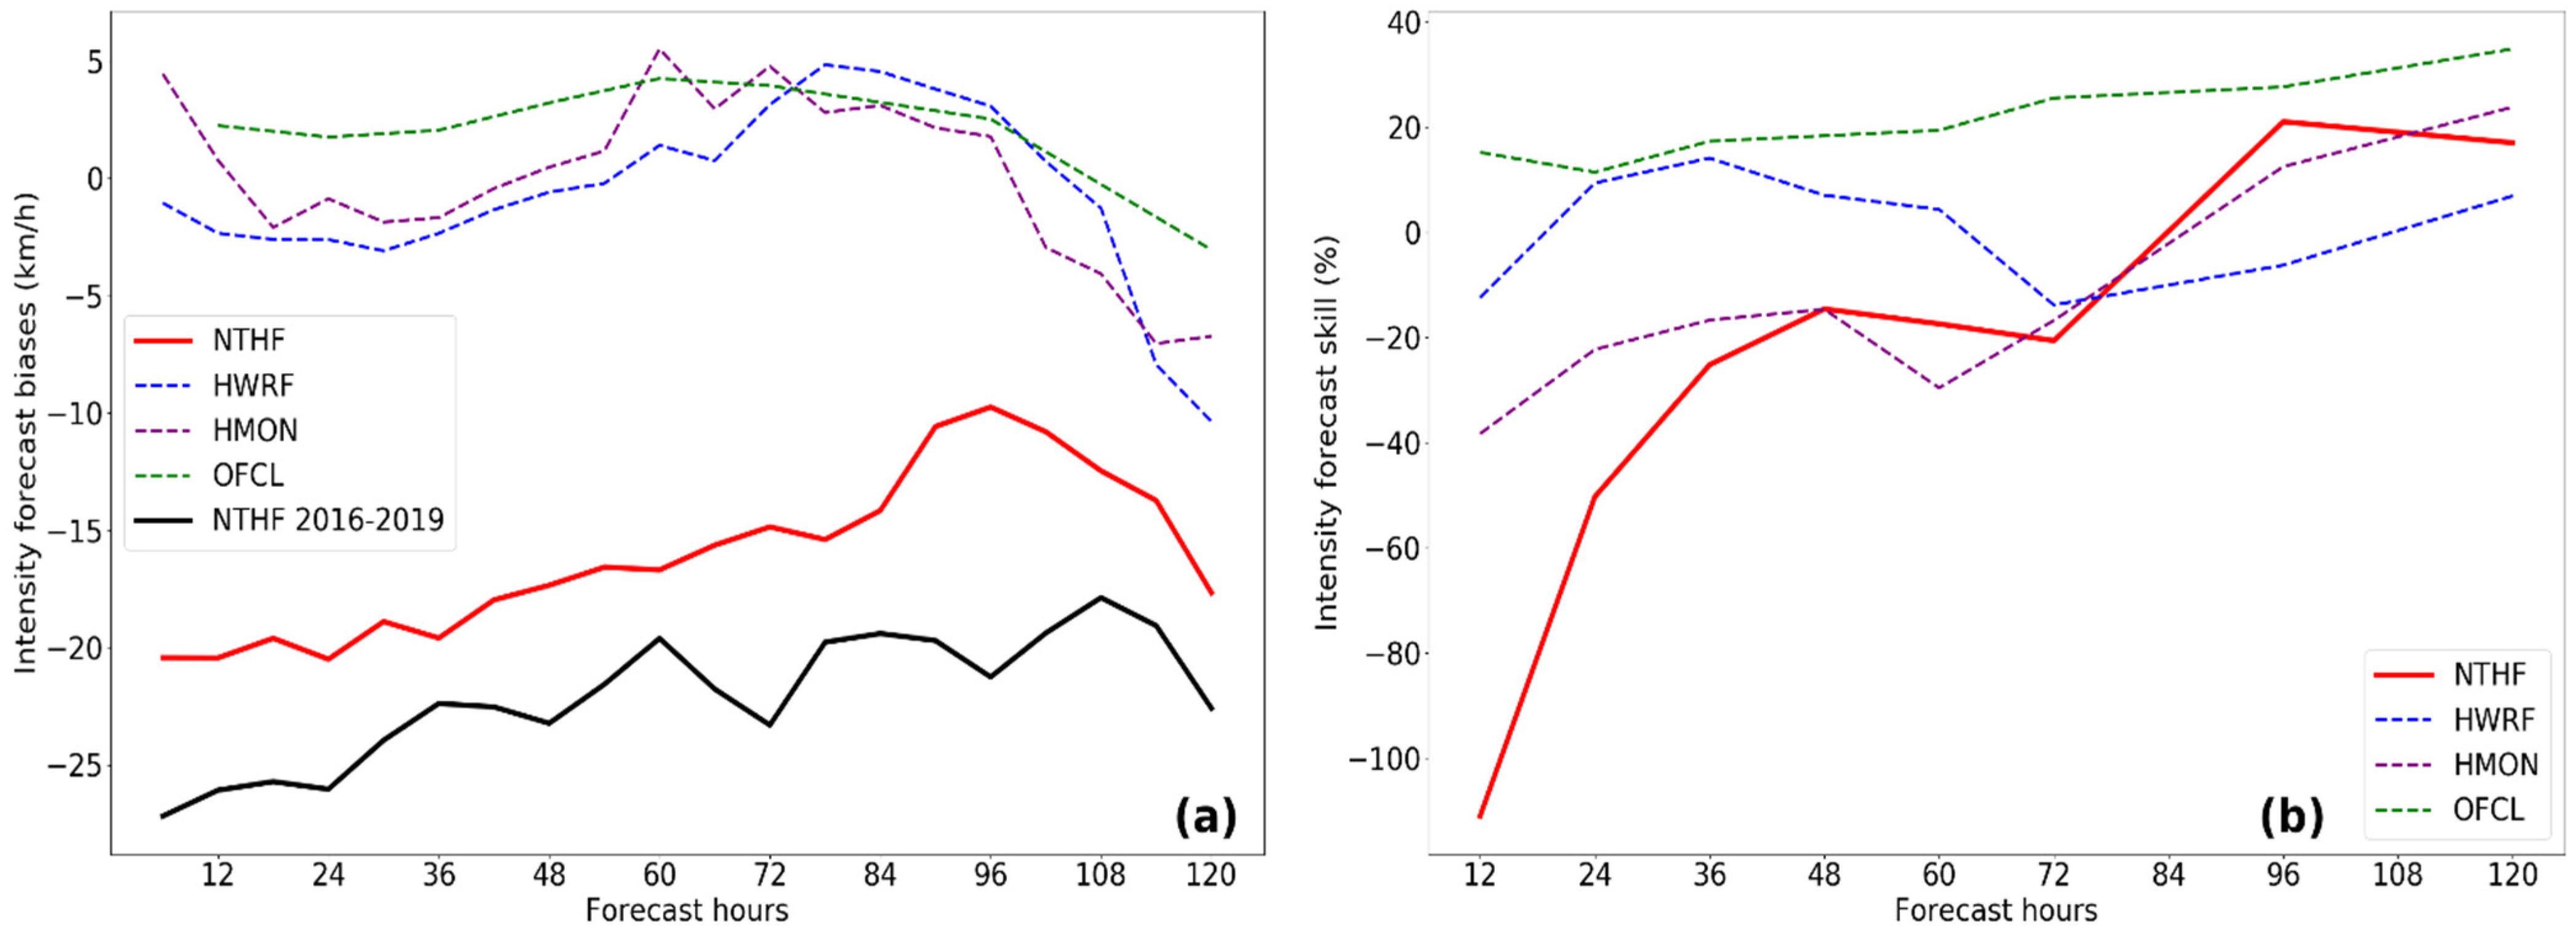
Figure 4 shows a comparison of the performance of the NTHF, the HWRF, and the HMON; the average NTHF from 2016–2019; and the official NHC forecast errors. From
Figure 3a, the NTHF underestimated the maximum wind speed of the 2020 NATL TCs by between 10 km/h and 20 km/h; however, its performance was notably higher than the NTHF average from 2016 to 2019. Nevertheless, the NTHF exhibits the worst performance of all. The wind velocity bias rate (
Figure 4a) suggests that the model predicts weaker storms. In agreement with Pérez-Alarcon et al. [
11], the largest errors were observed in the first 12–36 h, probably as a consequence of the non-vortex relocation during the model initialization and the time needed by the model to derive a physical valid state.
Overall, the average improvement is less than 20% over D-SHIPS from 78 h to 120 h, as reflected in the intensity forecast skill comparison in
Figure 4b. Further, after the 48 forecast hours, the NTHF system’s ability was similar to that of the HMON model, while it was better than the HWRF model after 72 h.
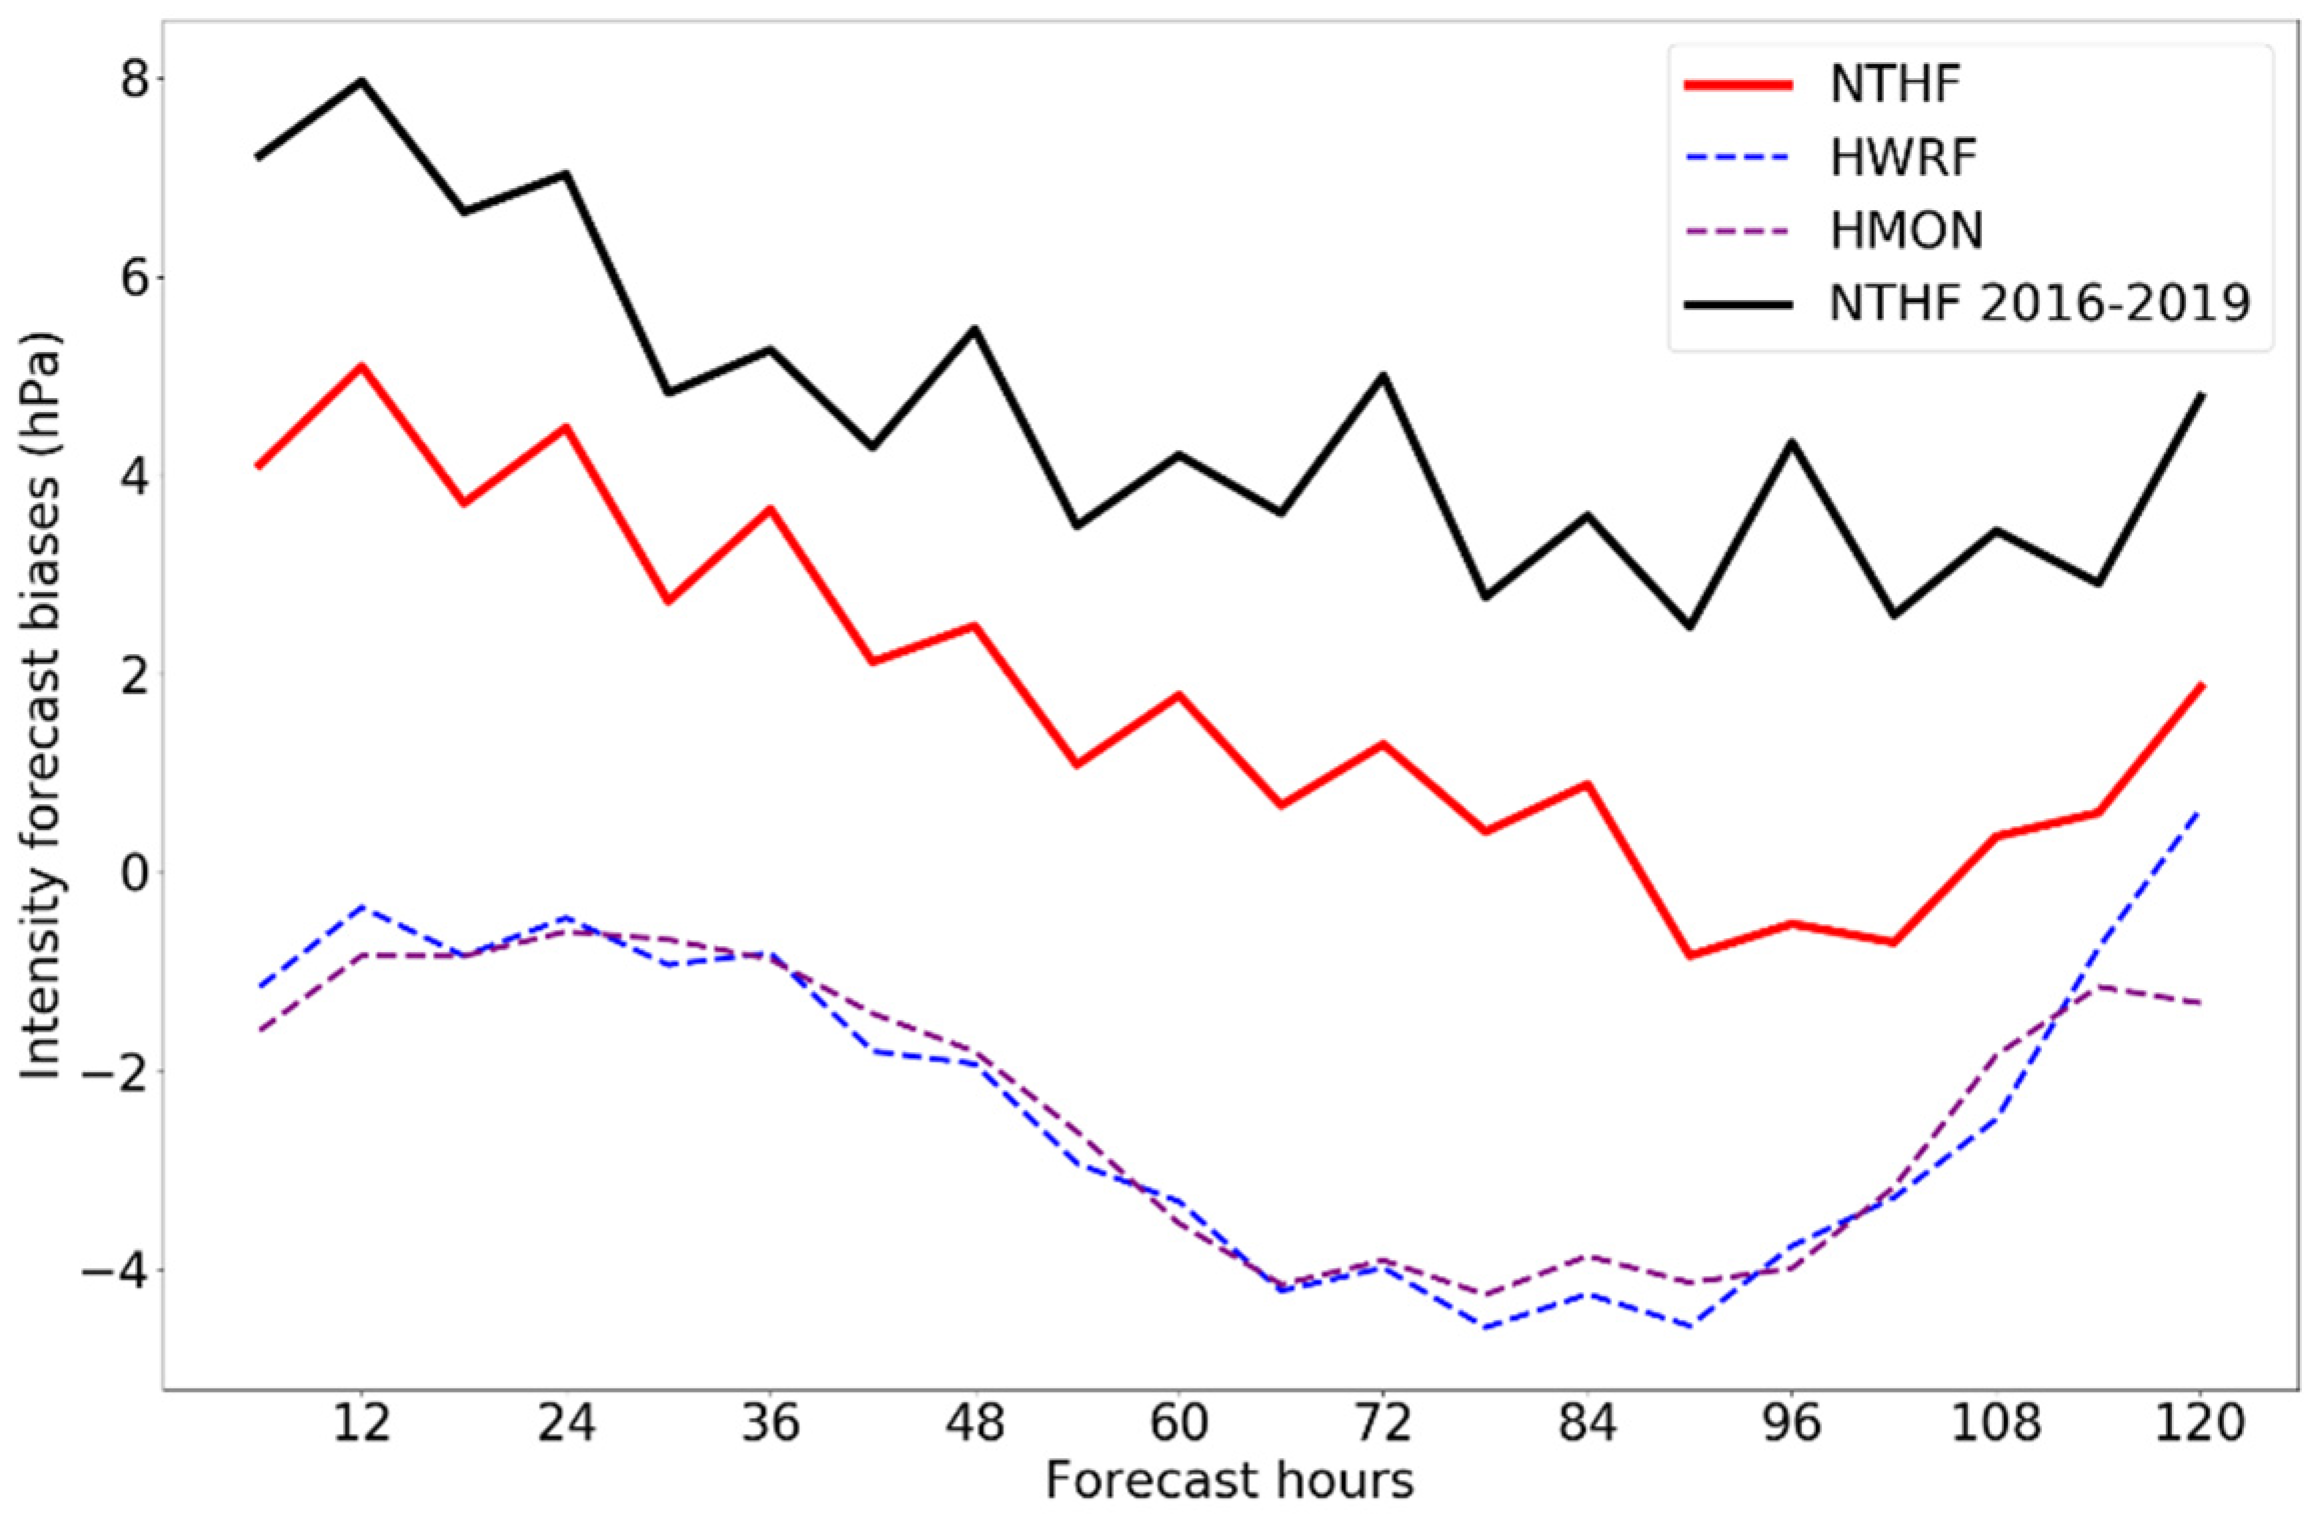
Results illustrated in
Figure 5 show that the NTHF overestimated the minimum central pressure during the 2020 NATL TC season, and for maximum wind speed, the NTHF predicted weaker TCs than those that actually occurred. The mean absolute error ranges from 4 hPa to 8 hPa along the 120 forecast hours. Furthermore, the NTHF was 36.7% higher than the average NTHF skill in the 2016–2019 period. Nevertheless, it is clear that the NTHF did not perform as well as the HWRF and the HMON in predicting the TCs’ minimum central pressure.
The NTHF improvements in the intensity forecast during the 2020 NATL TC season compared to the 2016–2019 average may be related to the increase in the spatial resolution of the input data (from 0.5° × 0.5° to 0.25° × 0.25° in latitude and longitude). The accuracy of the initial and boundary conditions plays an important role in the model’s skill in representing the TC trajectory and intensity changes [
17].
4. Conclusions
Accurate forecasting of the trajectory and intensity of tropical cyclones (TCs) plays an important role in mitigating the impact of these atmospheric phenomena. Recently, numerical prediction models have been widely implemented to provide special forecasts. The Numerical Tools for Hurricane Forecast system, based on the atmospheric component of the Hurricane Weather Research and Forecast, is one of the numerical TCs forecasting models. In this study, the NTHF system was evaluated for the 2020 North Atlantic tropical cyclones season.
Track forecast results from the NTHF exhibited mean track errors increasing linearly with time from 62 km at 12 h to 368 km at 120 h forecast time. Although the NTHF track forecast errors showed an improvement over 60% above the reference Climatology and Persistence (CLIPER) model from 36 h to 96 h, the NTHF system’s skill was 13% lower than the NTHF 2016–2019 average.
Furthermore, the NTHF system predicted, on average, a weaker TC than the one that occurred, but showed an improvement of 26.5% and 36.7% compared to the 2016–2019 average for the maximum wind speed and minimum central pressure forecasts, respectively. This improvement in the intensity forecast can be attributed to the increase in the spatial resolution of the input data. Nevertheless, the NTHF model intensity forecasts showed only marginal improvement (less than 20%) after 78 h over the baseline Decay Statistical Hurricane Intensity Prediction Scheme (D-SHIPS) model. The maximum wind speed (minimum central pressure) ranged between 20 km/h and 25 km/h (4 hPa to 8 hPa).
In future works, we will perform a more in-depth evaluation of the NTHF’s ability to forecast the trajectory and intensity of TCs classified by different categories in the Saffir–Simpson scale, as well as the rapid intensification changes. We are also expecting to conduct an evaluation of the NTHF system’s skill in determining rainfall patterns, average rainfall, rainfall volume, and extreme amounts of rain observed during the 2020 NATL TCs for those that were landfalling TCs or had moved very close to the coastline.
Author Contributions
A.P.-A. conceived the idea of the study; A.P.-A. and J.C.F.-A. processed the data and made the figures; A.P.-A. and A.J.B.-L. analyzed the results and wrote the manuscript. All authors analyzed the results and revised the final version of the manuscript.
Funding
This research received no external funding.
Institutional Review Board Statement
Not applicable.
Informed Consent Statement
Not applicable.
Data Availability Statement
The 6-hourly tropical cyclone tracking data supporting this article are based on publicly available operational best track from the National Hurricane Center at
https://ftp.nhc.noaa.gov/atcf/btk (accessed on 2 June 2021). The Automated Tropical Cyclone Forecasting System (ATCF) files were obtained from
https://ftp.nhc.noaa.gov/atcf/aid_public (accessed on 2 June 2021). The Global Forecast System (GFS) model outputs from NTHF operational runs were downloaded from
https://nomads.ncep.noaa.gov/pub/data/nccf/com/gfs/prod/ (accessed from May to November 2020). The NTHF outputs to reproduce our results are obtained upon request from the corresponding author.
Acknowledgments
The authors acknowledge the availability of public datasets from the National Hurricane Center and the Global Forecasting System.
Conflicts of Interest
The authors declare no conflict of interest.
References
- Roy, C.; Kovordányi, R. Tropical cyclone track forecasting techniques—A review. Atmos. Res. 2012, 104–105, 40–69. [Google Scholar] [CrossRef] [Green Version]
- Ankur, K.; Busireddy, N.K.R.; Osuri, K.K.; Niyogi, D. On the relationship between intensity changes and rainfall distribution in tropical cyclones over the North Indian Ocean. Int. J. Clim. 2020, 40, 2015–2025. [Google Scholar] [CrossRef]
- Ye, M.; Wu, J.; Liu, W.; He, X.; Wang, C. Dependence of tropical cyclone damage on maximum wind speed and socioeconomic factors. Environ. Res. Lett. 2020, 15, 094061. [Google Scholar] [CrossRef]
- Al-Yahyai, S.; Thani, A.A.; Al-Kaabi, N.; Al-Sudairi, K.; Al-Mawali, B.; Al Amri, I. Performance evaluation of HWRF model during post monsoon tropical cyclone Nilofar. Arab. J. Geosci. 2017, 10, 76. [Google Scholar] [CrossRef]
- Otkin, J.A.; Lewis, W.E.; Lenzen, A.J.; McNoldy, B.D.; Majumdar, S.J. Assessing the Accuracy of the Cloud and Water Vapor Fields in the Hurricane WRF (HWRF) Model Using Satellite Infrared Brightness Temperatures. Mon. Weather. Rev. 2017, 145, 2027–2046. [Google Scholar] [CrossRef]
- Tang, J.; Zhang, J.A.; Kieu, C.; Marks, F. Sensitivity of hurricane intensity and structure to two types of planetary boundary layer parameterization schemes in idealized HWRF simulations. Trop. Cyclone Res. Rev. 2018, 7, 1–11. [Google Scholar] [CrossRef]
- Gopalakrishnan, S.G.; Marks, F.; Zhang, X.; Bao, J.-W.; Yeh, K.-S.; Atlas, R. The Experimental HWRF System: A Study on the Influence of Horizontal Resolution on the Structure and Intensity Changes in Tropical Cyclones Using an Idealized Framework. Mon. Weather. Rev. 2011, 139, 1762–1784. [Google Scholar] [CrossRef]
- Liu, Q.; Lord, S.; Surgi, N.; Zhu, Y.; Wobus, R.; Toth, Z.; Marchok, T. Hurricane relocation in global ensemble forecast system. In Proceedings of the 27th Conference on Hurricanes and Tropical Meteorology, Monterey, CA, USA, 23–28 April 2006; pp. 5–13. [Google Scholar]
- Mehra, A.; Tallapragada, V.; Zhang, Z.; Liu, B.; Lin, S.; Wang, W.; Kimb, H.-S. Advancing the State of the Art in Operational Tropical Cyclone Forecasting at Ncep. Trop. Cyclone Res. Rev. 2018, 7, 51–56. [Google Scholar] [CrossRef]
- Gall, R.; Franklin, J.L.; Marks, F.; Rappaport, E.N.; Toepfer, F. The Hurricane Forecast Improvement Project. Bull. Am. Meteorol. Soc. 2013, 94, 329–343. [Google Scholar] [CrossRef]
- Pérez-Alarcón, A.; Fernández-Alvarez, J.C.; Rodírguez-Díaz, O.; Batista-Leyva, A.J.; Pérez-Suárez, R. System for numerical forecast of intensity and trajectory of tropical cyclones in the North Atlantic basin. Rev. Cub. Met. 2021, 27. Available online: https://eqrcode.co/a/43uSoj (accessed on 4 May 2021).
- Fernández-Alvarez, J.C.; Pérez-Alarcón, A.; Batista-Leyva, A.J.; Díaz-Rodríguez, O. Evaluation of Precipitation Forecast of System: Numerical Tools for Hurricane Forecast. Adv. Meteorol. 2020, 2020, 1–16. [Google Scholar] [CrossRef]
- May, R.; Arms, S.; Marsh, P.; Bruning, E.; Leeman, J. Metpy: A Python package for meteorological data. Unidata 2020. [Google Scholar] [CrossRef]
- Pérez-Alarcón, A.; Fernández-Alvarez, J.C. Alarconpy: A Python Package for Meteorologists. Zenodo 2021. [Google Scholar] [CrossRef]
- Landsea, C.W.; Franklin, J.L. Atlantic Hurricane Database Uncertainty and Presentation of a New Database Format. Mon. Weather Rev. 2013, 141, 3576–3592. [Google Scholar] [CrossRef]
- Franklin, J.L.; Feuer, S.E.; Kaplan, J.; Aberson, S. Tropical Cyclone Motion and Surrounding Flow Relationships: Searching for Beta Gyres in Omega Dropwindsonde Datasets. Mon. Weather. Rev. 1996, 124, 64–84. [Google Scholar] [CrossRef] [Green Version]
- Singh, K.S.; Mandal, M. Impact of Initial and Boundary Conditions on Mesoscale Simulation of Bay of Bengal Cyclones Using WRF-ARW Model. In High-Impact Weather Events over the SAARC Region; Ray, K., Mohapatra, M., Bandyopadhyay, B., Rathore, L., Eds.; Springer: Berlin/Heidelberg, Germany, 2015. [Google Scholar]
| Publisher’s Note: MDPI stays neutral with regard to jurisdictional claims in published maps and institutional affiliations. |
© 2021 by the authors. Licensee MDPI, Basel, Switzerland. This article is an open access article distributed under the terms and conditions of the Creative Commons Attribution (CC BY) license (https://creativecommons.org/licenses/by/4.0/).


