Proceeding Paper

Assessment of Polycyclic Aromatic Hydrocarbons (PAHs) in Sediment and Fish Samples of River Owan, and Agricultural Soil around the Same River in EDO State, Nigeria †

by
Akinyinka Akinnusotu
1,2,*,
Justina E. Ukpebor
2 and
Felix E. Okieimen
2
1
Department of Science Laboratory Technology, Rufus Giwa Polytechnic, Owo 341104, Nigeria
2
Department of Chemistry, University of Benin, Benin City 300213, Nigeria
*
Author to whom correspondence should be addressed.
Presented at the 5th International Electronic Conference on Water Sciences, 16–30 November 2020; Available online: https://ecws-5.sciforum.net/.
Environ. Sci. Proc. 2021, 7(1), 11; https://doi.org/10.3390/ECWS-5-08447
Published: 16 November 2020
(This article belongs to the Proceedings of 5th International Electronic Conference on Water Sciences)

Abstract

:
Polycyclic aromatic hydrocarbons (PAHs) belong to the group of persistent organic pollutants (POPs), which are major environmental pollutants associated with the environment. In this study (preliminary), the concentrations of eighteen (18) PAHs in soil, sediment, and fish sample (Clarias anguillaris) of Owan River and agricultural soil samples around the river in Edo State were studied using standard analytical methods. Gas chromatograph equipped with flame ionization detector (GC-FID) was used for the determination of PAHs. The study revealed the presence of the 18 determined PAHs in the soil, sediment, and fish (Clarias anguillaris) samples in varying concentrations. The concentrations of PAHs in the soil samples ranged between 0.0000–0.0463 (µg/kg) with total concentrations of ∑0.2390 (µg/kg) for soil sample 1 and 0.0000–0.0506 (µg/kg) with total concentration of ∑0.2700 (µg/kg) for the soil sample from location 2. The concentrations of the PAHs components in the sediments samples ranged between 0.00332–0.0319 (µg/kg) with total concentration of ∑0.150592 (µg/kg) for the sediment sample 1 and 0.002092–0.05866 (µg/kg) with total concentration of ∑0.0312183 (µg/kg) for the sediment sample 2. The concentration of PAHs components in the fish sample ranged between 0.0000–0.0746 (µg/kg) with total concentration of ∑0.300 (µg/kg). The concentrations of PAHs were higher in the soil samples than in the sediment samples. Concentrations of the PAHs residues detected in the fish samples were higher than those in the soil and sediment samples. In furtherance of this study, the number of sampling stations shall be increase to cover other communities while data generated will be subjected to more ecological risk assessments.

1. Introduction

Polycyclic aromatic hydrocarbons (PAHs) are persistent organic pollutants (POPs) that are toxic, distributed, and have a potential for bioaccumulation. PAHs consist of at least two fused benzene rings in different arrangements having only carbon and hydrogen atoms. There are several hundreds of PAHs, but only sixteen (16) PAHs are listed by the US Environmental Protection Agency and European commission as priority pollutants [1,2,3,4,5]. Most of them are formed by a process of thermal decomposition (pyrolysis) and subsequent recombination (pyrosynthesis) of organic molecules, e.g., acenaphthene, acenaphthylene, anthracene, benz(a)anthracene, and others [2,4,6].
PAHs are not easily degradable by microorganisms as a result of their stable aromatic ring structure. Hence, some of them are carcinogenic and mutagenic in nature. They are easily diffused and transported over long range distances [6,7,8,9]. They enter into the environment through various routes, including domestic and industrial effluents discharges, oil spillage, asphalt particles, atmospheric transport, vehicles exhaust, and so on. Soil and river sediments are the primary reservoir and sinks for PAHs in the terrestrial environment, because they are readily absorbed by organic matter [10,11,12,13,14,15]. Their accumulation in agricultural soil, sediment, and biota may lead to contamination of food chains, which could cause a potential risk to human health due to their potential to bio-accumulate and persist in the environment. PAHs have been of scientific interest for many years [2,7,16,17,18].
Regarding persistent organic pollutants (POPs), much research has focused on characterizing their concentrations and health effects during the past decade using various environmental risk assessments [2,7,9,15,16,19]. Various samples analyzed varied from water, soil, sediment, and fish samples from various regions ranging from riverine areas, polluted soil, oil spillage sites, industrial sites, agricultural sites, and so on [1,7,9,15,19,20,21,22,23,24]. Developed and developing countries have being paying much attention as a result of the adverse effects they pose to the ecosystem, animals, and human health. Major data gaps exist as far as its sources and concentrations in developing countries are concerned [1,7,20,24]. Since there are no scientific report on PAHs in the various matrixes of River Owan and its environs, the aim of this study is to fill this gap by carrying out this preliminary study to determine the concentrations of PAHs in soil, sediment, and fish samples from River Owan in Edo State, Nigeria.

2. Materials and Methods
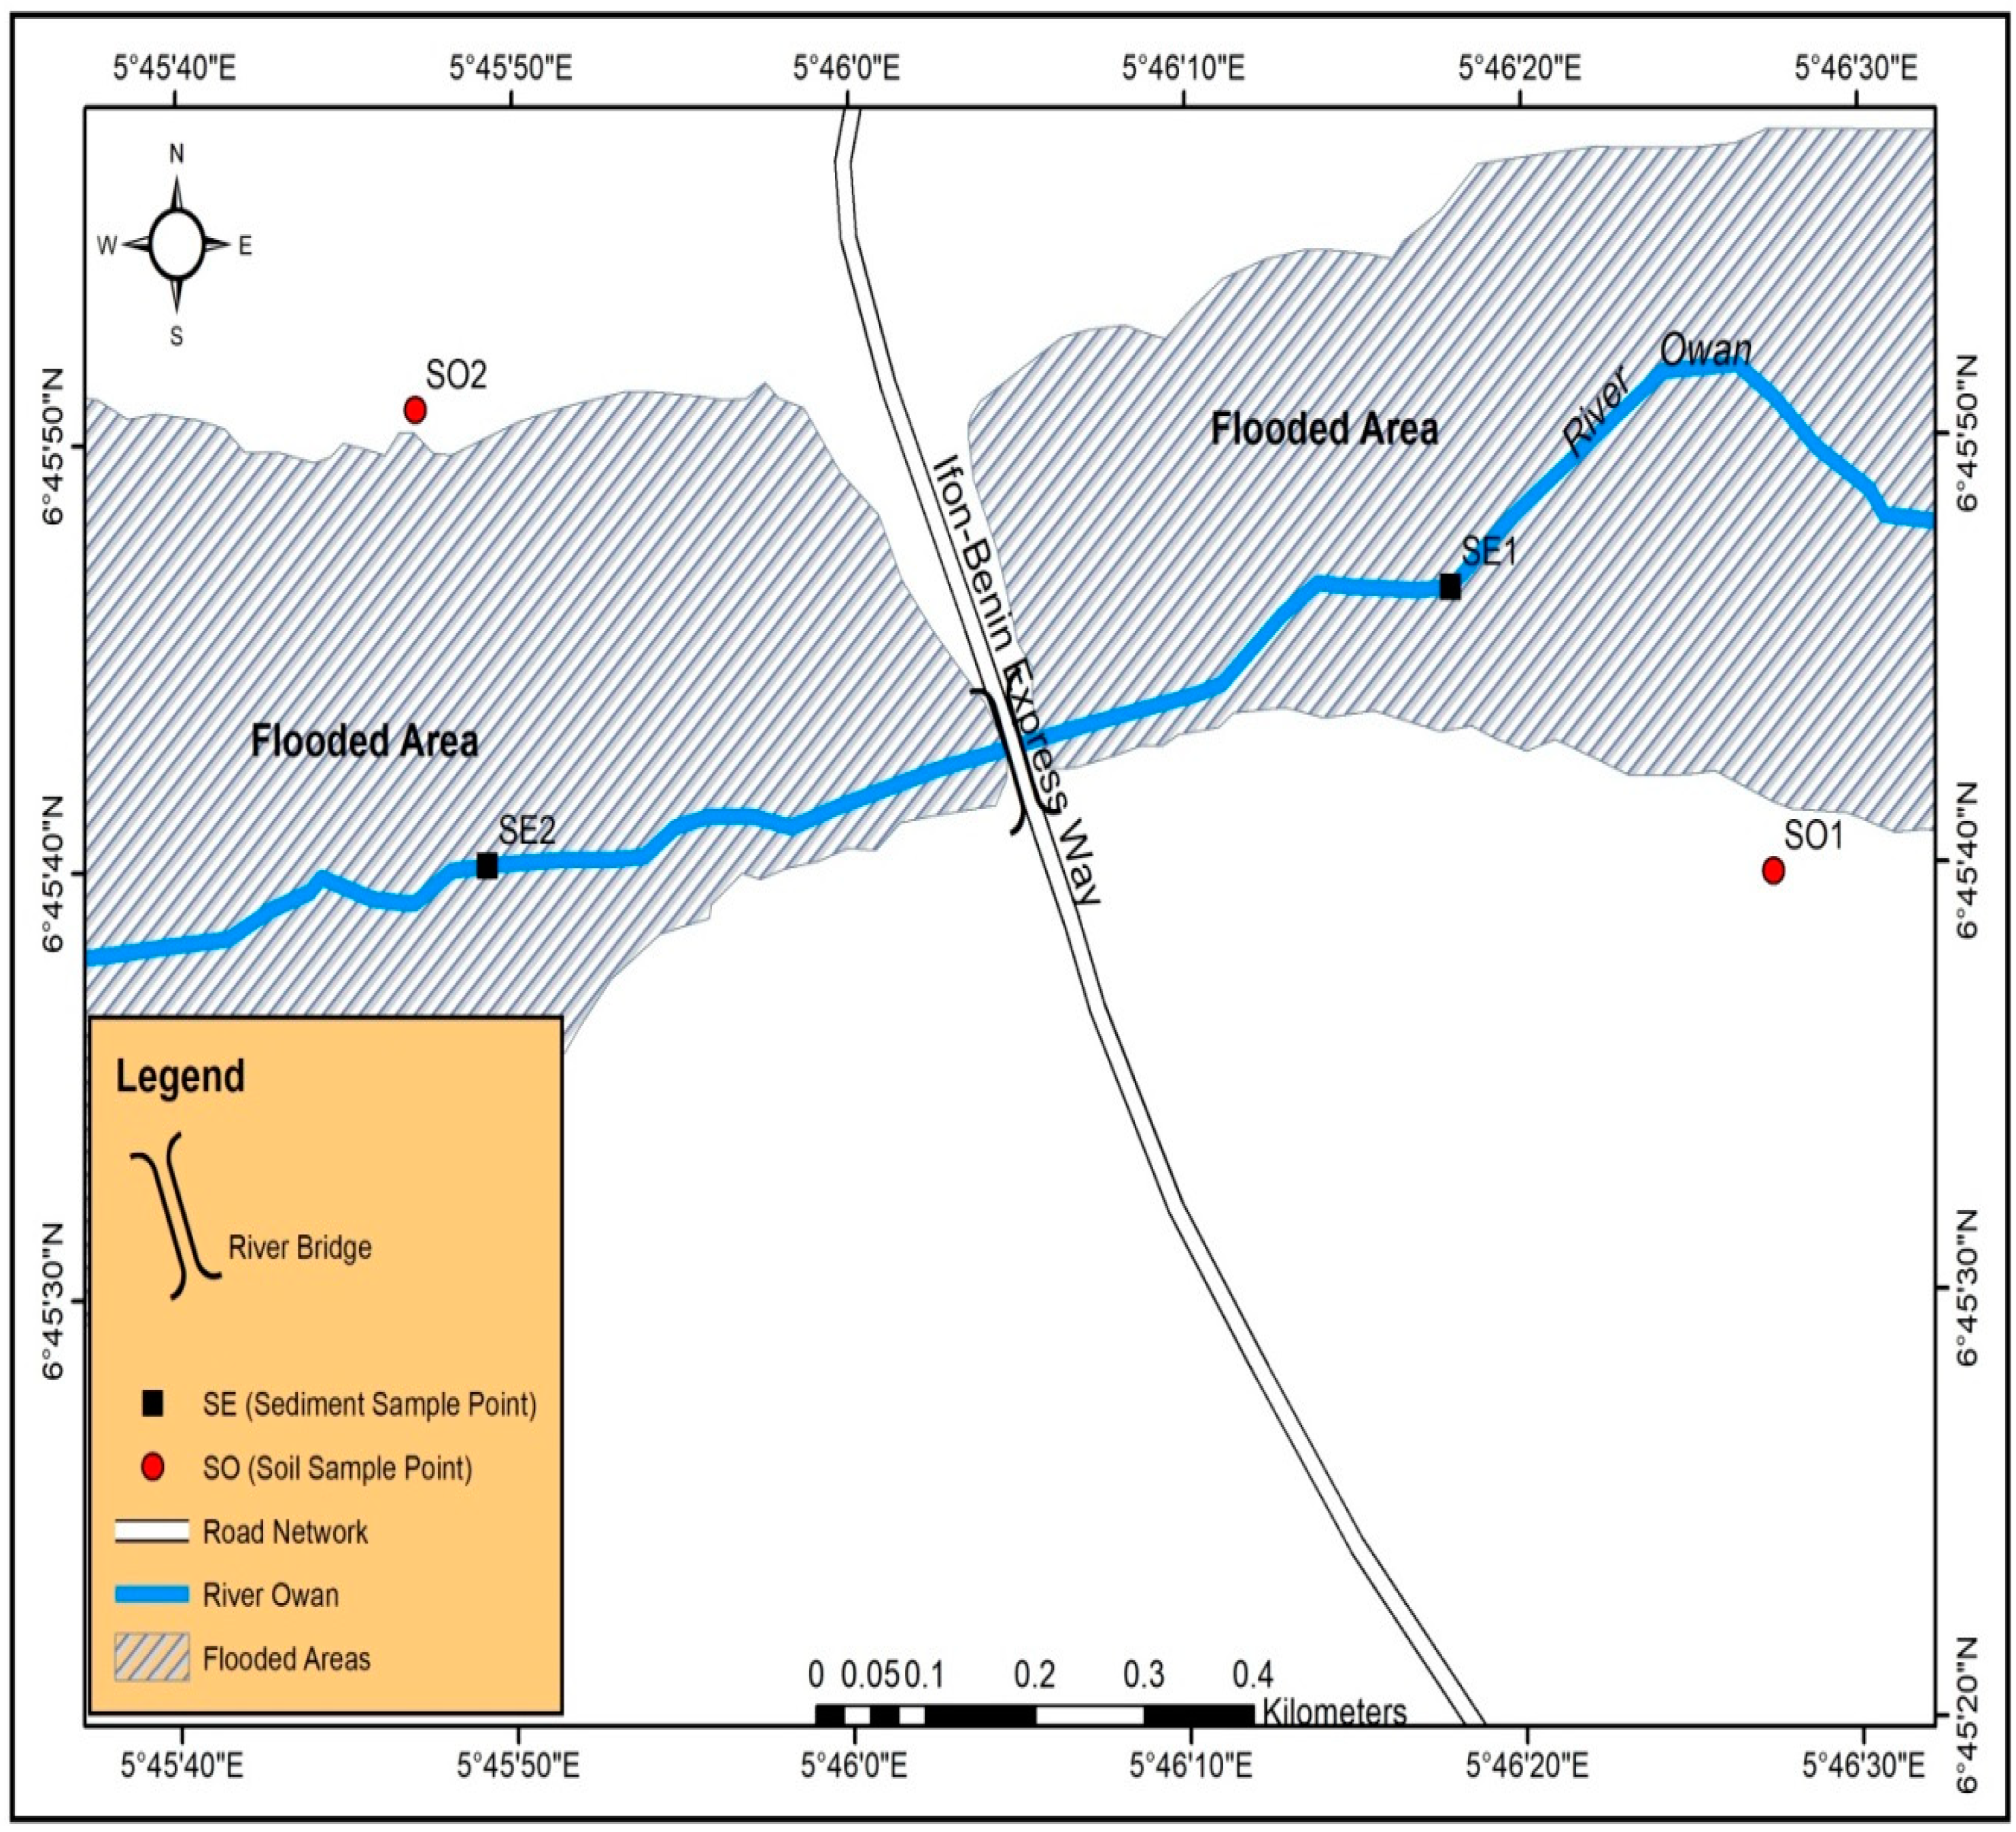
2.1. The Study Area

River Owan is one of the rivers in Edo State, Nigeria and lies within latitudes 5°30′ N, 6°30′ N and longitudes 7°30′ E, 7°30′ E, respectively (Figure 1). The climate in this area is tropical with two main seasons: wet (April–October) and dry (November–March) seasons.
The river serves the communities around it for various activities: fishing, washing, transportation, cooking, bathing, swimming, and drinking. Various domestic wastes are usually dumped into the river by the residents of these communities. The river runs through Okpokhumi and Sabongidda and empties into the River Ose. This region is notable for its intensive agricultural activities (cash and food crops), and construction and washing zones of automobiles (repairs and maintenance of canoe and speed boats engines) are other anthropogenic activities along the river banks [25].

2.2. Sampling and Sampling Stations

2.2.1. Soil

Two soil samples were collected from agricultural farm sites around the river using two sampling stations (Figure 1). These stations were established based on ecological settings, vegetation, and human activities in the area. Stainless steel soil auger was used for the collection at a depth of 0–30 cm. Sampling stations were geo-referenced using Garmin’s GPSMAP 76S. The two soil samples were coded SO1 (downstream soil sample) and SO2 (upstream soil sample). Soils samples were placed in cleaned 1 L glass jars with a Teflon-lined screw cap, stored in an ice-chest at 4 °C and transported to the laboratory.

2.2.2. Sediment

Two sediment samples were collected at two sampling stations with the aid of a grab sampler in a 1 L clean glass jar with screw cap, stored in an ice-chest at 4 °C, and transported to the laboratory. The two sediment samples were coded SE1 (downstream sediment sample) and SE2 (upstream sediment sample).

2.2.3. Fish

A Clarias anguillaris (cat fish) sample was collected from the river using a hook trap, kept in a labeled glass jar, stored in a chest cooler at 4 °C, and transported to the laboratory. The fish sample was identified by an aqua culturist at the Department of Fishery and Aquaculture, Rufus Giwa Polytechnic, Owo, Ondo State, Nigeria. Clarias anguillaris is mainly a bottom feeder and depends largely on detritus and can therefore take up pollutants [26,27].

2.2.4. Sampling Period

Sampling was carried out in the month of February, 2019 (during the dry season).

2.3. Sample Treatment and Preparation for Soil and Sediment

The standard reference method employed in the PAH analysis was US EPA 8240. Soil and sediment samples were air-dried at room temperature in the laboratory, grounded using a porcelain mortar and pestle (previously washed and cleaned with hexane), and sieved using a laboratory 2 mm sieve.
Ten grams (10 g) of sample was carefully weighed into a dried organic free and chromic acid pre-cleaned extraction bottle. Ten grams (10 g) of anhydrous sodium sulphate was added and mixed with a glass rod. A mixture of twenty millilitres (20 mL) of hexane and dichloromethane in the ratio 3:1 (90 mL of hexane and 30 mL of dichloromethane were prepared in a standard flask) was added to the sample. The sample was placed in an organic flask shaker at 500 osc/min for 30 min.
The extract was filtered. The sample was then left in the extraction bottle at laboratory room temperature to concentrate for a minimum of 24 h until about 2 mL of concentrated sample was left in the extraction bottle. This was followed by fractionation in activated alumina (neutral) column to separate into aliphatic and aromatic fractions using n-Hexane and Dichloromethane, respectively. The aromatic fraction was concentrated to approximately 1.0 mL using a rotary evaporator. The aromatic extract was stored in a dried organic free and chromic acid pre-cleaned glass vials with Teflon rubber caps for analysis. It was refrigerated at −4 °C until analysis.

2.4. Sample Analysis

Analysis of PAHs was performed using Agilent 7890A Gas Chromatography GC equipped with a flame ionization detector (Agilent Technologies, Santa Clara, CA, USA). A total of 1 µL of the concentrated sample was injected by means of exmire micro syringe through rubber septum into the column. The gas chromatography GC was set at the optimum temperature, 1.00 µL of the prepared calibration concentrate extract injected, and the GC run as normal. PAH quantification was carried out by CLARITY-GC interfaced software.
Separation occurs as the vapor constituent partition between the gas and liquid phases.

2.5. Gas Chromatograph Calibration

The calibration was performed with Sigma-Aldrich Chemical (Darmstadt, Germany) available PAH Accu Standards. The standard contains the 18 PAHs and was prepared as directed by the manufacturer.

2.6. Gas Chromatograph Analysis Conditions

The initial oven temperature was 45 °C, which was determined by the ambient temperature of the laboratory. The hold time for the 45 °C was 2 min. The gradient rate was 15 °C/min; the temperature was allowed to rise to 240 °C, and the injector temperature for samples was 280 °C. After samples were injected, the temperature rose at a gradient rate of 10 °C/min and ended at 300 °C, which is the higher maximum operating temperature indicated on the column box or supplier specification, and 8.17 min was the hold time employed. The detector temperature was 340 °C. Helium was the carrier gas. Other gases: combustion gas—hydrogen and compressed air, coolant—carbon (iv) oxide. Pressure program (set point): 14.0 psi. Injected volume: 1.00 µ.

2.7. Sample Treatment and Preparation for the Fish Sample

Standard analytical procedure for PAHs, as described by US EPA [28] was used. The frozen fish sample was homogenized using a warring blender (previously washed and cleaned with hexane), and 100 mL of acetone was added. The sample was homogenized for 20 min at 100 rpm and mixed further with 5 g of anhydrous sodium sulphate. Extraction was performed using a mixture of dichloromethane and n-hexane as a solvent in a soxhlet extraction apparatus for about 5 h. The resulting solvent was eluted with 50 mL n-hexane solvent, evaporated again until 1–2 mL.

2.8. Quality Control

The GC after start-up was flushed with air to clear the column and prepare for fresh analysis. Samples analyzed were accompanied with a quality control (QC) sample and a solvent blank. Standards of 0.1 and 0.5 ppm were chosen for the low and high ranges as quality control standards. Chemicals and reagents were of high grade purity: acetone (99.8%), dichloromethane (99.5%), n-hexane (99.8%), and acetonitrile, cyclohexane, sodium chloride, and anhydrous sodium sulphate were of high purity (99%).

2.9. Statistical Analysis

A Microsoft Excel package was used for the analysis of data obtained and to generate various charts.

3. Result and Discussion

Results of the PAHs are presented using the stacked area charts and detail as seen in Appendix A.

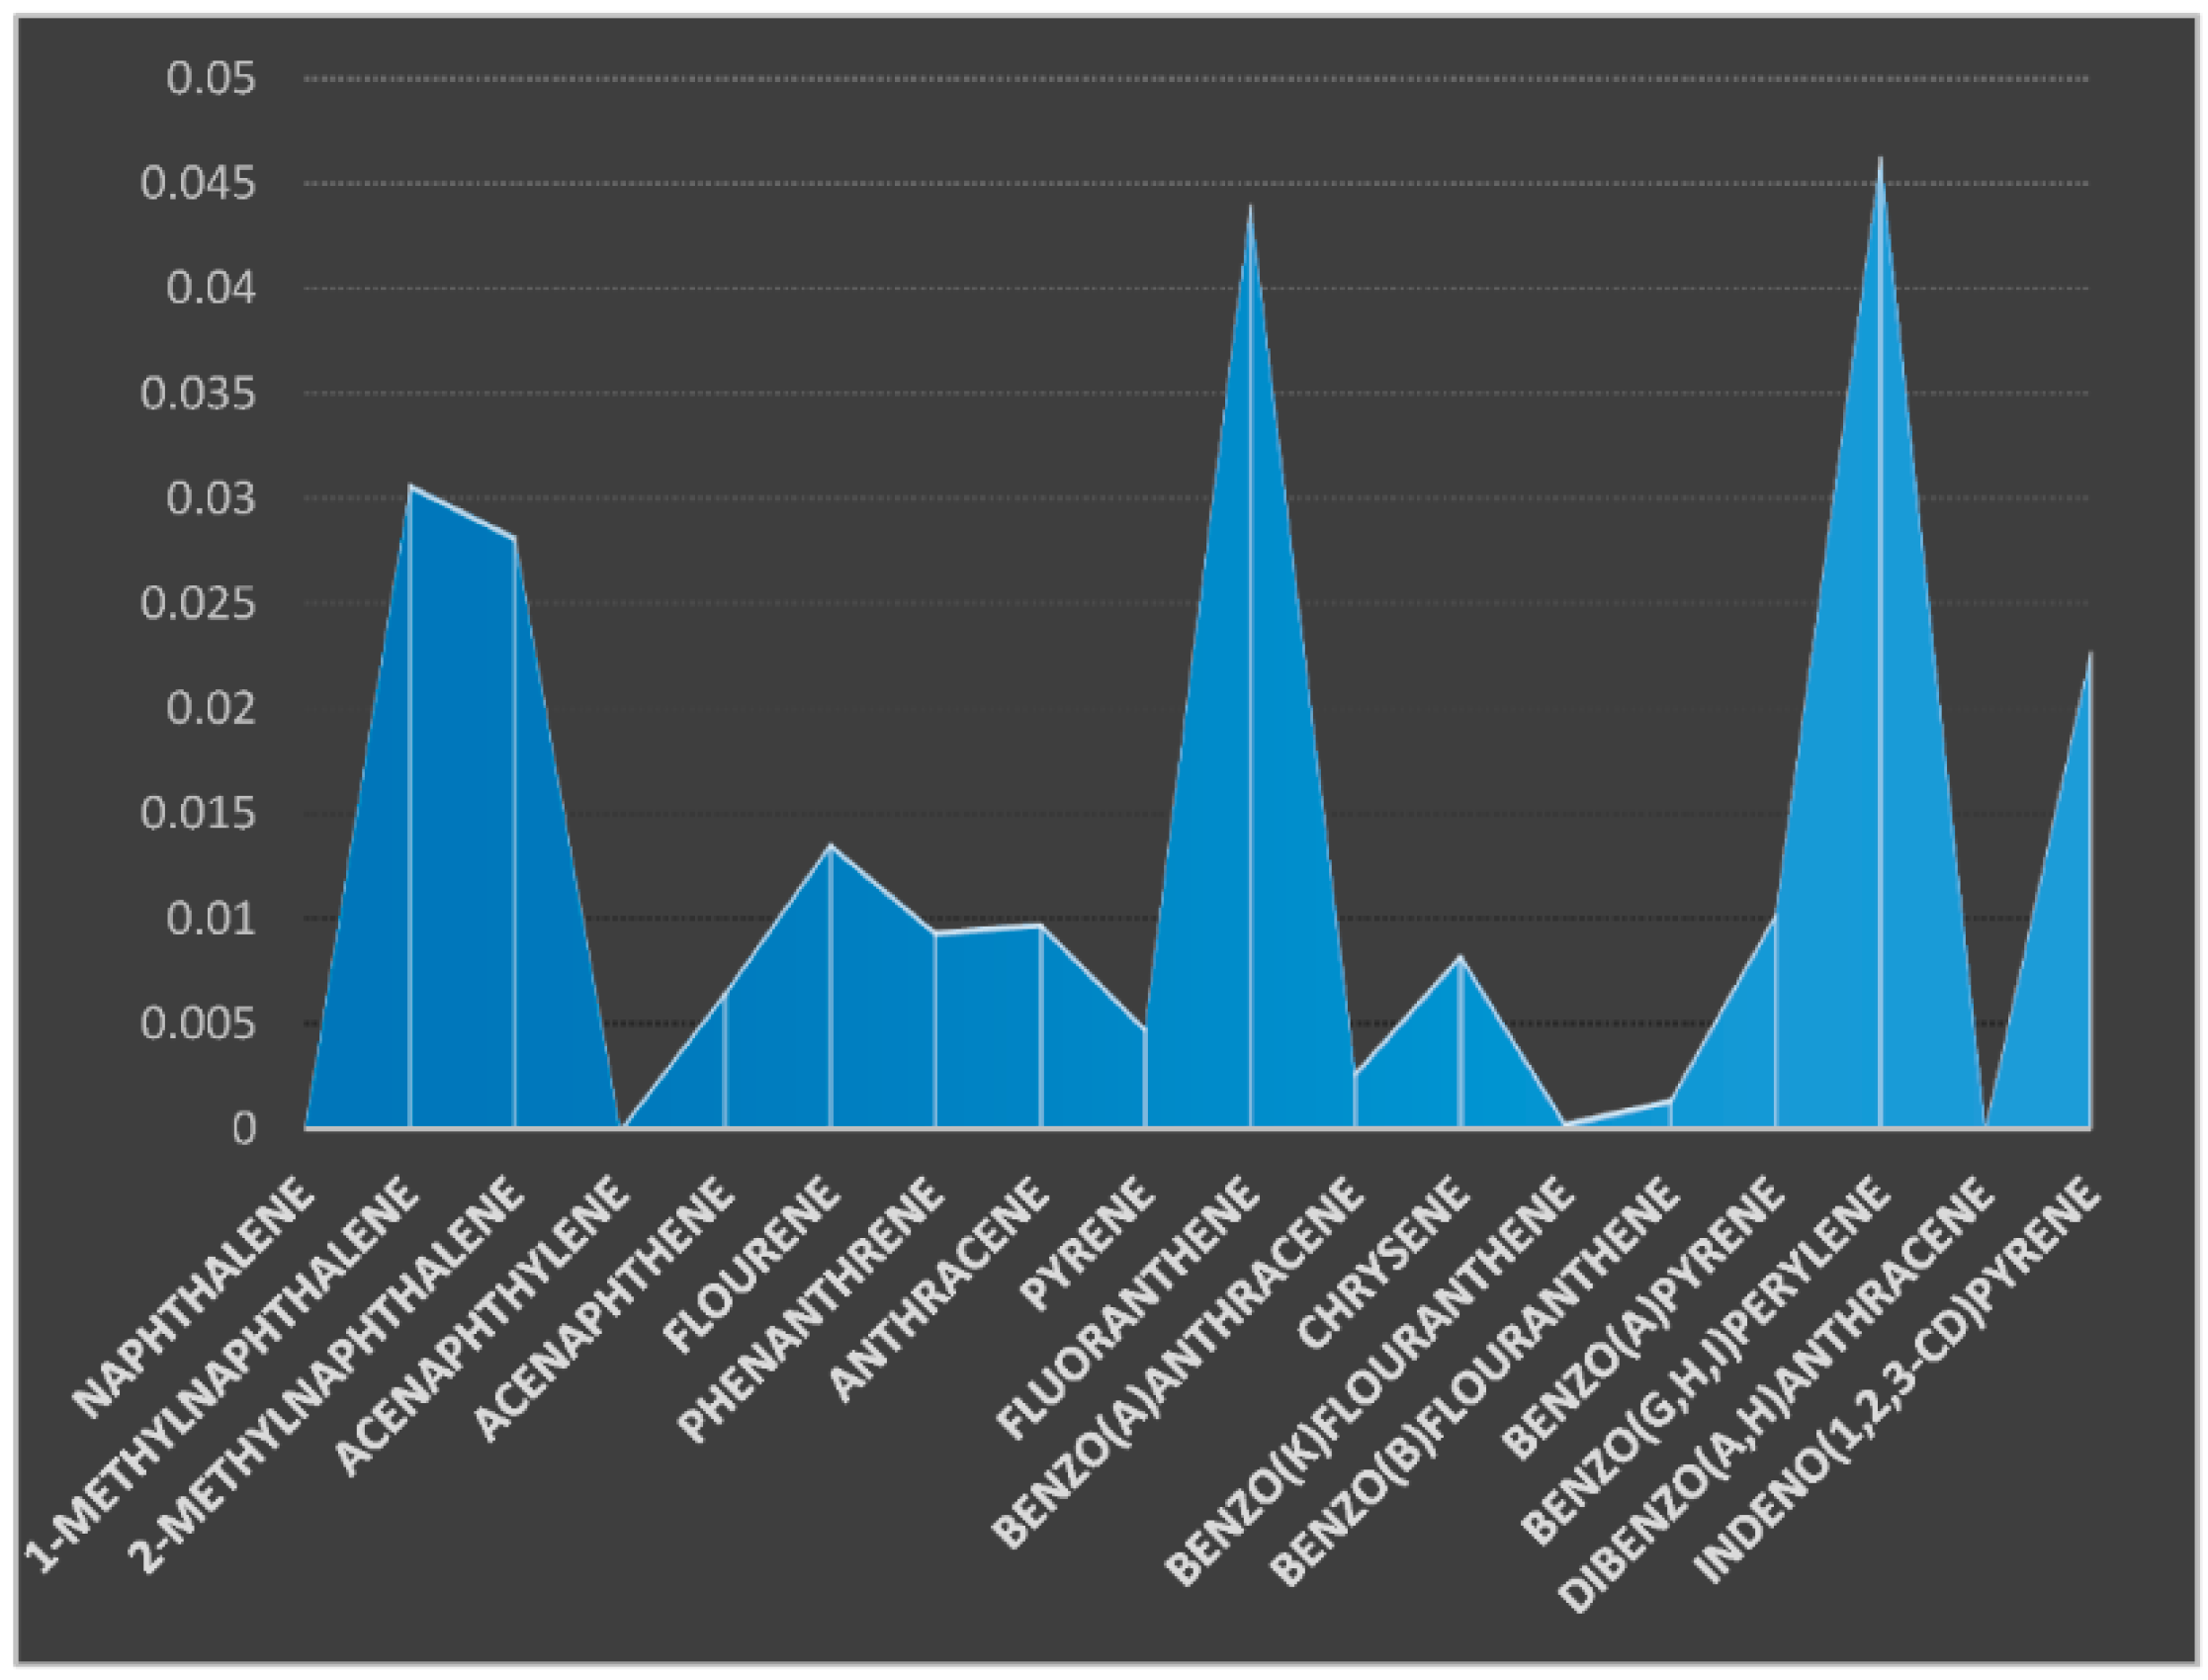
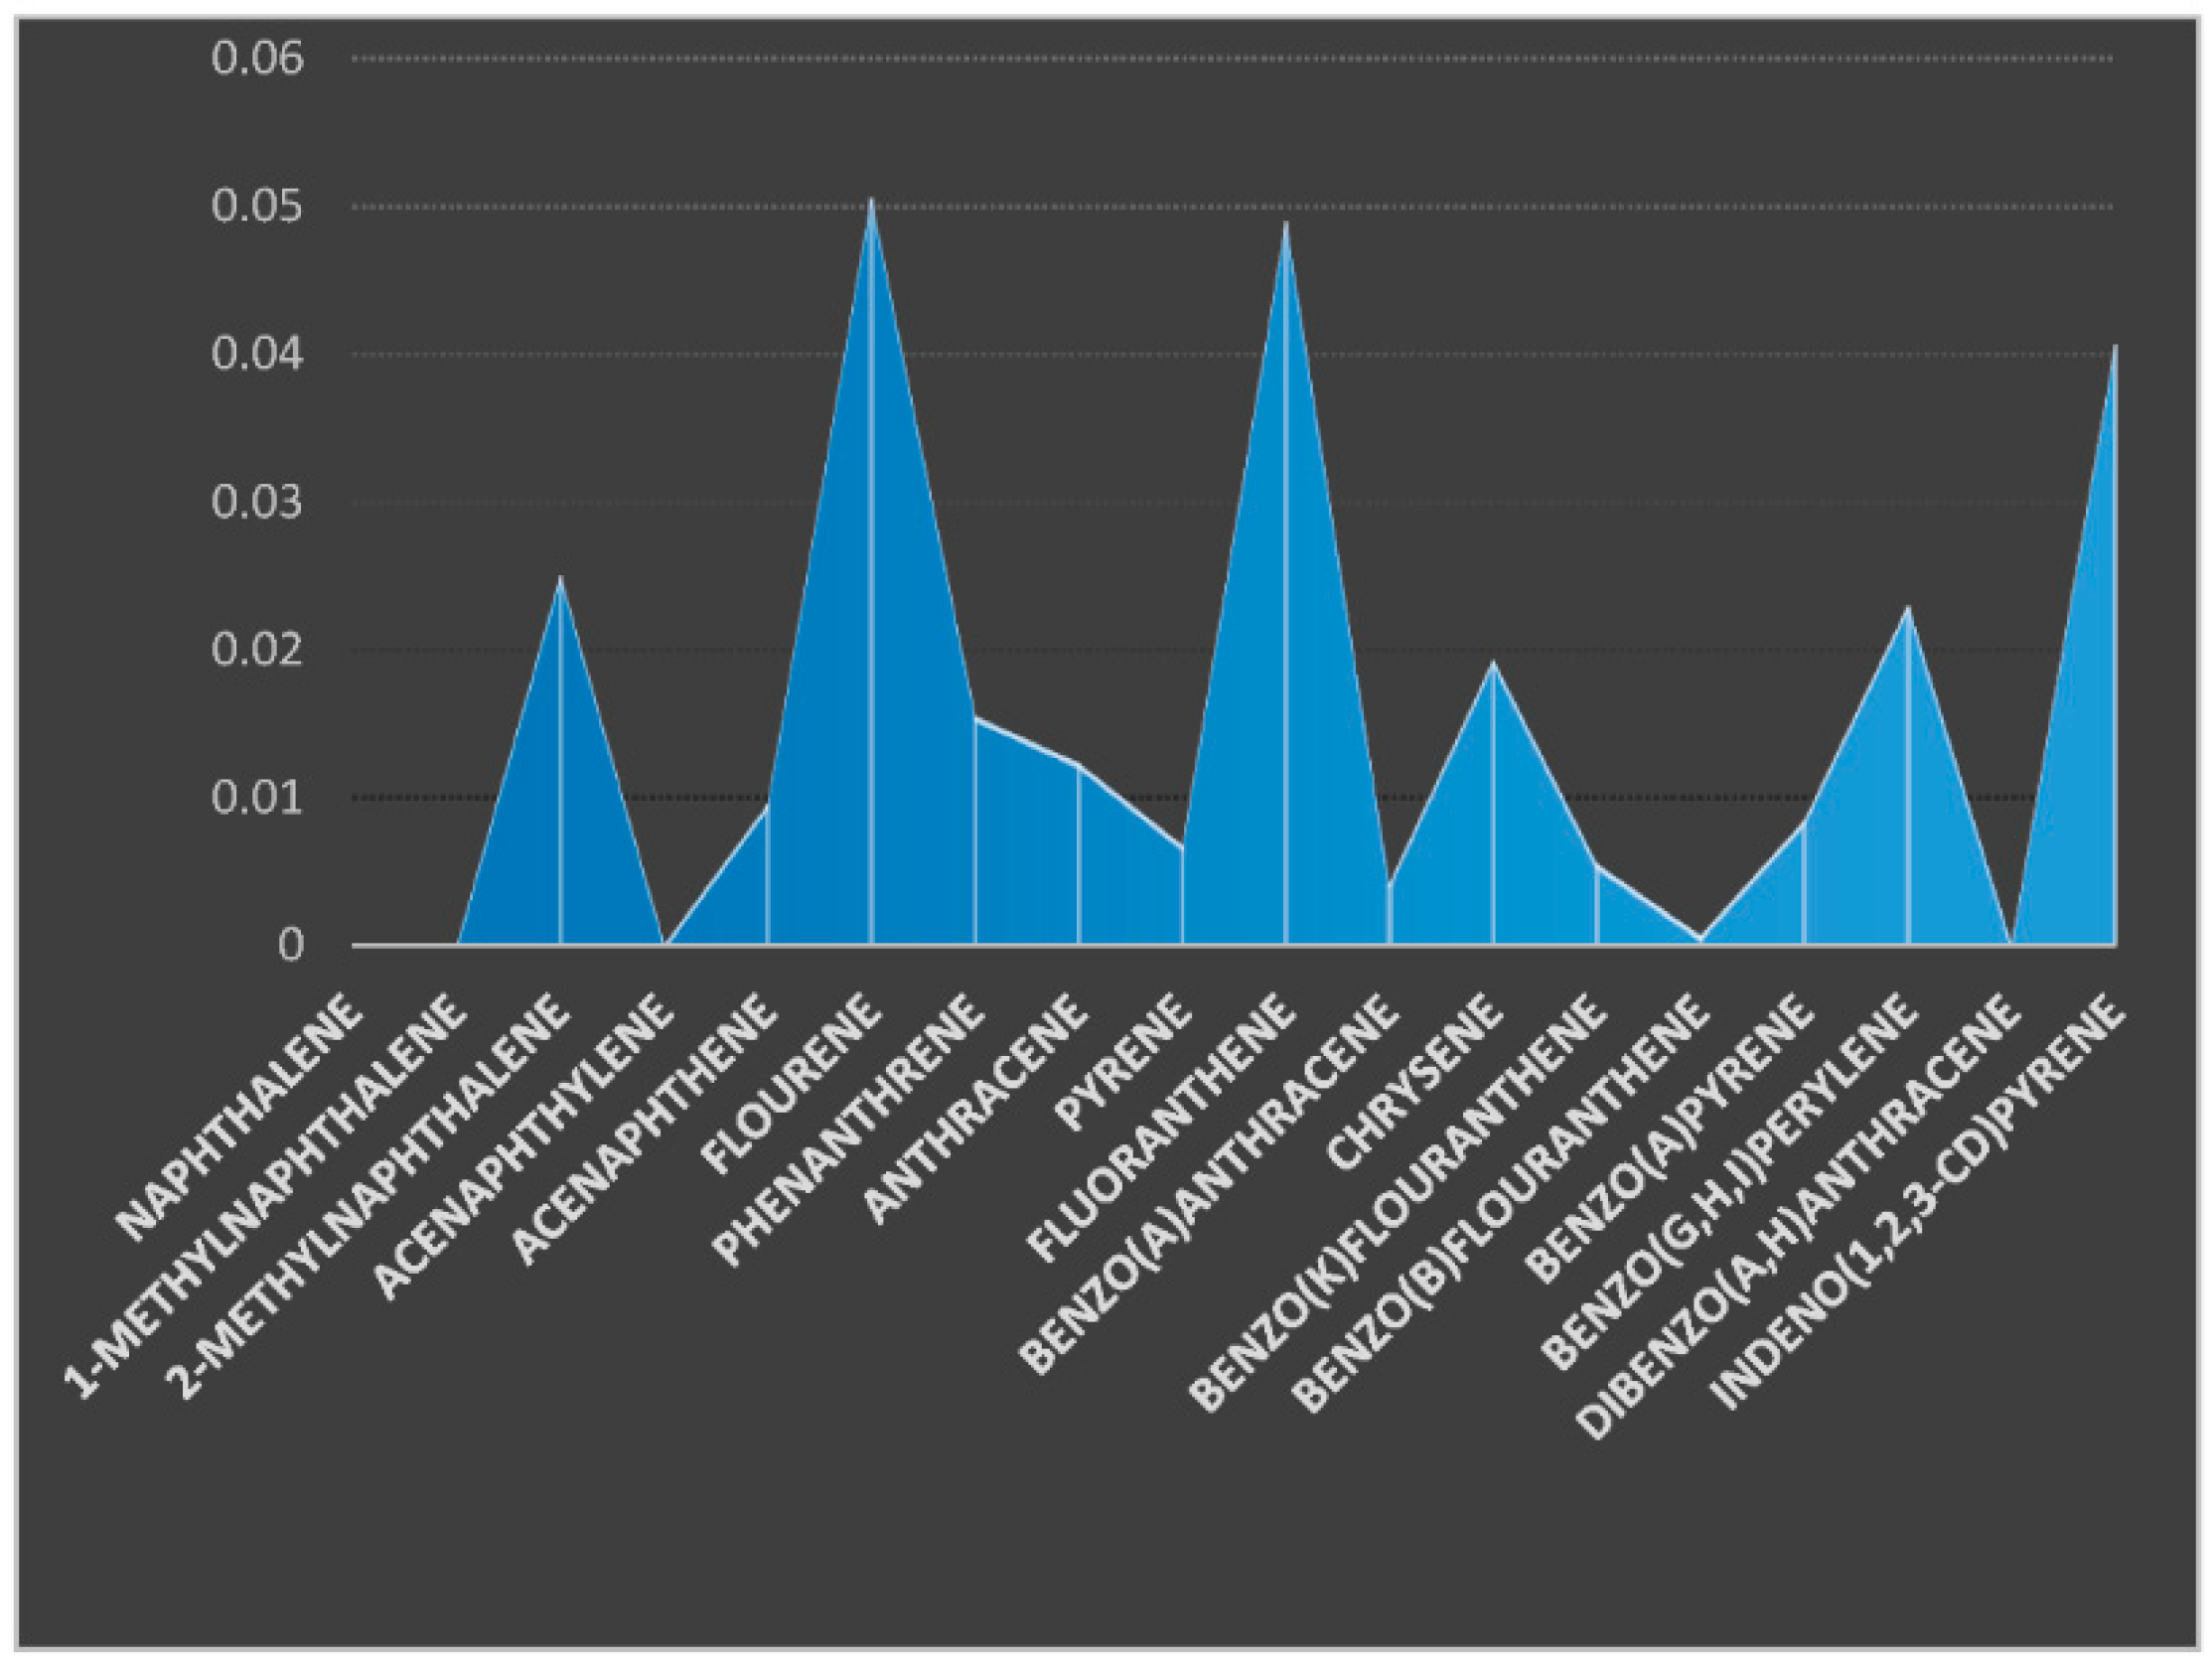
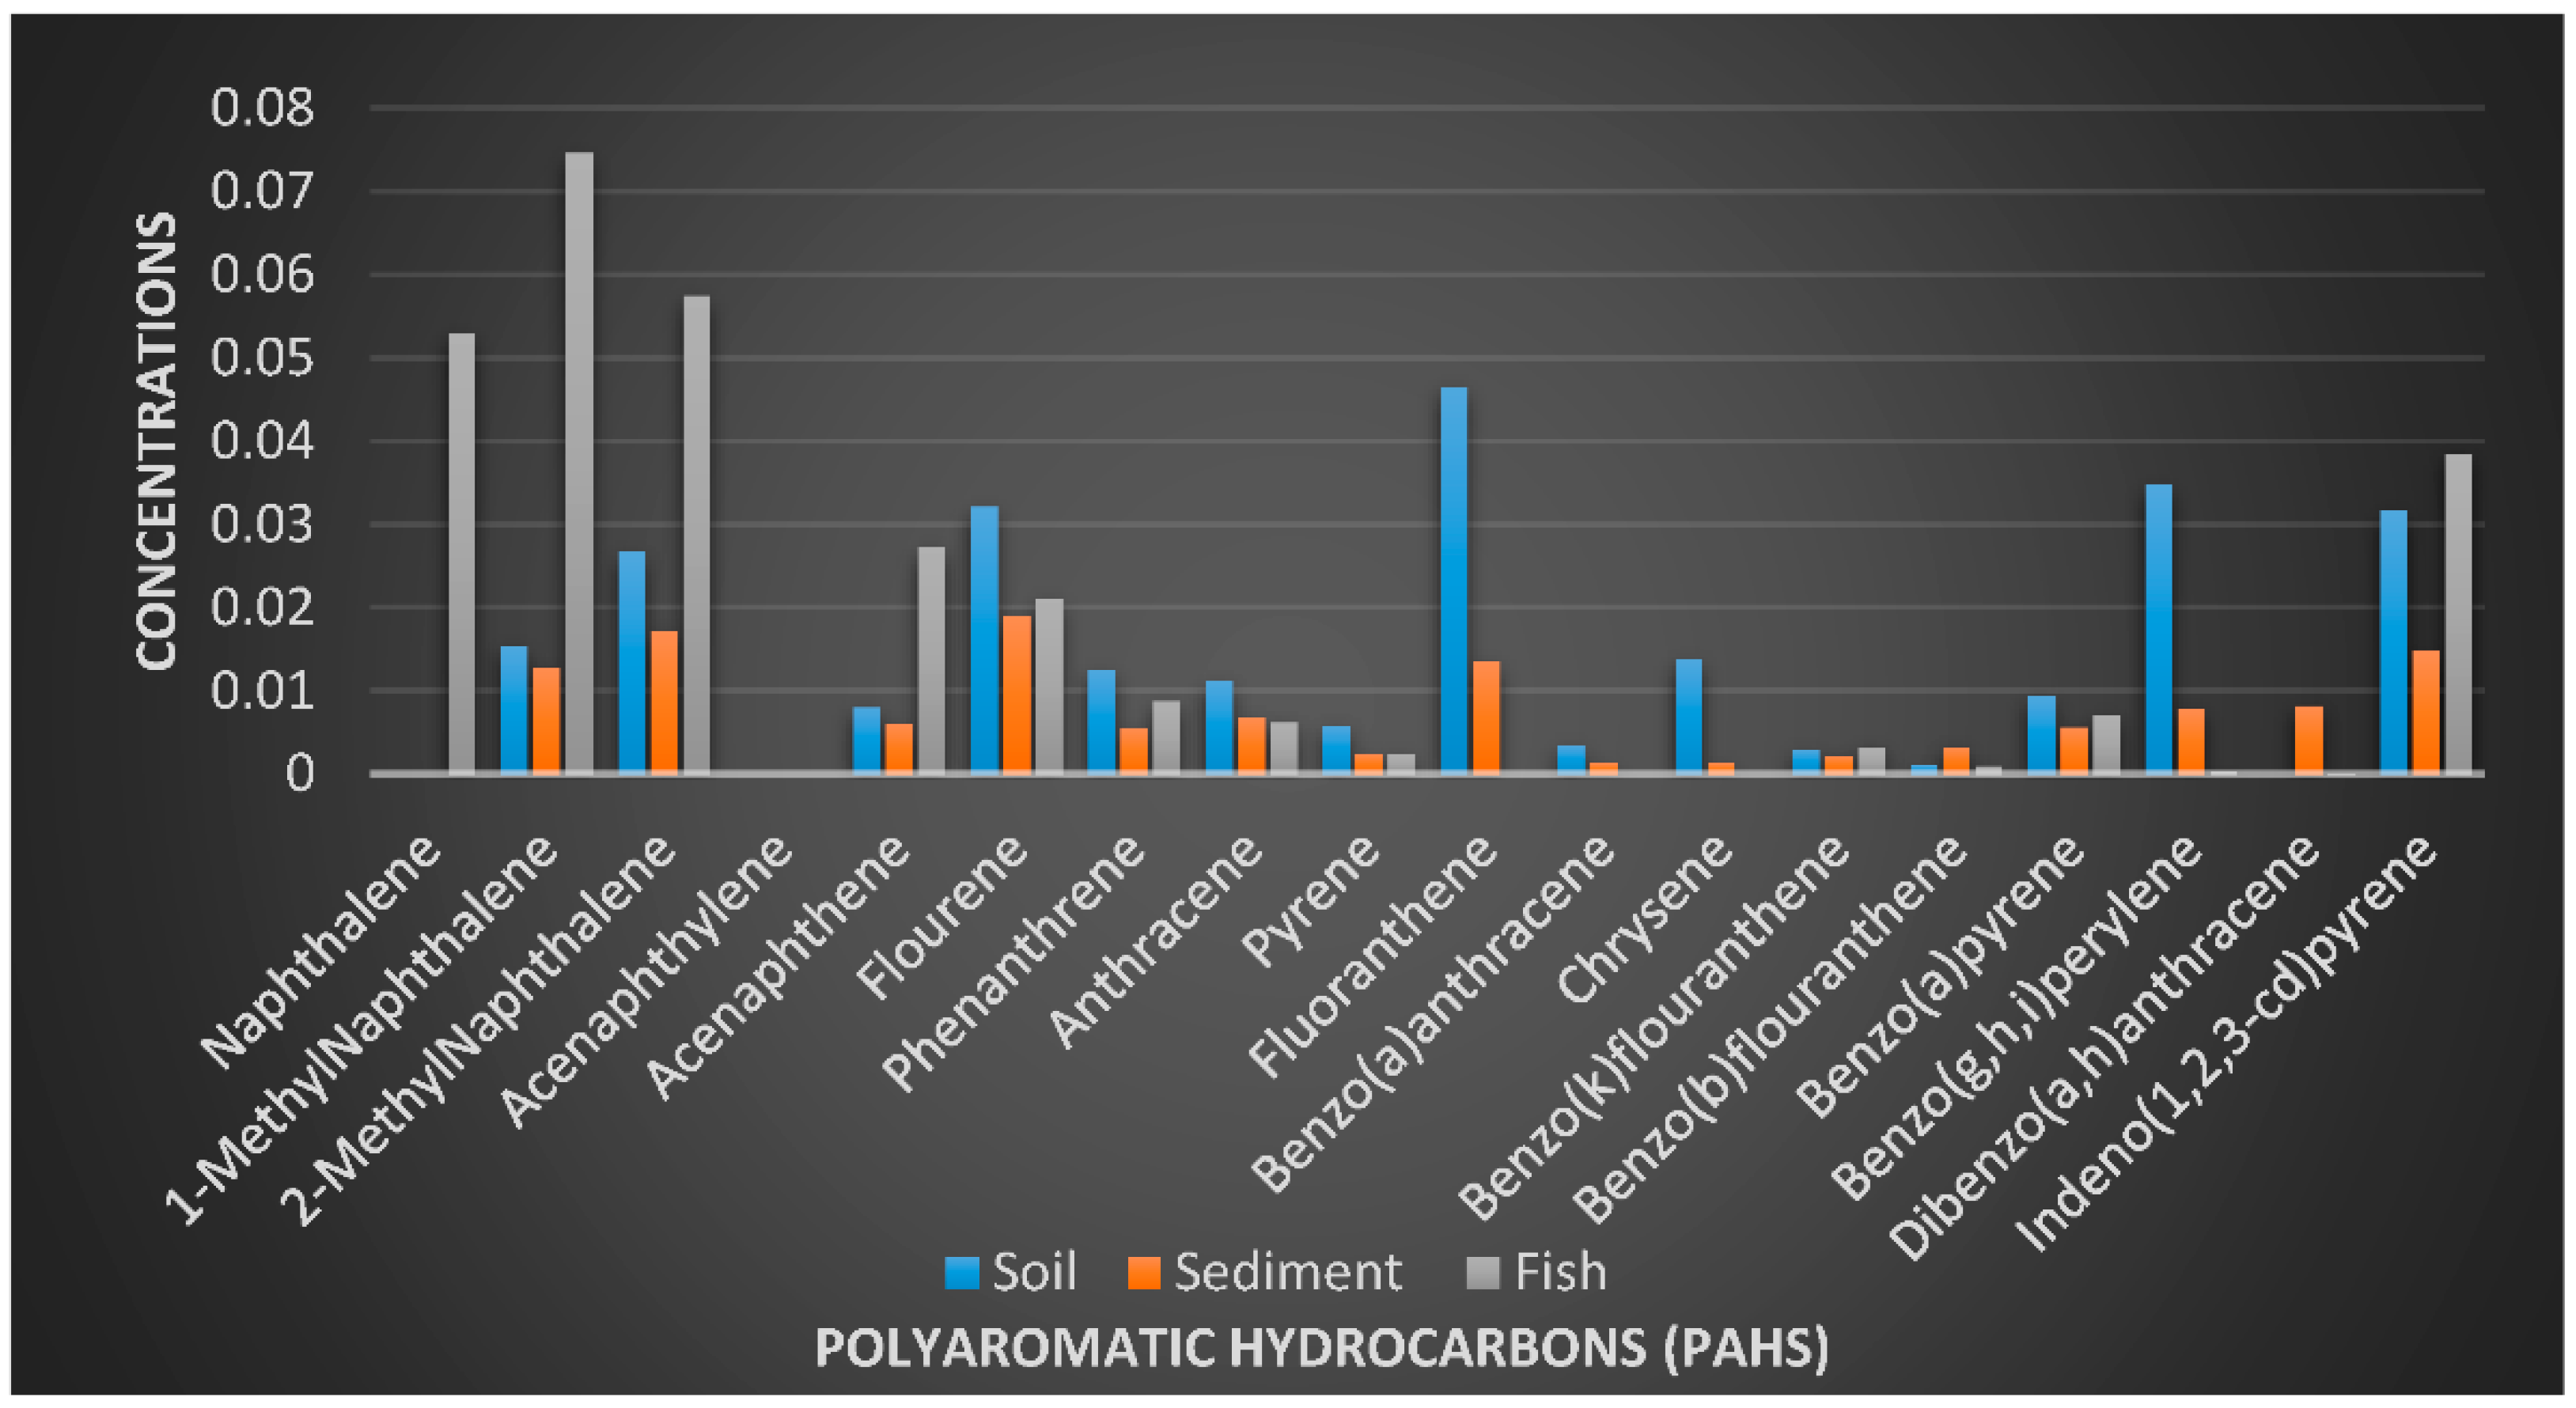
3.1. Concentration of PAHs in the Soil Samples

The concentrations of various PAHs components were presented using the charts (Figure 2 and Figure 3). Eighteen (18) PAHs components were examined in the soil samples taken from two sampling stations. The soil samples were coded as SO1 (soil sample from sampling location 1) from the upstream farm site and SO2 (soil sample from sampling location 2) from the downstream farm site. Naphthalene, acenaphthalene, and dibenzo(a,h) anthracene were not detected in the soil samples from the two farm locations. 1-MethylNaphthalene was not detected in the soil sample from location 2 but was present in the soil sample from location 1 at a concentration of 0.0307 µg/kg. The concentrations of 2-MethylNaphthalene were 0.0282 and 0.0250 µg/kg for soil samples from location 1 and 2, respectively. The concentrations of acenaphthene, fluorene, phenanthrene, and anthracene were 0.0065, 0.0136, 0.0094, and 0.0048 µg/kg for soil sample from location 1 and 0.0095, 0.056, 0.0155, and 0.0123 µg/kg for the same components in soil sample from location 2. The concentrations of pyrene, fluoranthrene, benzo(a)anthracene, and chrycene were 0.0048, 0.0440, 0.0027, and 0.0083 µg/kg for the soil sample from location 1 (SO1) and 0.0067, 0.0490, 0.0041, and 0.0193 µg/kg for the soil sample from location 2 (SO2), respectively. The concentrations of benzo(k)fluoranthrene, benzo(b)fluoranthrene, Benzo(a)pyrene, Benzo(g,h,i)perylene and Indeno(1,2,3-cd)pyrene were 0.0003, 0.0014, 0.0102, 0.0463, and 0.0227 µg/kg for soil sample from location 1 and 0.0055, 0.0006, 0.0084, 0.0230, and 0.0406 µg/kg for soil sample from location 2, respectively. The total sums of the PAHs components were ∑0.239 and ∑0.270 µg/kg for soil samples from locations 1 and 2, respectively. Muntean et al. [29] studied PAHs in three locations from Transylvania (Cluj Napoca, Jucu, and Seica Mare), and the total PAHs concentrations ranged from 4.43 to 11.74 µg/kg, the highest recorded values being for fluorene (9.02 µg/kg), benzo (b) fluoranthene (2.85 µg/kg), and benzo(a)anthracene (2.16 µg/kg); the highest soil contamination was from samples originating from Seica Mare (11.74 µg/kg) and from Cluj Napoca. The high concentration levels of PAHs were attributed to historical pollution and car traffic. Kim et al. [30] carried out a study on the top soils of rice paddies from Gyeonggi-do in Korea to assess the spatial distribution and potential sources of PAHs. The total concentrations of PAHs in the soils ranged between 19.53–672.93, 125.01–3106.27, and 51.94–8106.21 mg/kg, respectively. Three-ring PAHs were predominant in the soils from Gyeonggi-do, while 3–5 ring compounds were abundant in the agricultural soils from other industrial regions. The presence of PAHs was suggested to have originated from pyrogenic sources. The concentrations of PAHs from these regions were higher than the results obtained from this study.

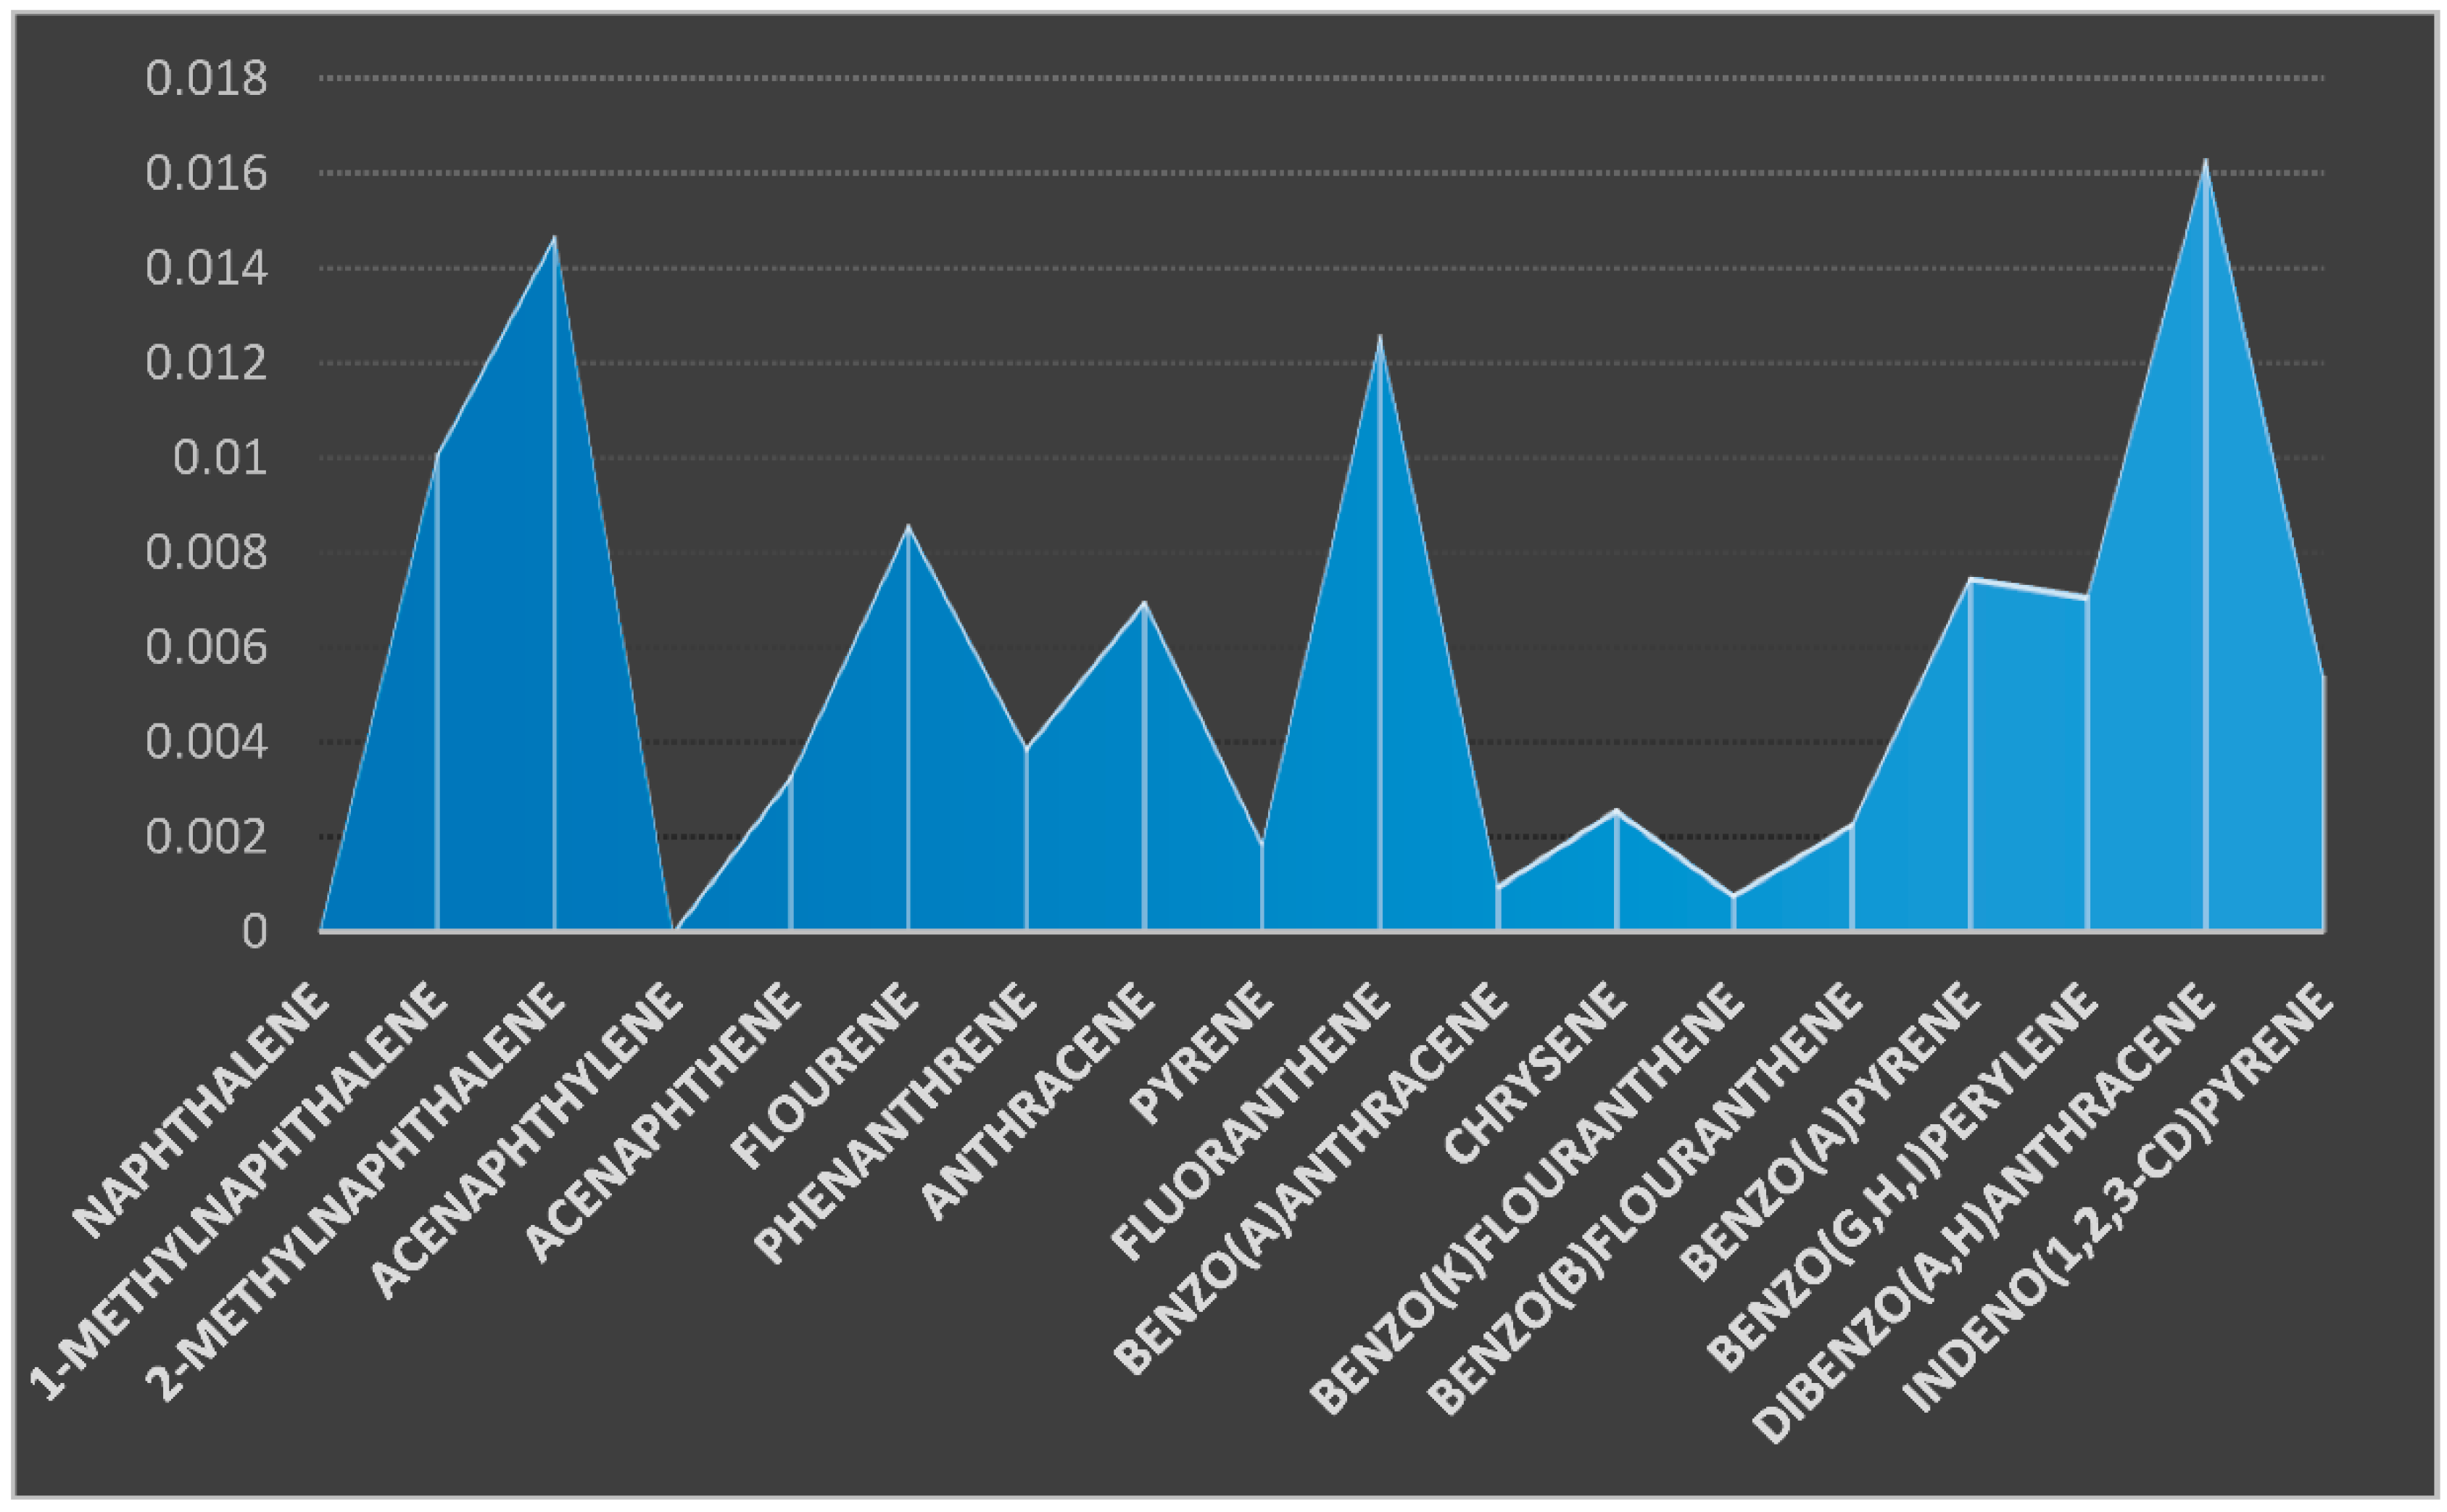
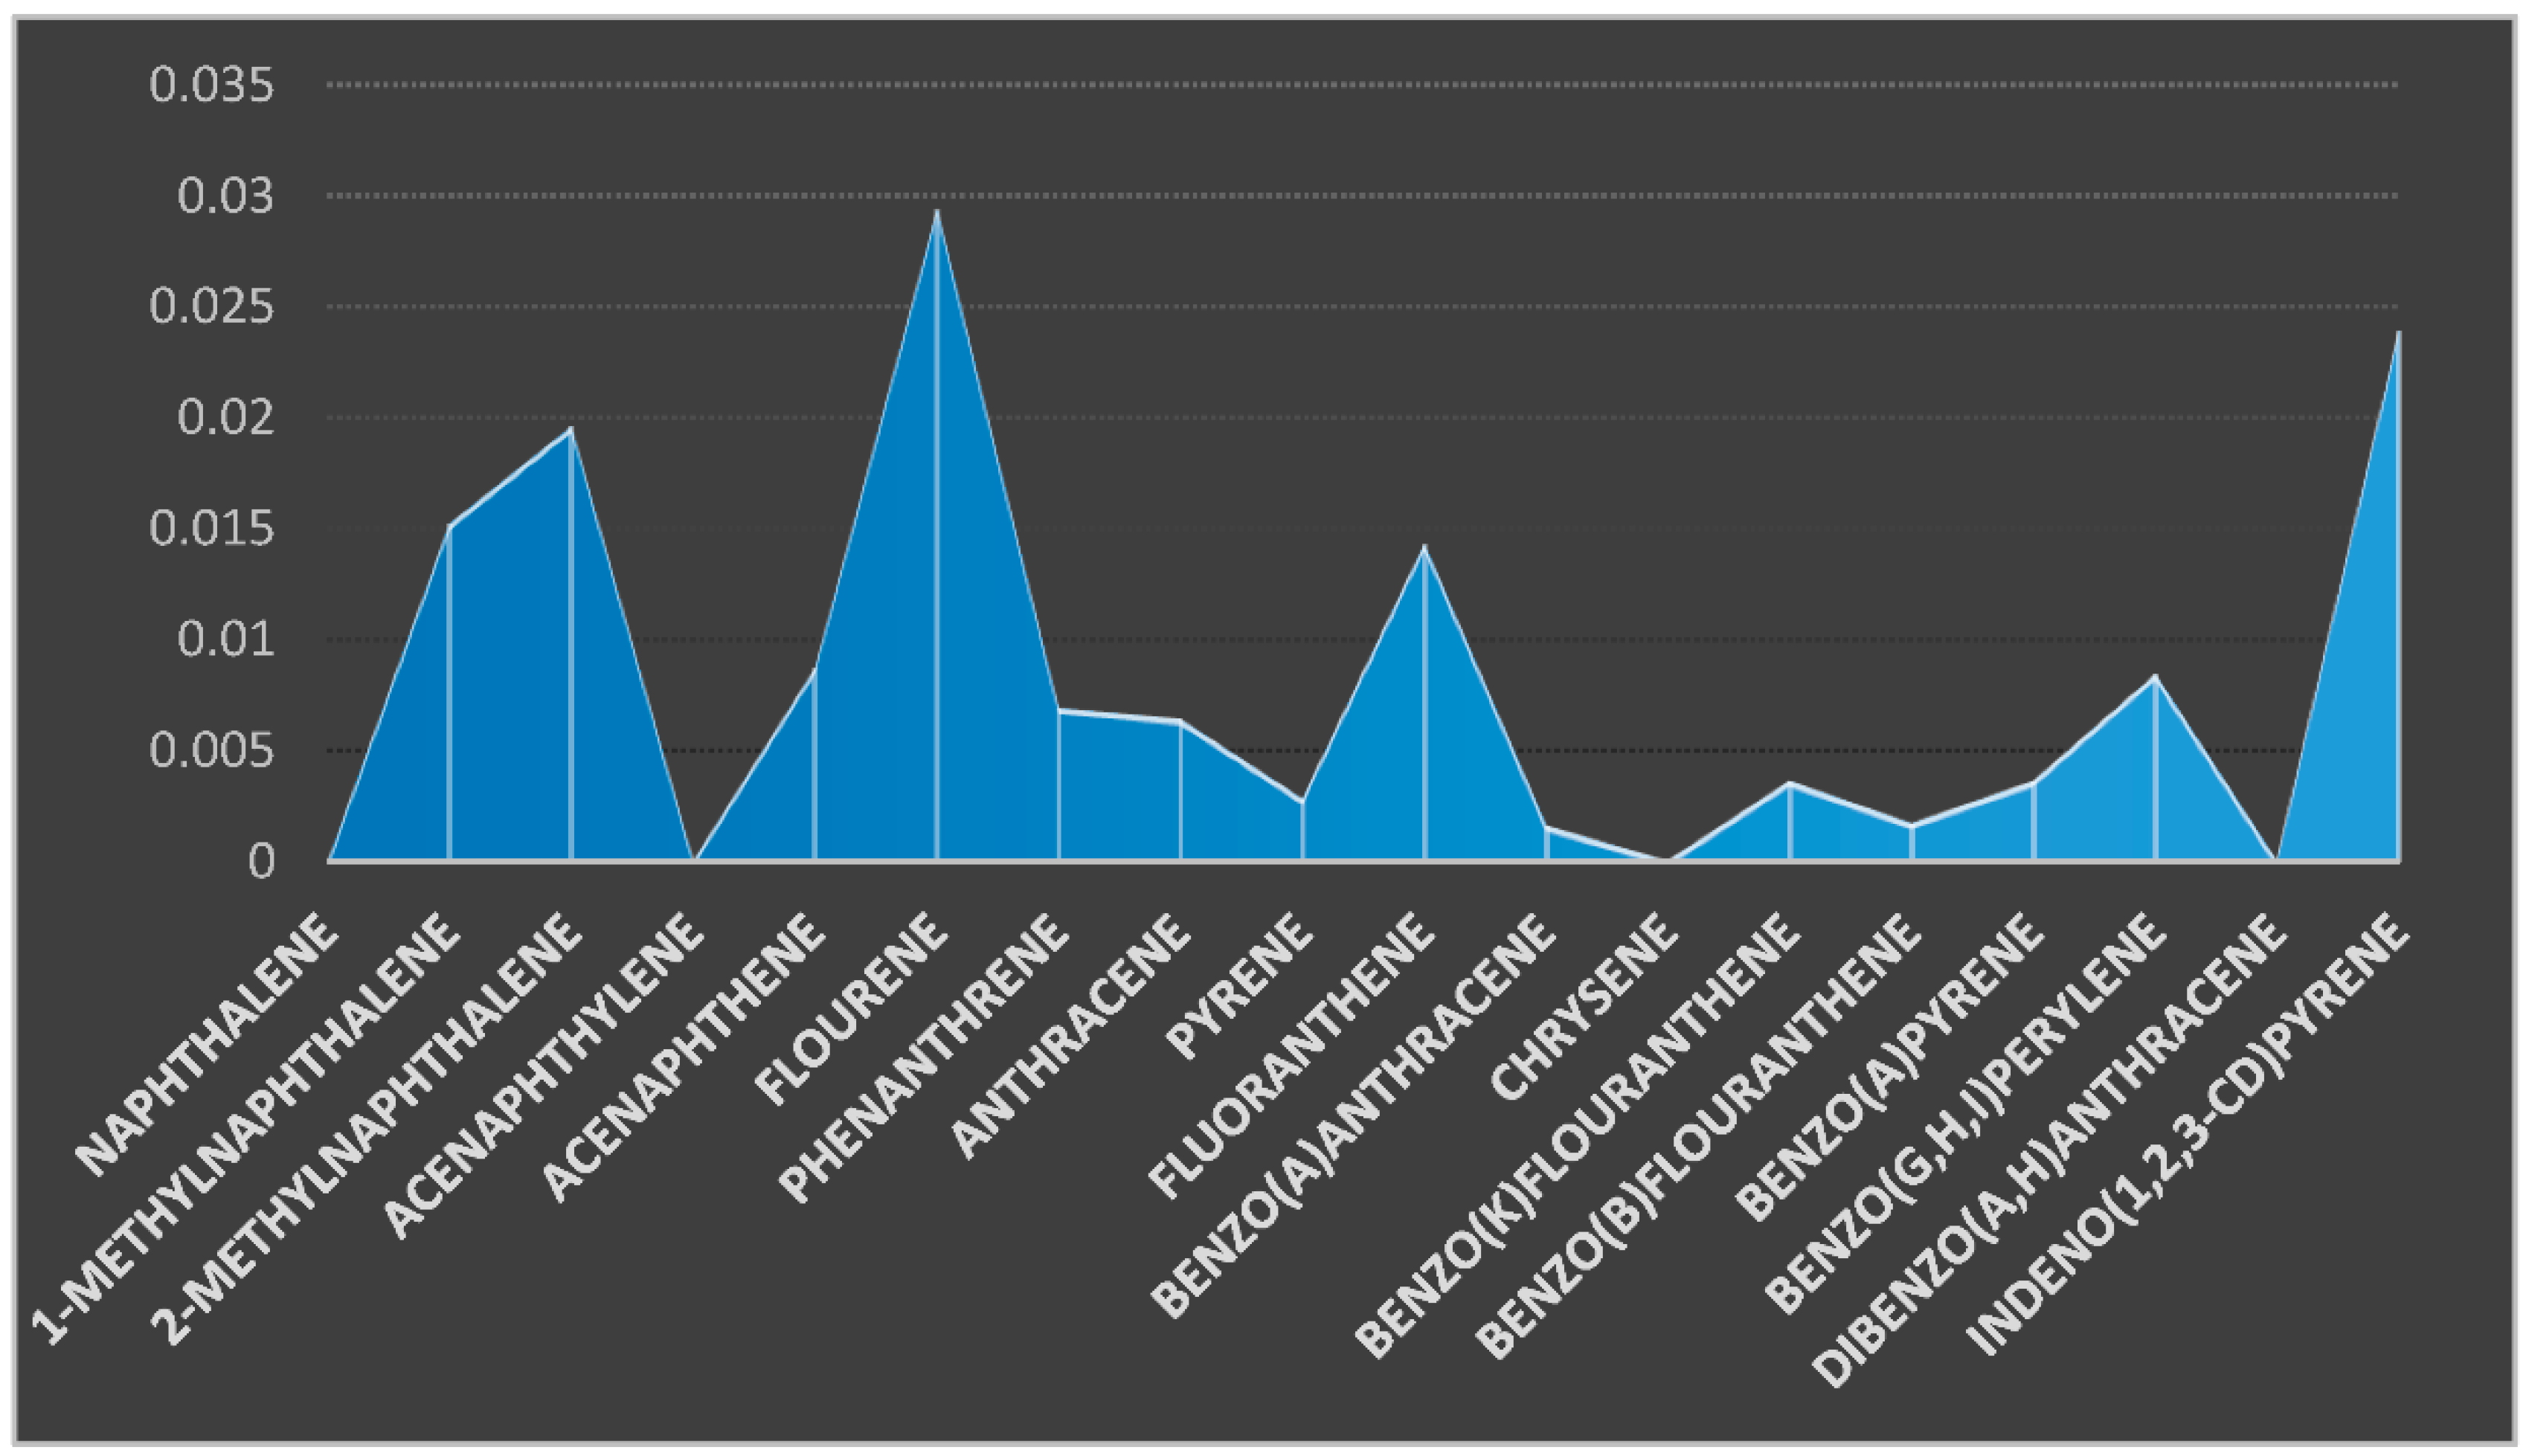
3.2. Concentration of PAHs in the Sediment Samples

Two sediment samples were taken from two different sampling stations: coded SE1 (upstream) and SE2 (downstream) (Figure 1). Eighteen (18) PAHs were determined from the sediment samples and the results presented in the charts (Figure 4 and Figure 5). Naphthalene and acenaphthylene were not detected in the sediment samples. Dibenzo(a,h)anthracene and Chrysene were detected in the sediment sample from sampling location 1 with a concentration of 0.0163 and 0.0026 µg/kg but not detected in the sediment sample from sampling location 2. The concentrations of 1-MethylNaphthalene, 2-MethylNaphthalene, acenaphthene, fluorene, phenanthrene, and anthracene were 0.0101, 0.0147, 0.0033, 0.0086, 0.0039, and 0.0070 µg/kg for sediment sample from location 1 and 0.0152, 0.0196, 0.0087, 0.0294, 0.0069, and 0.0064 µg/kg for the same components of PAHs in sediment sample from sampling location 2. The concentration of benzo(k)fluoranthene, benzo(b)fluoranthene, benzo(a)pyrene, benzo(g,h,i)perylene, and indeno(1,2,3-cd)pyrene were 0.0008, 0.0023, 0.0075, 0.0071, and 0.0054 µg/kg for sediment sample from location 1 and 0.0036, 0.0017, 0.0036, 0.0084, and 0.0239 µg/kg, respectively, for the same PAHs components in location 2. The total summation of PAHs components for sediment sample 1 was ∑0.105 and ∑0.146 µg/kg for location 2.
A research conducted by Sun et al. [31] on sediments from a mixed use reservoir from Shitou Koumen to determine PAHs recorded no value for Acy, Bkf, and DahA while the concentrations of Nap, Ace, Flo, and Phe ranged between 535.4–1009.6, 0–21.43, 23.63–110.3, and 150.40–637.0 ng/g. The total PAHs concentrations in sediments from this reservoir (Shitou Koumen Resevoir) ranged from 1294.51–2755.35 ng/g with a mean concentration of 1757.54 ng/g. The concentration of PAHs reported by Sun et al., 2016 was very high compared to this study; this was attributed to a polluted river treatment and potentially a polluted tributary. This was also supported by Mirza et al. [32]. Major sources of PAHs in river sediments have being attributed to oil spillage, coal incineration, and vehicular emissions, as reported by Yang et al. [33]. Agnieska et al. [34] researched on the concentration of PAHs in bottom sediments collected from a reservoir in South-Eastern Poland and reported the total concentration that ranged from 150–33,900 ug/kg. They attributed the origin of PAHs to pyrolytic activities and petrogenic sources.
A research carried out by Zhao et al. [35] on PAHs in sediments from the river Qinhuai and lake Xuanwu, Nanjing China reported a total concentration of range of PAHs from 796.2 to 10,470 ng/g with an average of 2713.8 ng/g. The research work suggested that the PAHs in the river Qinhuai were mainly from pyrogenic origins and petroleum sources. Oyo-Ita et al. [36] reported a total concentration of 1670.0 to 20,100.0 ng/g and a mean value of 9370 ng/g from river Calabar, Nigeria. Most PAHs have been reported to affect aquatic organisms and the ecosystem [34,35,36,37].

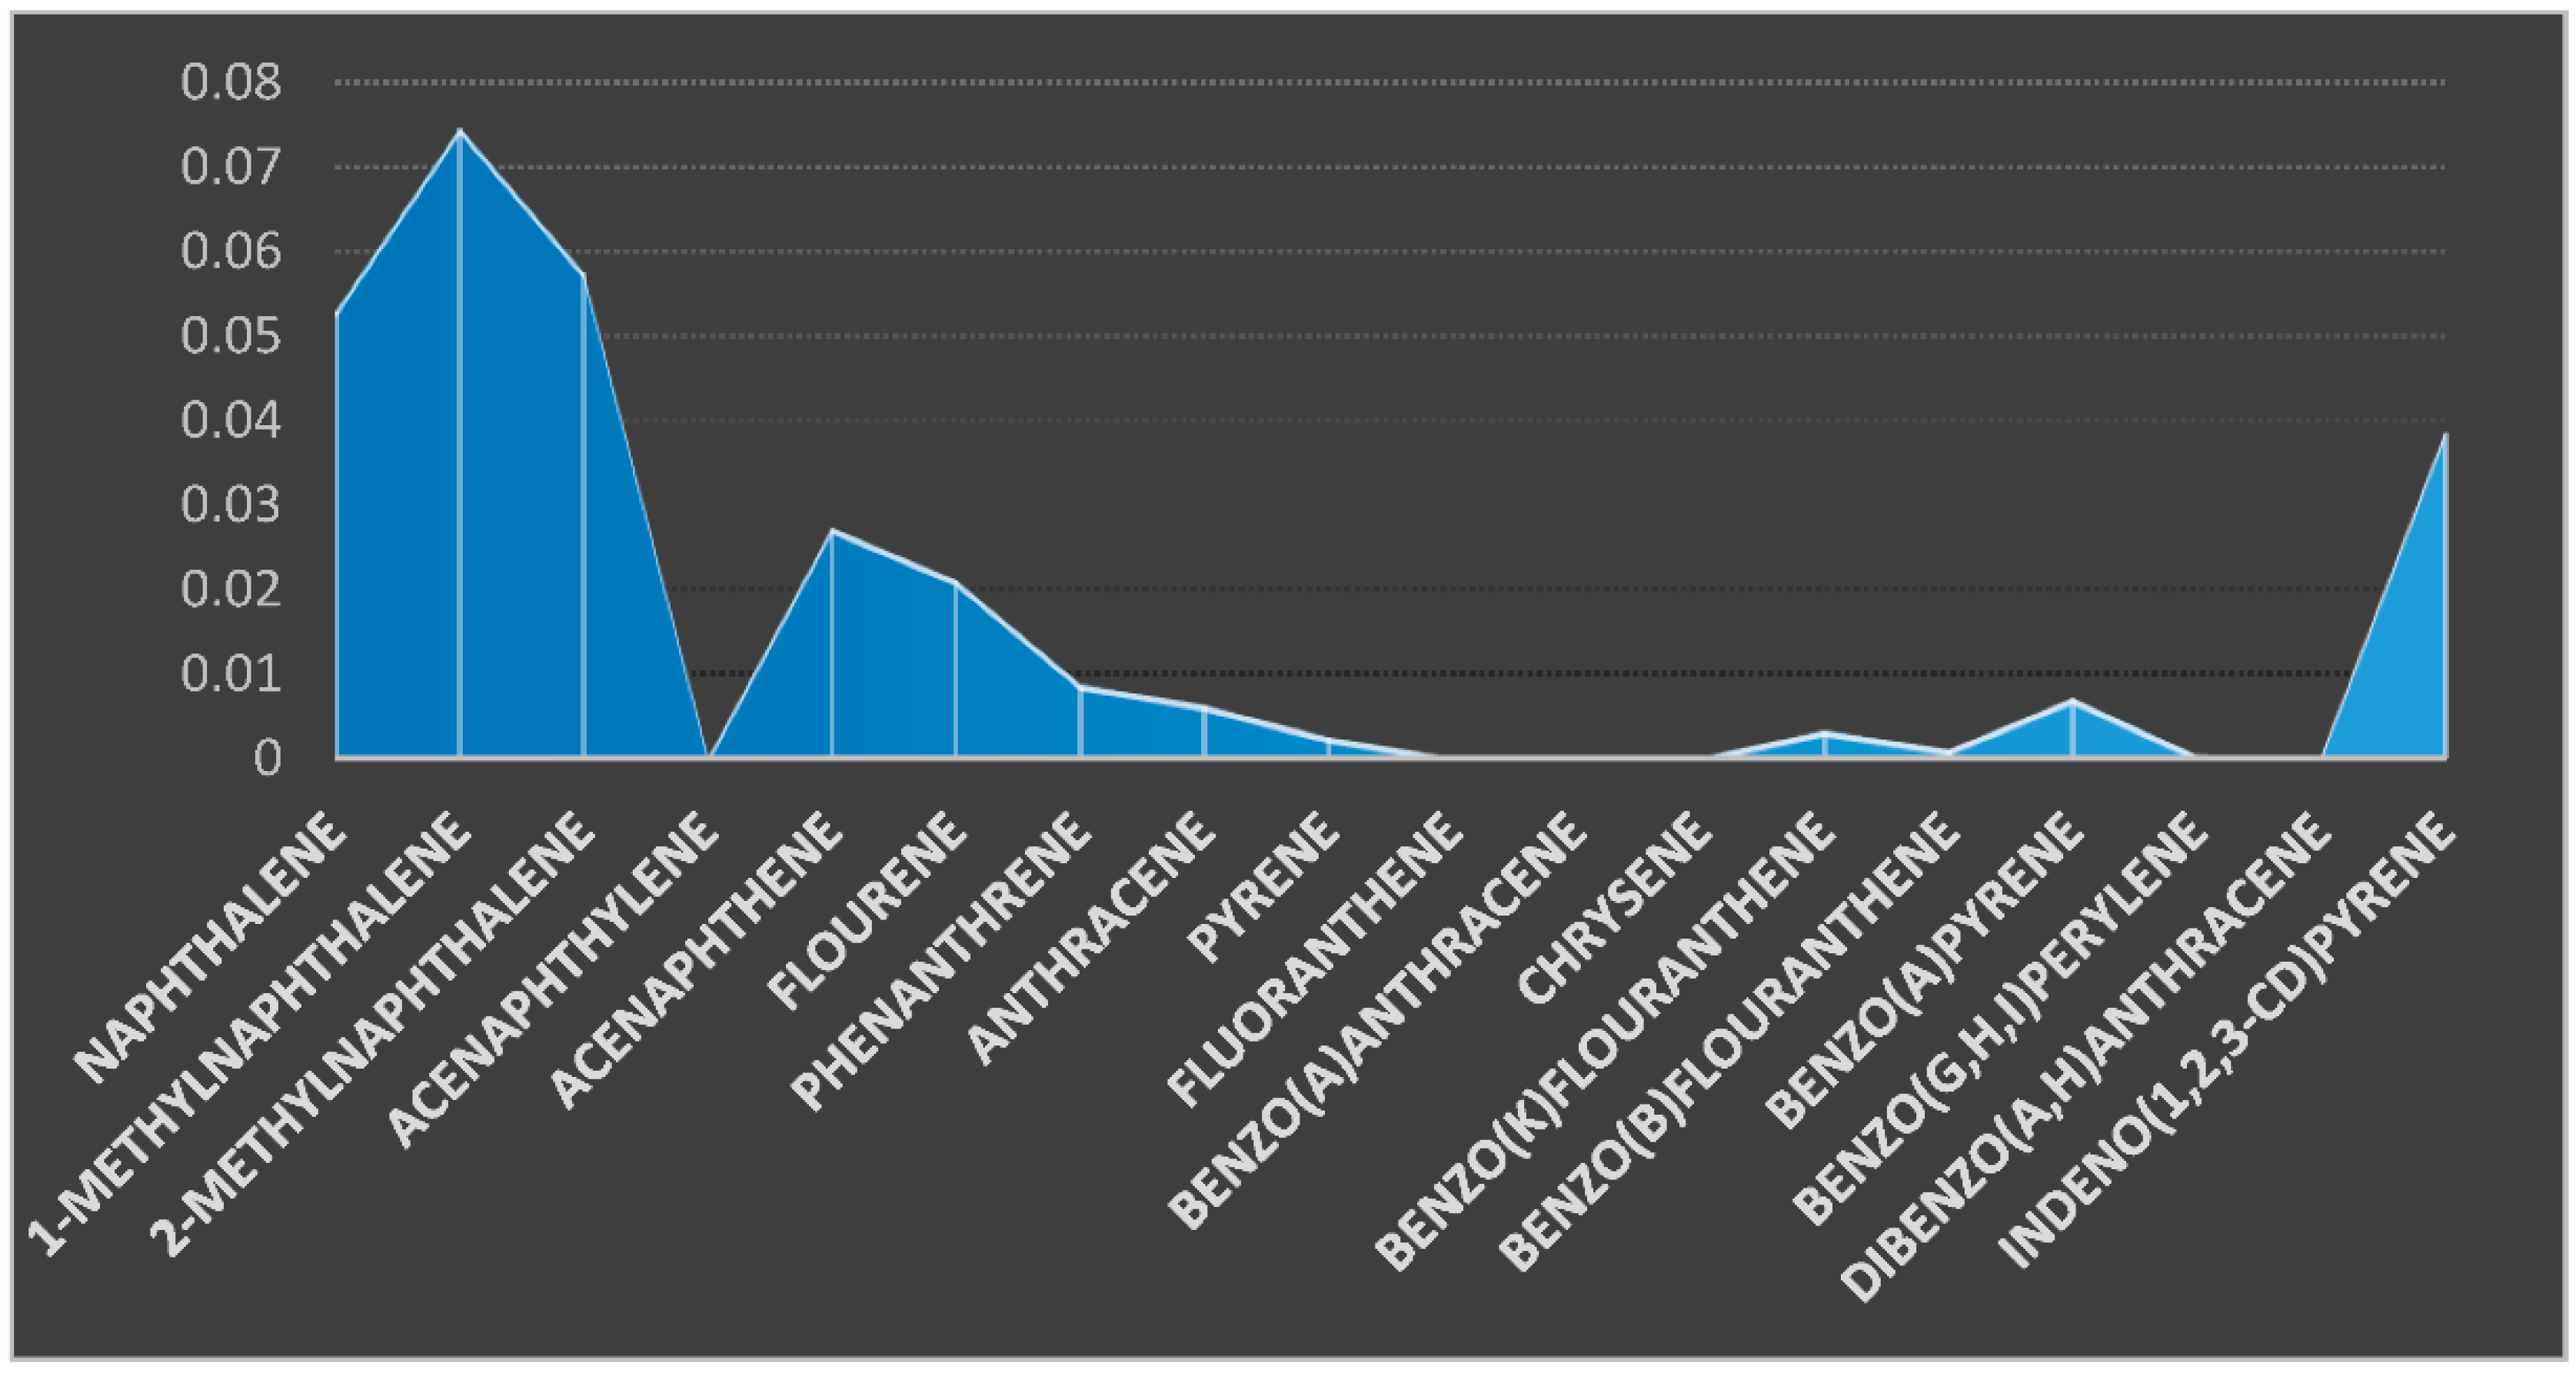
3.3. Concentration of PAHs in the Fish Sample

The popular name of the fish is cat fish (Clarias anguillaris). It was analyzed for the 18 PAHs components presented in the chart (Figure 6). Four (4) PAHs components were below the detection limit; they are acenaphthylene, fluoranthene, benzo(a)anthracene, and chrysene. The concentrations of naphthalene, 1-MethylNaphthalene, and 2-MethylNaphthalene were 0.0529, 0.0746, and 0.0574 µg/kg, respectively, for the fish sample. The respective concentrations of acenaphthene, fluorene, phenanthrene, anthracene, and pyrene were 0.0272, 0.0210, 0.0087, 0.0062, and 0.0024 µg/kg. The concentrations of benzo(k)fluoranthrene, benzo(b)fluoranthrene, benzo(a)pyrene, benzo(g,h,i)perylene, dibenzo(a,h)anthracene, and indeno(1,2,3-cd)pyrene were 0.0032, 0.0009, 0.0070, 0.0003, 0.0001, and 0.0385 µg/kg. The total sum of the PAHs in the fish sample was 0.300 µg/kg. Comparing the result of this study with a research study conducted by Asagbra, et al. [22] to determine the concentration of PAHs in fish samples from Warri River at Ubeji, Niger Delta, Nigeria recorded a total concentration between 0–1098.5 ng/g from the fish sample. Tongo et al. [38] investigated the concentration of polycyclic aromatic hydrocarbons (PAHs) in Mullet fish (Mugil cephalus) samples from fishing areas in Amariaria Community, downstream of Bonny River, Southern Nigeria. The levels of total PAHs ranged from 0.059 to 0.126 (µg/kg).
From the result presented, naphthalene and acenaphthalene were below the detection limit presented in the soil and sediment samples. Naphthalene was detected in the fish sample, while acenaphthylene was below the detection limit in the soil, sediment, and fish samples. The total concentration of the PAHs components in the fish sample was the highest (∑0.300 µg/kg) compared to the two soil samples (∑0.239 and 0.270 µg/kg) and the two sediment samples (∑0.105 and ∑0.146 µg/kg). This might be due to the bioaccumulation and bio-magnification of these PAHs components (environmental pollutants) in the fish sample. According to several researchers, fish bioaccumulates and biomagnifies environmental pollutants in various organs such as skin and tissues [32,39,40].
The concentration of PAHs in the sediment samples was lower than the soil samples. Some PAHs components such as fluoranthrene, benzo(a)anthracene, and chrysene were below the limit of detection in the fish sample but were detected in the soil and sediment samples; possibly, the fish does not tend to accumulate these PAHs components.

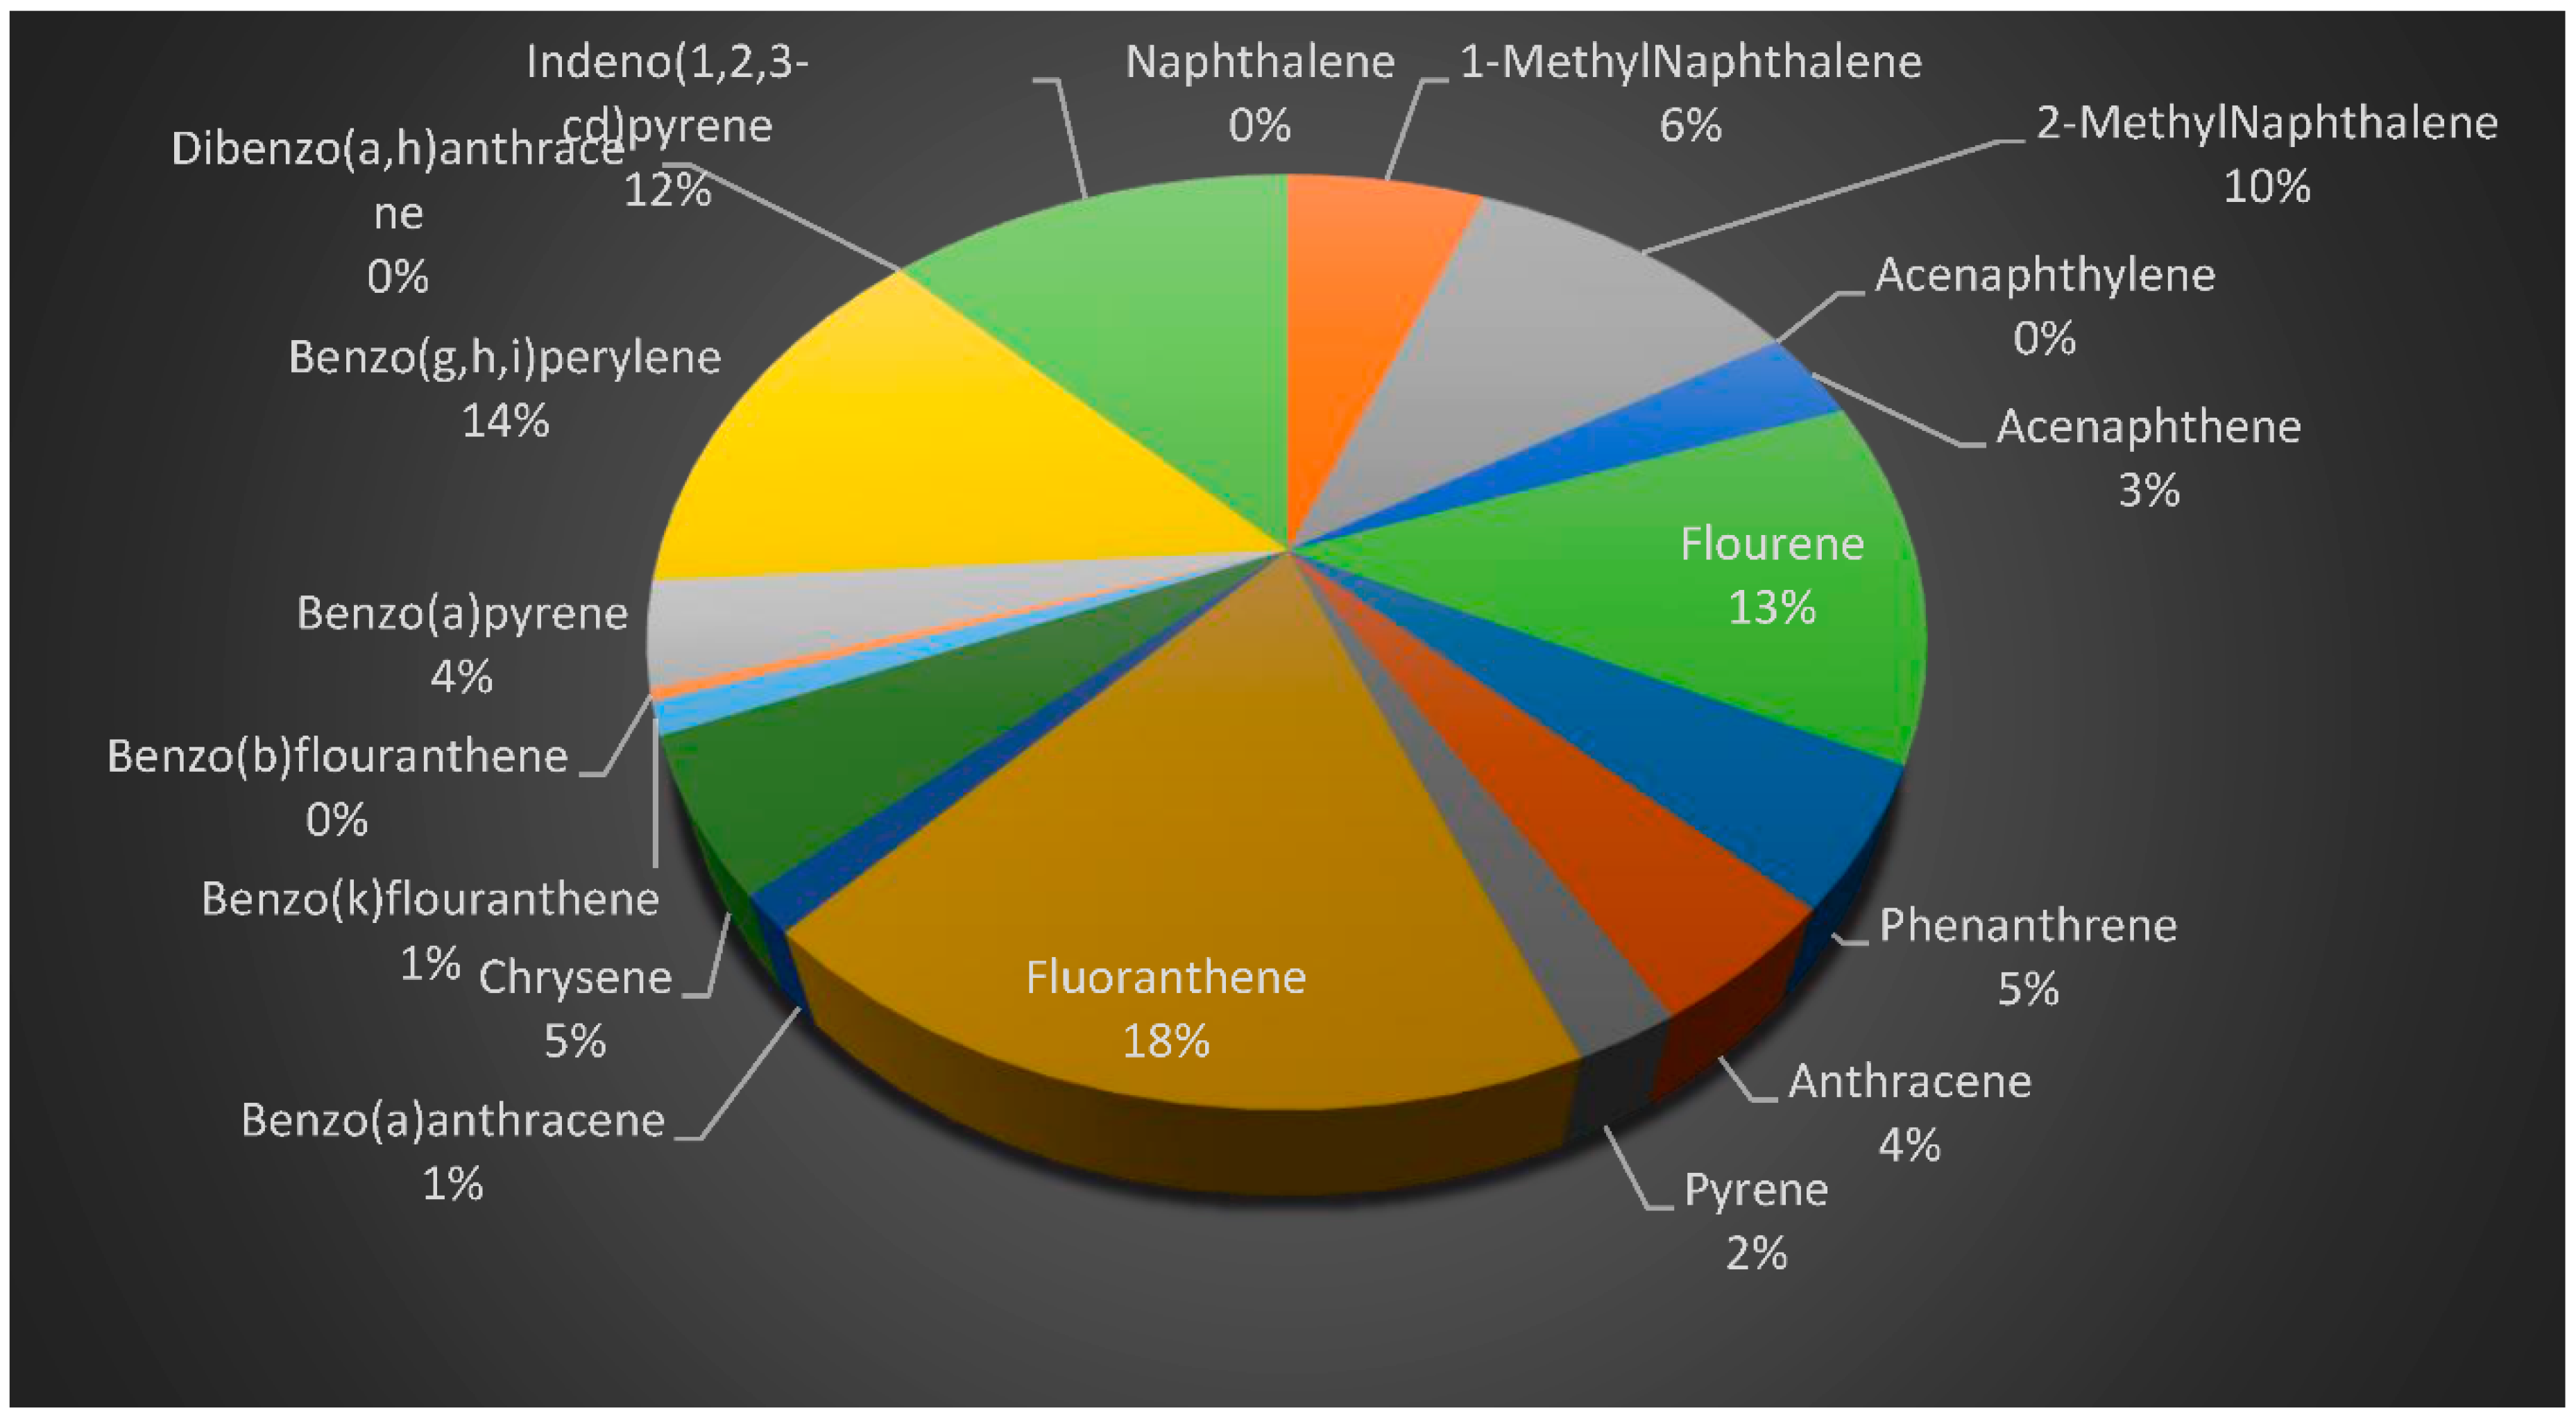
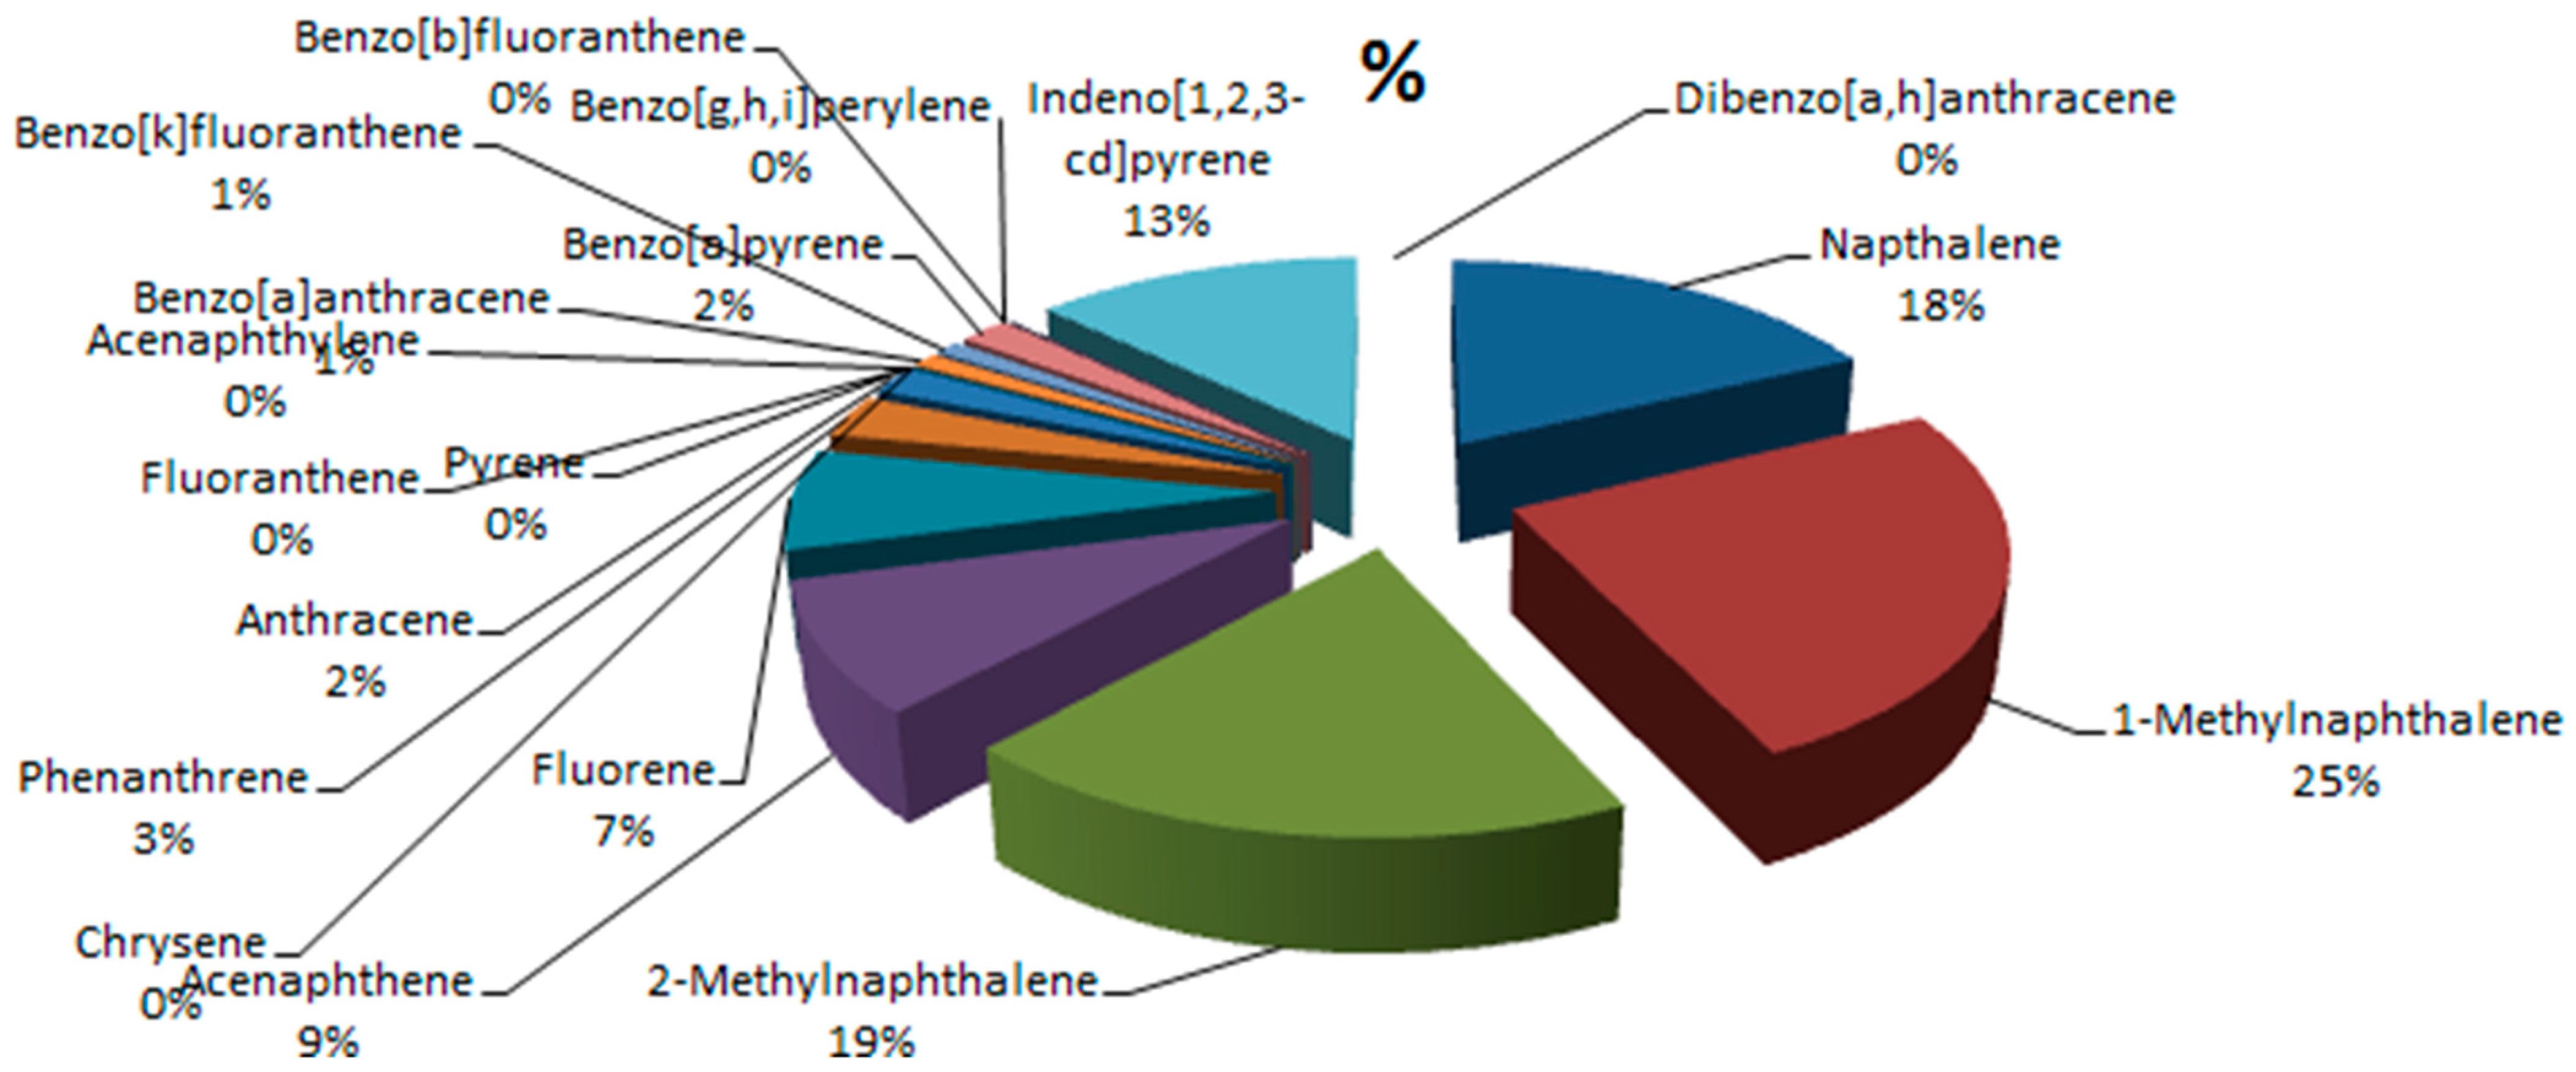
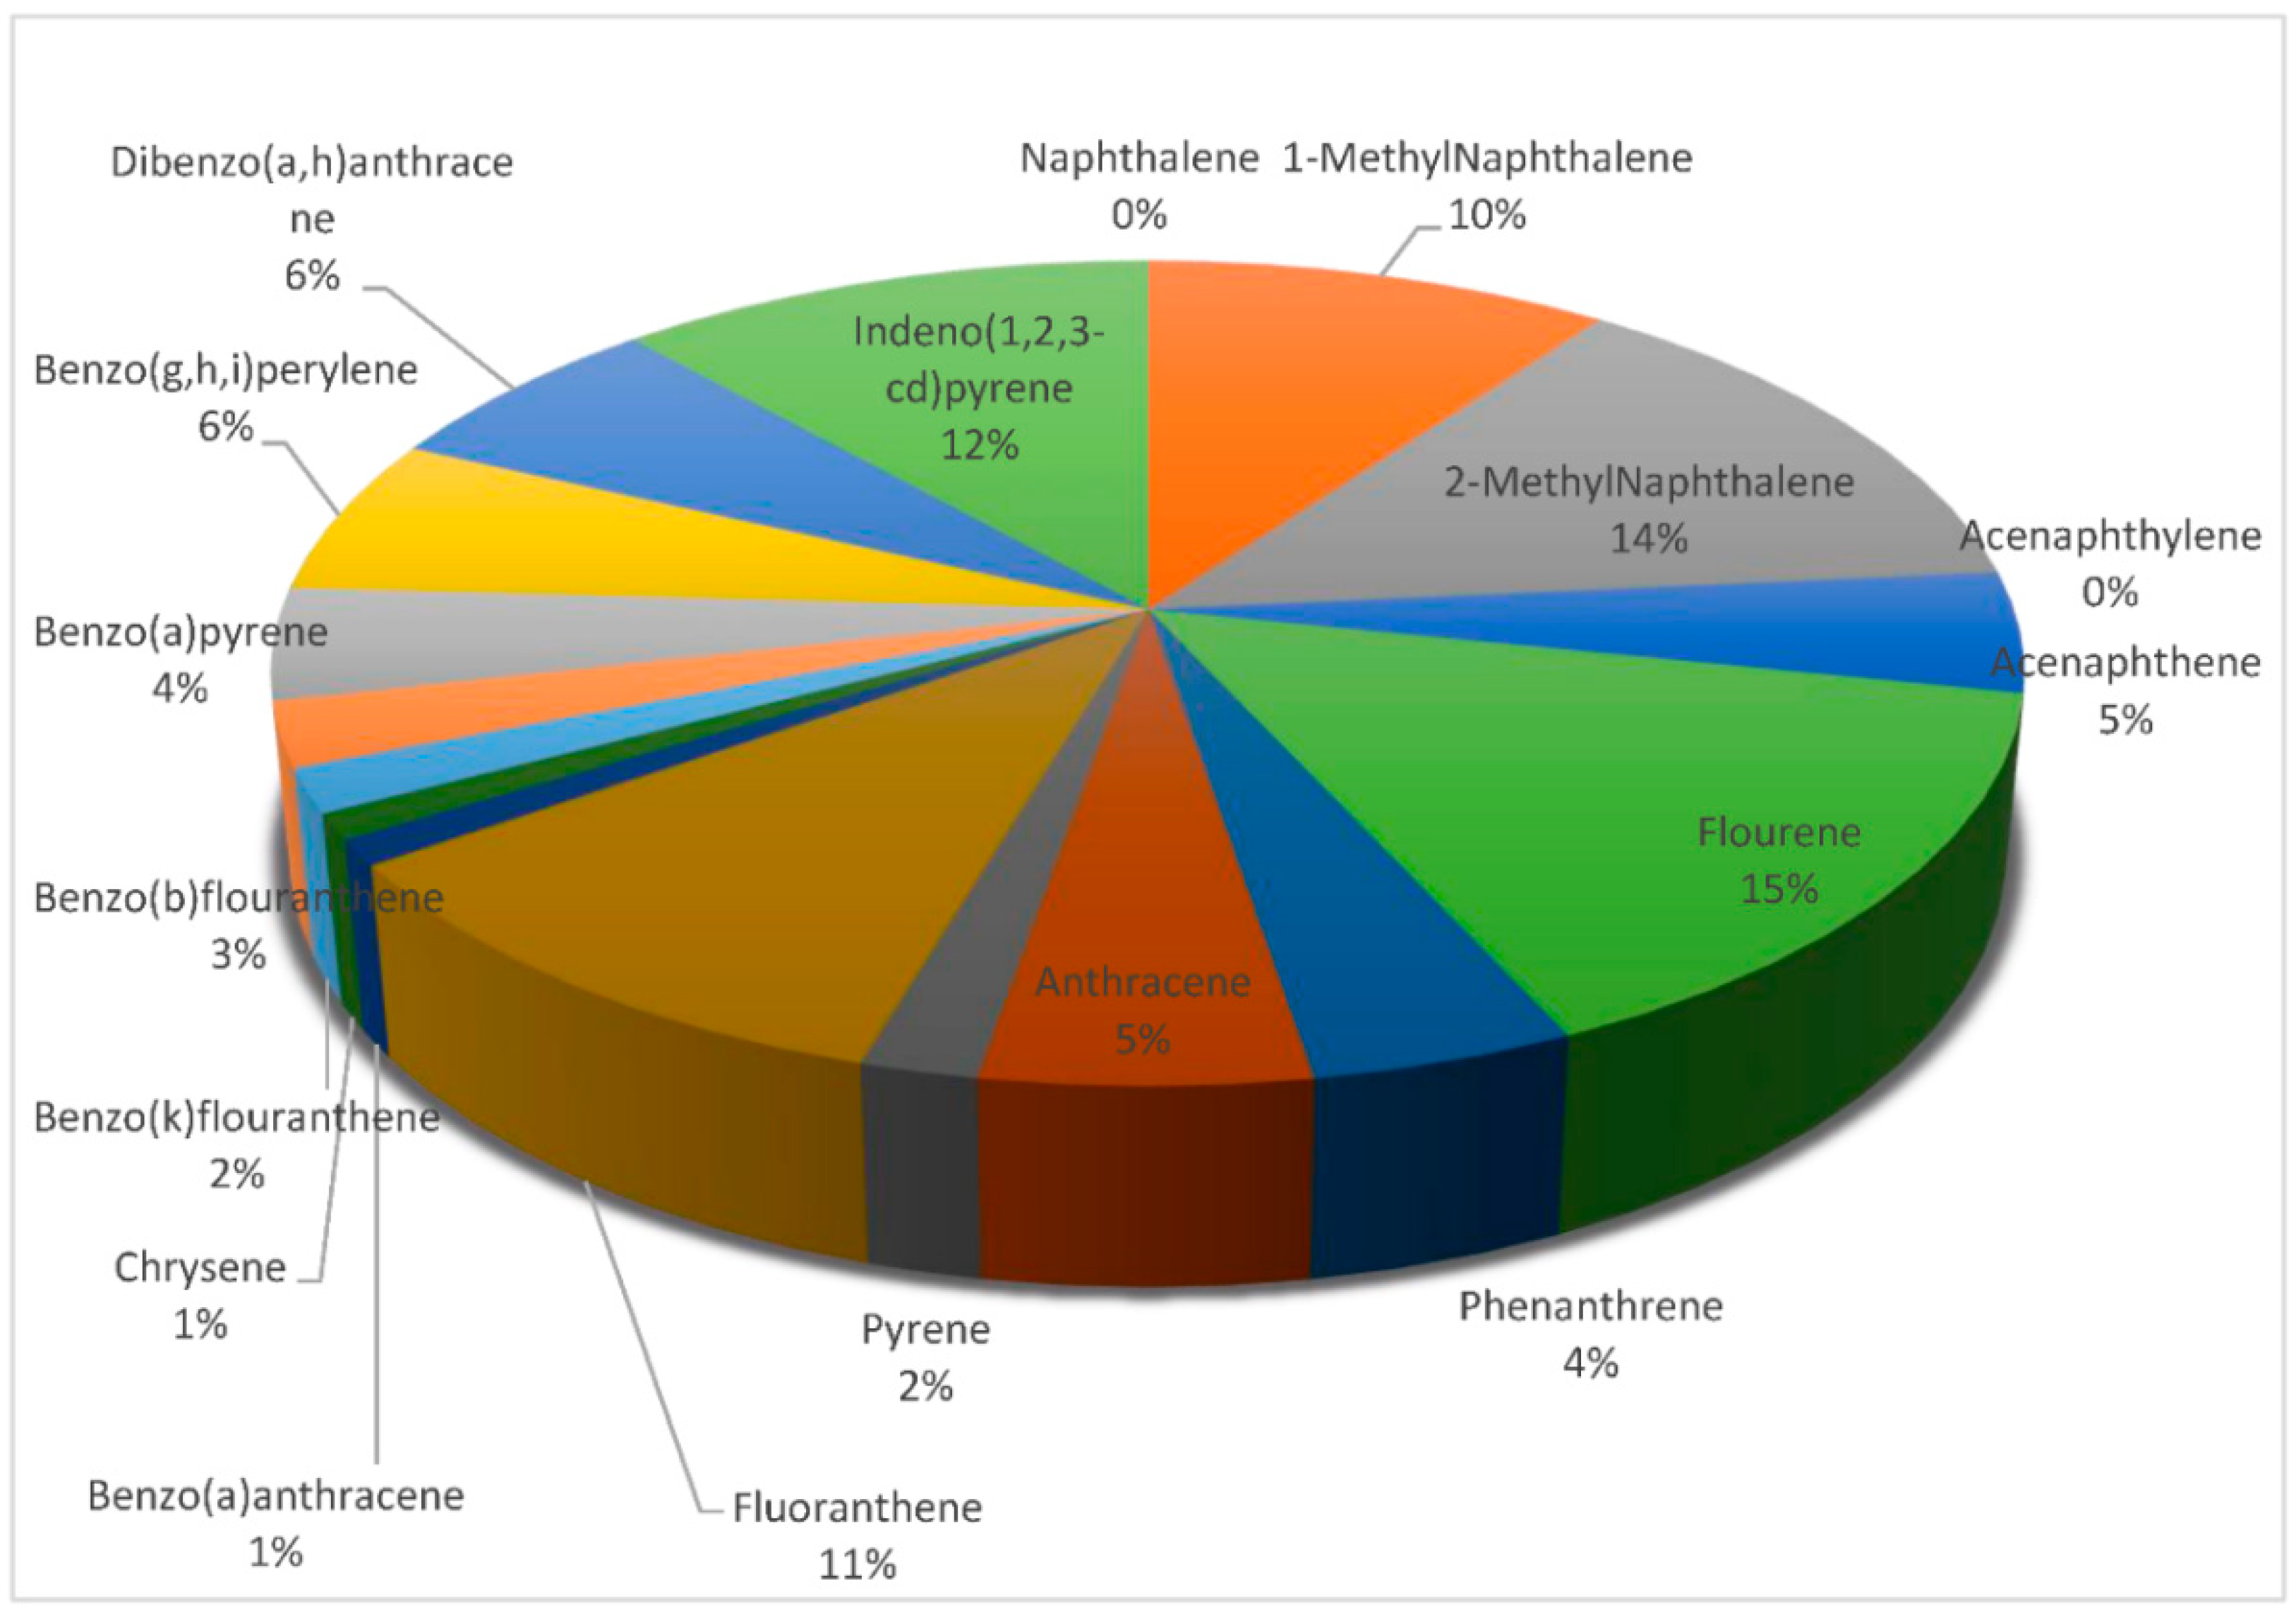
3.4. Contributions of the PAHs Components in Soil, Sediment and Fish Samples

Figure 7 shows the concentrations of the PAHs in all the samples, while Figure 8 and Figure 9 provide the percentage contributions of the PAHs components in soil and sediment samples and Figure 10 gives the percentage composition of polycyclic aromatic hydrocarbon components in the fish sample. Flouranthrene (18%) has the highest percentage contribution in the soil samples, followed by flourene with 13%, and the least were naphthalene, acenaphthalene, and others with 0%. In the sediment samples, the PAHs component with the highest was contribution was flourene (15%), followed by 2-Methynaphthalene (14%), while the least was naphthalene (0%). The highest % composition from the fish sample was 1-Methylnaphthalene (25%), 2-Methylnaphthalene was 19%, and the least was 0% for acenaphthylene and others.

4. Conclusions

The study revealed the presence of PAHs in the soil, sediment, and fish samples in varying concentrations. Some PAHs components detected in the soil samples were below the detection limit of the instrument in the sediment samples and the fish sample. Naphthalene was detected in the fish sample but was below detection limit in the soil and sediment samples while some components detected in the soil and sediment samples were below detection limit in the fish sample. The summation of the total PAHs components in the fish sample was the highest, meaning that it accumulates the PAHs. The concentrations of PAHs in the soil samples were higher than the sediment samples.
It is going to be of necessity to further carry out research by increasing the sampling stations to cut across the communities around the river, which will give room for the application of more environmental assessments such as risk assessment, pollution index, and source identification to further discuss health and ecological implications.

Author Contributions

Conceptualization, A.A. and F.E.O.; methodology, A.A. and J.E.U.; validation, A.A., J.E.U. and F.E.O.; investigation, A.A.; writing-original draft preparation, A.A.; writing review and editing, A.A. and J.E.U.; supervision, J.E.U. and F.E.O.; project administration, A.A., J.E.U. and F.E.O. All authors have read and agreed to the published version of the manuscript.

Funding

This research received no external funding.

Institutional Review Board Statement

Not applicable.

Informed Consent Statement

Not applicable.

Data Availability Statement

The data presented in this study are available on request from the corresponding author.

Acknowledgments

The authors acknowledged A.A. Ibitoye of the Federal University of Technology, Julius Okojie Central Research Laboratory, Akure (FUTA), Nigeria for his technical assistance.

Conflicts of Interest

The authors declare no conflict of interest.

Appendix A

Table A1. Result of polycyclic aromatic hydrocarbons (PAHs) of soil, sediment, and fish samples.
S/NComponentsSO1 (µg/kg)SO2 (µg/kg)SE1 (µg/kg)SE2 (µg/kg)F1 (µg/kg)
1.Naphthalene0.00000.00000.00000.00000.0529
2.1-MethylNaphthalene0.03070.00000.01010.01520.0746
3.2-MethylNaphthalene0.02820.02500.01470.01960.0574
4.Acenaphthylene0.00000.00000.00000.00000.0000
5.Acenaphthene0.00650.00950.00330.00870.0272
6.Flourene0.01360.05060.00860.02940.0210
7.Phenanthrene0.00940.01550.00390.00690.0087
8.Anthracene0.00980.01230.00700.00640.0062
9.Pyrene0.00480.00670.00190.00280.0024
10.Fluoranthene0.04400.04900.01260.01430.0000
11.Benzo(a)anthracene0.00270.00410.00100.00160.0000
12.Chrysene0.00830.01930.00260.00000.0000
13.Benzo(k)flouranthene0.00030.00550.00080.00360.0032
14.Benzo(b)flouranthene0.00140.00060.00230.00170.0009
15.Benzo(a)pyrene0.01020.00840.00750.00360.0070
16.Benzo(g,h,i)perylene0.04630.02300.00710.00840.0003
17.Dibenzo(a,h)anthracene0.00000.00000.01630.00000.0001
18.Indeno(1,2,3-cd)pyrene0.02270.04060.00540.02390.0385
Total (µg/kg)0.2390.2700.1050.1460.300
SO1—Soil sample 1, SO2—Soil sample 2, SE1—Sediment sample 1, SE2—Sediment sample 2, F1—Fish sample.

References

  1. Zheng, H.; Kang, S.; Chen, P.; Li, Q.; Tripathee, L.; Maharjan, L.; Guo, J.; Zhang, Q.; Santos, E. Sources and spatio-temporal distribution of aerosol polycyclic aromatic hydrocarbons throughout the Tibetan Plateau. Environ. Pollut. 2020, 261, 114144. [Google Scholar] [CrossRef] [PubMed]
  2. Li, C.; Cui, X.Y.; Fan, Y.Y.; Teng, Y.; Nan, Z.R.; Ma, L.Q. Tenax as sorption sink for in vitro bio-accessibility measurement of polycyclic aromatic hydrocarbons in soils. Environ. Pollut. 2015, 196, 47–52. [Google Scholar] [CrossRef] [PubMed]
  3. Cui, X.Y.; Xiang, P.; He, R.W.; Juhasz, A.; Ma, L.Q. Advances in in vitro methods to evaluate oral bioaccessibility of PAHs and PBDEs in environmental matrices. Chemosphere 2016, 150, 378–389. [Google Scholar] [CrossRef] [PubMed]
  4. Banger, K.; Toor, G.S.; Chirenje, T.; Ma, L. Polycyclic aromatic hydrocarbons in urban soils of different land uses in Miami, Florida. Soil Sediment Contam. 2010, 19, 231–243. [Google Scholar] [CrossRef]
  5. Gan, S.; Lau, E.V.; Ng, H.K. Remediation of soils contaminated with polycyclic aromatic hydrocarbons (PAHs). J. Hazard. Mater. 2009, 172, 532–549. [Google Scholar] [CrossRef]
  6. Lawal, T.A. Polycyclic aromatic hydrocarbons. A review. Cogent Environ. Sci. 2017, 3, 1339841. [Google Scholar] [CrossRef]
  7. Gao, P.; da Silva, E.; Hou, L.; Denslow, N.D.; Xiang, P.; Ma, L.Q. Human exposure to polycyclic aromatic hydrocarbons: Metabolomics perspective. Environ. Int. 2018, 119, 466–477. [Google Scholar] [CrossRef]
  8. Kuppusamy, S.; Thavamani, P.; Venkateswarlu, K.; Lee, Y.B.; Naidu, R.; Megharaj, M. Remediation approaches for polycyclic aromatic hydrocarbons (PAHs) contaminated soils: Technological constraints, emerging trends and future directions. Chemosphere 2016, 168, 944–968. [Google Scholar] [CrossRef] [PubMed]
  9. Yu, W.; Liu, R.; Wang, J.; Xu, F.; Shen, Z. Source apportionment of PAHs in surface sediments using positive matrix factorization combined with GIS for the estuarine area of the Yangtze River, China. Chemosphere 2015, 134, 263–271. [Google Scholar] [CrossRef]
  10. Hussein, I.A.; Mona, S.M.M. A review on polycyclic aromatic hydrocarbons: Source, environmental impact, effect on human health and remediation. Egypt. J. Pet. 2016, 25, 107–123. [Google Scholar]
  11. Lang, Y.H.; Li, G.L.; Wang, X.M.; Peng, P. Combination of Unmix and PMF receptor model to apportion the potential sources and contributions of PAHs in wetland soils from Jiaozhou Bay, China. Mar. Pollut. Bull. 2015, 90, 129–134. [Google Scholar] [CrossRef] [PubMed]
  12. Botkin, B.; Keller, E. Environmental Science-Earth as a Living Planet, 9th ed.; John Wiley & Sons: Hoboken, NJ, USA, 2014. [Google Scholar]
  13. Feng, C.; Luo, Q.; Wang, Z. Concentration levels and potential ecological risks of polycyclic aromatic hydrocarbons in Chinese rivers. Water Qual. Exp. Health 2009, 1, 105–113. [Google Scholar] [CrossRef]
  14. Srogi, K. Monitoring of environmental exposure to polycyclic aromatic hydrocarbons: A review. Environ. Chem. Lett. 2007, 5, 169–195. [Google Scholar] [CrossRef] [Green Version]
  15. Wang, X.T.; Miao, Y.; Zhang, Y.; Li, Y.C.; Wu, M.H.; Yu, G. Polycyclic aromatic hydrocarbons (PAHs) in urban soils of the megacity Shanghai: Occurrence, source apportionment and potential human health risk. Sci. Total Environ. 2013, 447, 80–89. [Google Scholar] [CrossRef] [PubMed]
  16. Joseph, L.; Paulose, S.V.; Cyril, N.; Santhosh, S.K.; Varghese, A.; Nelson, A.B.; Kunjankutty, S.V.; Kasu, S. Organochlorine pesticides in the soils of Cardamom Hill Reserve (CHR), Kerala, India: Geo spatial distribution, ecological and human health risk assessment. Toxicol. Environ. Chem. 2020, 2, 1–11. [Google Scholar] [CrossRef]
  17. Mahmoud, A.A.; Abbas, L.A. Study of polycyclic aromatic hydrocarbons (PAHs) in soil samples from Al-Ahdab oil field in Waset Region, Iraq. Toxin Rev. 2016, 35, 69–76. [Google Scholar]
  18. Orecchio, S.; Papuzza, V. Levels, fingerprint and daily intake of polycyclic aromatic hydrocarbons (PAHs) in bread baked using wood as fuel. J. Hazard. Mater. 2009, 164, 876–883. [Google Scholar] [CrossRef] [PubMed]
  19. Lau, E.V.; Gan, S.; Ng, H.K. Extraction techniques for polycyclic aromatic hydrocarbons in soils. Int. J. Anal. Chem. 2010, 2010, 398381. [Google Scholar] [CrossRef] [PubMed]
  20. Jiao, H.H.; Rui, X.P.; Wu, S.H.; Bai, Z.H.; Zhuang, X.L.; Huang, Z.B. Polycyclic aromatic hydrocarbons in the Dagang Oilfield (China): Distribution, sources, and risk assessment. Int. J. Environ. Res. Public Health 2015, 12, 5775–5791. [Google Scholar] [CrossRef] [PubMed] [Green Version]
  21. Sun, C.; Zhang, J.; Ma, Q.; Chen, Y. Human Health and Ecological Risk Assessment of 16 Polycyclic Aromatic Hydrocarbons in Drinking Source Water from a Large Mixed-Use Reservoir. Int. J. Environ. Res. Public Health 2015, 12, 13956–13969. [Google Scholar] [CrossRef] [PubMed] [Green Version]
  22. Asagbra, M.C.; Adebayo, A.S.; Anumudu, C.I.; Ugwumba, O.A.; Ugwumba, A.A.A. Polycyclic aromatic hydrocarbons in water, sediment and fish from the Warri River at Ubeji, Niger Delta, Nigeria. Afr. J. Aquat. Sci. 2015, 40, 193–199. [Google Scholar] [CrossRef]
  23. Li, Q.; Wang, N.; Wu, X.; Pu, J.; He, J.; Zhang, C. Sources and distribution of polycyclic aromatic hydrocarbons of different glaciers over the Tibetan Plateau. Sci. China Earth Sci. 2011, 54, 1189–1198. [Google Scholar] [CrossRef]
  24. Ogunfowokan, A.O.; Asubiojo, O.I.; Fatoki, O.S. Isolation and determination of polycyclic aromatic hydrocarbons in surface runoff and sediments. Water Air Soil Pollut. 2003, 147, 245–261. [Google Scholar] [CrossRef]
  25. Irenosen, G.O.; Egbulefu, A.V.I.; Korede, A.O. The Microbial status and physico-chemical pollutants studies of rivers Owan and Evbiobe in Edo State, Nigeria. Sci. J. Anal. Chem. 2019, 7, 57–64. [Google Scholar] [CrossRef]
  26. Lasheen, M.R.; Abdel-Gawad, F.K.; Alaneny, A.A.; Abd El Bary, H.M. Fish as bioindicators in aquatic environmental pollution assessment: A case study in Abu-Rawasharea, Egypt. World Appl. Sci. J. 2012, 19, 265–275. [Google Scholar]
  27. Adeyemi, S.O.; Bankole, N.O.; Adikwu, I.A.; Akombu, P.M. Food and feeding habits of some commercially important fish species in Gbedikere Lake, Bassa, Kogi State, Nigeria. Int. J. Lakes Rivers 2009, 2, 31–36. [Google Scholar]
  28. US Environmental Protection Agency (USEPA). Analysis of Polynuclear Aromatic Hydrocarbons; Method 8100; US Environmental Protection Agency: Washington, DC, USA, 1986.
  29. Muntean, N.; Muntean, E.; Duda, M.M. Polycyclic Aromatic Hydrocarbons in Soil. Proenvironment 2015, 8, 285–289. [Google Scholar]
  30. Kim, L.; Jeon, H.; Kim, Y.; Yang, S.; Choi, H.; Kim, T.; Lee, S. Monitoring polycyclic aromatic hydrocarbon concentrations and distributions in rice paddy soils from Gyeonggi-do, Ulsan, and Pohang. Appl. Biol. Chem. 2019, 62, 18. [Google Scholar] [CrossRef] [Green Version]
  31. Sun, C.; Zhang, J.; Ma, Q.; Zhang, F.; Chen, Y. Risk assessment of polycyclic aromatic hydrocarbons (PAHs) in sediments from a mixed-use reservoir. Hum. Ecol. Risk Assess. Int. J. 2016, 22, 447–459. [Google Scholar] [CrossRef]
  32. Mirza, R.; Mohammadi, M.; Faghiri, I.; Abedi, E.; Ali, F.; Ali, A.; Mohammad, A.Z. Source identification of polycyclic aromatic hydrocarbons (PAHs) in sediment samples from the northern part of the Persian Gulf, Iran. Environ. Monit. Assess. 2014, 186, 7387–7398. [Google Scholar] [CrossRef]
  33. Yang, Y.; Woodward, L.A.; Li, Q.X.; Wang, J. Concentrations, Source and Risk Assessment of Polycyclic Aromatic Hydrocarbons in Soils from Midway Atoll, North Pacific Ocean. PLoS ONE 2014, 9, e86441. [Google Scholar] [CrossRef]
  34. Agnieszka, B.; Marek, T.; Krzysztof, U.; Agnieszka, K.; Iwona, S. Concentration, sources and risk assessment of PAHs in bottom sediments. Environ. Sci. Pollut. Res. 2017, 24, 23180–23195. [Google Scholar]
  35. Zhao, Z.; Qin, Z.; Cao, J.; Xia, L. Source and Ecological Risk Characteristics of PAHs in Sediments from Qinhuai River and Xuanwu Lake, Nanjing, China. J. Chem. 2017, 2017, 3510796. [Google Scholar] [CrossRef] [Green Version]
  36. Oyo-Ita, O.E.; Offem, J.O.; Ekpo, B.O.; Adie, P.A. Anthropogenic PAHs in mangrove sediments of the Calabar River, SE Niger Delta, Nigeria. Appl. Geochem. 2013, 28, 212–219. [Google Scholar] [CrossRef]
  37. Munyengabe, A.; Mambanda, A.; Moodley, B. Polycyclic Aromatic Hydrocarbons in Water, Soils and Surface Sediments of the Msunduzi River. J. Environ. Anal. Chem. 2017, 4, 227. [Google Scholar] [CrossRef]
  38. Tongo, I.; Etor, E.E.; Ezemonye, L. Human Health Risk Assessment of PAHs in Fish and Shellfish from Amariaria Community, Bonny River, Nigeria. J. Appl. Sci. Environ. Manag. 2018, 22, 731–736. [Google Scholar] [CrossRef]
  39. Fair, P.A.; White, N.D.; Wolf, B.; Arnott, S.A.; Kannan, K.; Karthikraj, R.; Vena, J.E. Persistent organic pollutants in fish from Charleston Harbor and tributaries, South Carolina, United States: A risk assessment. Environ. Res. 2018, 167, 598–613. [Google Scholar] [CrossRef]
  40. Adeniyi, A.A.; Yusu, K.A.; Okedeji, O.O. Assessment of the exposure of two fishes to metal pollution in Ogun river catchments, Ketu, Lagos, Nigeria. J. Environ. Assess. Monit. 2008, 137, 451–458. [Google Scholar] [CrossRef]
Figure 1. Map of the study area and sampling points. Source: This study.
Environsciproc 07 00011 g001
Figure 2. Concentration of PAHs (µg/kg) components in the soil sample from location 1.
Environsciproc 07 00011 g002
Figure 3. Concentration of PAHs components (µg/kg) in the soil sample from location 2.
Environsciproc 07 00011 g003
Figure 4. Concentration of PAHs components (µg/kg) in the sediment sample from location 1.
Environsciproc 07 00011 g004
Figure 5. Concentration of PAHs components (µg/kg) in the sediment sample from location 2.
Environsciproc 07 00011 g005
Figure 6. Concentration of PAHs components (µg/kg) in fish sample.
Environsciproc 07 00011 g006
Figure 7. Concentrations (µg/kg) of the polycyclic aromatic hydrocarbons (PAHs) in the samples.
Environsciproc 07 00011 g007
Figure 8. Percentage contributions of PAHs in the soil samples.
Environsciproc 07 00011 g008
Figure 9. Percentage contributions of PAHs in the sediment samples.
Environsciproc 07 00011 g009
Figure 10. Percentage concentrations of the PAHs in the fish sample.
Environsciproc 07 00011 g010
Publisher’s Note: MDPI stays neutral with regard to jurisdictional claims in published maps and institutional affiliations.

