Abstract
Owing to the effect on people, livestock, and materials, air pollution is a global hazard. To this end, stakeholders have taken on the challenge of quantifying the environment with the use of tools and eventually using the data produced to provide solutions to the problems. However, low-cost sensors and the IoT have come to the rescue due to the high cost and operational complexity of equipment and methodologies in environmental monitoring. They are relatively inexpensive and reliable. It is on this assumption that we have decided to use the World Air Quality satellite data supplied by air matters.com. This study is a 40-day preliminary work in which air quality (AQI, PM2.5, PM10, NO2, CO, SO2, and O3) and meteorological (temperature, humidity, and wind speed) parameters were monitored. The data collected are for five locations in Lagos State, Nigeria (Ojodu, Opebi, Ikeja, Maryland, and Eti-Osa). The data obtained were subjected to basic descriptive, multivariate and time series statistical analyses. The findings showed that the AQI of all locations presented the levels of contamination as 'Unhealthy for Vulnerable Groups', there were relationships between the parameters monitored and meteorological influences, and the effects of natural and man-made activities may be the sources of the elevated pollutants throughout the locations.
1. Introduction
Urban air pollution is typically caused by a wide variety of emission sources, including commercial/residential fuel traffic, manufacturing and combustion, and consists of a complex mix of gaseous and particulate air pollutants such as nitrogen dioxide (NO2), sulfur dioxide (SO2), fine particulate matter (PM2.5) and ground-level ozone (PM2.5) (defined as aerodynamic diameter particulate matter (PM2.5). Air quality has been a big concern in many countries. According to the World Health Organization (WHO) [1], more than seven million people die each year due to this disease, and more than 80% of the population of urban areas live in places where air quality increases above WHO guideline limits [2].
Growing use is being made of low-cost sensors, satellite modelling and citizen scientists, nonscientists interested in specific issues who collect or analyze data to contribute to scientific research, or advocate for environmental or public health improvements. Several organizations such as New York City Community Air Survey (NYCCAS), AirVisual, and Air Matters, just to name a few, have developed in this field of community engagement and community-based participatory research by developing air quality toolkits for 'citizen-science' and AQI modelled using satellite to accessible pollution source data, using fresh, low-cost air pollution surveys to construct community air pollution surveys.
According to Iskandaryan et al. [3] and Giffinger et al. [4], a smart city is a city in which there are six main components, including a smart economy, smart transport, smart environment, smart citizens, smart life, and smart management, or the use of smart computing technologies to render critical infrastructure components and services of a city, including city governance, education, and smart management. The availability of data produced by sensors is a significant characteristic of smart cities [5,6]. In other words, due to the above explanation, there is the aspiration of Lagos becoming a smart town in Nigeria.
In Nigeria, Nigerian scientists and their international collaborators have taken a variety of air quality measurements [7,8,9]. These are, however, limited-point measurements around the city (background, commercial, roadways, and informal settlement households) and limited numbers of contaminants, primarily PM2.5 and PM10. In certain cases, PM levels appear to be far above the World Health Organization (WHO) 24 h average guideline. We used standard AQI-modelled satellite data from Lagos, Nigeria's former headquarters, in this study to monitor air quality. It is expected that the study will last 24 months. Consequently, the purpose of the study was to carry out a 40-day preliminary air quality assessment (PM2.5, PM10, CO, NO2, SO2, and O3) at five separate locations (Opebi, Ojudu, Ikeja, Maryland, and Eti-Osa) in Lagos State, Nigeria, and to assess the effect of meteorological parameters (wind speed, temperature and humidity) on air quality.
2. Experiments
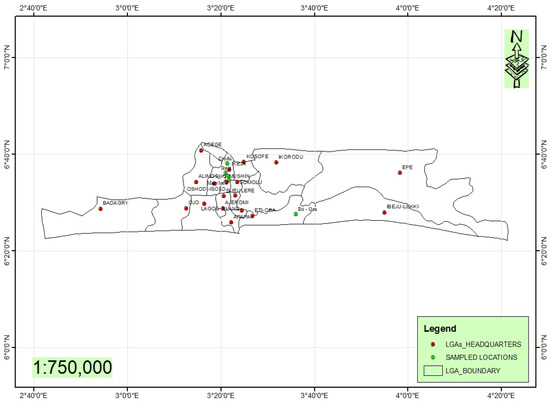
Air quality was assessed in this study using regular AQI satellite data from Air Matters [10] at five locations in Lagos State, Nigeria (elevation: 38 m, latitude: 06 35 N, longitude: 003 20 E) from the 1st of October and 9 November 2020. The stations are Ojodu (6.625, 3.354); Ikeja (6.601, 3.351); Eti-Osa (6.458, 3.601); Maryland (6.571, 3.372); and Opebi (6.589, 3.361) (Figure 1). A tropical savanna climate with dry and wet sessions (Cfa following Köppen climate classification) characterizes the study cycles in Lagos.

Figure 1.
The sampling points in the different Local Government Areas (LGAs).
Over a year in Lagos, the average temperature is 27.2 °C. On average, the warmest month is February, with an average temperature of 28.9 °C. On average, the coolest month is August, with an average temperature of 25 °C. Over a year in Lagos, the total amount of precipitation is 1506.2 mm. On average, the month with the most rainfall is June, with 315 mm of precipitation. On average, the month with the least rainfall is January, with an average of 12.7 mm. There is an average of 53.0 days of precipitation, with 9.0 days being the most precipitation in September and 1.0 days being the least precipitation in January. There is an average of 53.0 days of rain in terms of liquid precipitation, with the most rain occurring in September with 9.0 days of rain, and the least rain occurring in January with 1.0 days of rain [11].
Air-quality.com (powered by Air Affairs) is a low-cost real-time, citizen-based PM sensor network deployed in more than 180 countries and regions (https:/air-quality.com). Air-quality.com provides measurements via satellite images of contaminants (PM2.5, PM10, CO, NO2, SO2, O3) and meteorological parameters (humidity, wind speed and temperature). In this analysis, measurements of hourly pollutants and meteorological parameters were used. In this research, the available data on AQI, pollutants and meteorological parameters in Ikeja, Ojodu, Opebi, Eti-Osa, and Maryland were computed and statistically analyzed using Minitab software version 16 (descriptive, Pearson correlation, box map, and times series).
3. Results
Table 1 shows the mean values for AQI, which are as follows: Ikeja (127.88), Opebi (141.82), Ojodu (109.88), Eti-Osa (101.4) and Maryland (127.88). The health details for the locations ranged from ‘good’ to ‘very unhealthy’. The mean concentration of PM2.5 and PM10 over Ikeja was between 20–123 μg/m3 and 30–176 μg/m3; Maryland was between 22–120 μg/m3 and 33–173 μg/m3; Ojodu was between 17 μg/m3–81 μg/m3 and 27–121 μg/m3; and Eti-Osa was between 5 μg/m3–212 μg/m3 and 9 μg/m3–298 μg/m3. In Opebi, however, PM2.5 and PM10 were between 26–163 μg/m3 and 40–241 μg/m3, respectively. In all the locations, the mean values of O3 are as follows: 32.52, 38.7, 36.2, 37.85, and 36.13 μg/m3 for Ikeja, Maryland, Opebi, Ojodu, and Eti-Osa. Opebi had the highest value (3179 μg/m3), followed by Eti-Osa (2978 μg/m3), and the lowest value was for Maryland (1943 μg/m3). The coefficient variations of NO2 and SO2 varies from 61.63–77.06% to 26.86–37.36%, respectively, in all locations, with the exception of Eti-Osa with variations of 120.97% and 64.84%, respectively. Table 1 also indicates the variations (mean) in temperature (23.5–28.33), wind speed (3.79–13.73), and relative humidity (82.75–93.37).

Table 1.
Summary of the data in all the five locations.
For the data collected, Pearson correlation statistics were applied. Strong correlations (r) were observed in Eti-Osa AQI, PM2.5, PM10 at above 0.90. In other locations there were also strong correlations in AQI, PM2.5, PM10, CO, and O3 at >0.84. (Table 2). The gases and the values of the PM are negatively correlated. Strong correlations were in the meteorological parameters and the pollutants.

Table 2.
Pearson correlation coefficients of the locations.
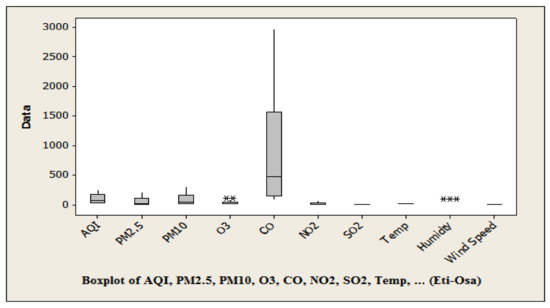
Box and whisker plots are shown in Figure 2 to display the data distribution in terms of the lower quartile, upper quartile, median, minimum and maximum in each of the five locations. This was carried out to demonstrate the difference in regular concentrations of air pollutants. A brief sketch of the distribution of the underlying data is basically shown in the box plot.

Figure 2.
The box plot of the locations.
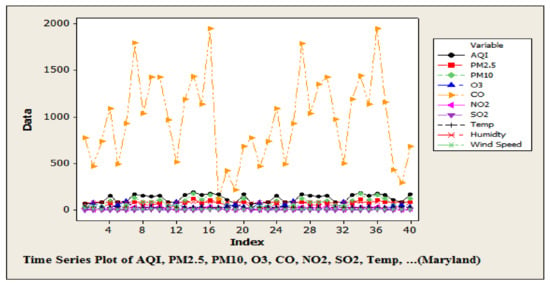
A time series plot is depicted in Figure 3. From the graph, it could be deduced that there was variability in this pollutants data with time. The variability is much lower near the valleys than near the peaks.

Figure 3.
The time series of the locations.
The Principal Component Analysis (PCA) of AQI, the pollutants, and meteorological factors over the data set from the locations are depicted in Table 3. For Eti-Osa, Ojodu, Maryland, Ikeja, and Opebi, the maximum variance defined for PCs was 70.42%, 35.9%, 50.6%, 48.8%, and 52.3%. Eight PCs were obtained in which the highest variance was clarified by PC1 with high loads from PM2.5 and PM10. PC2 and PC3 contain pollutant mixed loadings from PM, SO2, NO2, temperature and humidity.

Table 3.
Principal Component Analysis (PCA) of the data from the different locations.
4. Discussion
The AQI obtained in this study is far less than what was obtained in Port Harcourt by Akinfolarin et al. [12] Their results depicted ‘Very unhealthy’ to ‘dangerous’, while ours was from ‘good’ to ‘unhealthy’. In this analysis, most of the PM2.5 findings were above the NAAQS limit of 35 μg/m3 [9]. Likewise, most of the findings on PM10 in this study are above the limit of 150 μg/m3. Additionally, the NO2 levels are well above the recommended 1-hour mean (0.5 μg/m3) of the Federal Ministry of Environment (FMEnv) Nigeria, but less than the recommended 24-hour WHO limit (40 μg/m3). The SO2 values obtained were lower than the WHO limit suggested for 24 h (500 μg/m3), and the CO values were also well above the WHO limit of 55 μg/m3 for 8 hours. The high results show that secondary pollutant(s) can pollute water sources and soil if the elevated contaminants are washed down by rainfall. This is the case with HNO3-forming NO2, which acidifies surface water, soil water and soil water. The burning of fossil fuels, vehicular movements, high population rise, rapid economic development, and resuspended soil dust are the contributing variables of airborne contaminants in different cities of the world [13]. There were relationships between the meteorological factors. The coefficients of correlation obtained may be due to the washout phase as rain indicates an effect of wet deposition on particulate. Temperature can influence the formation of particles and gases, so the photochemical reaction between precursors can be encouraged by temperature.
The PCA shows that the CO, NO2 and SO2 indicated biomass burning and vehicular emissions. This implies that the contributions of CO and NO2 to this portion comes from emissions from vehicles. It is proposed that contaminants can be released from vehicle exhausts [14,15] and from vehicle interior sections [16], suggesting that vehicle emissions are the dominant sources. PC2 contains heavy pollutant loads, which may be from the burning of biomass. The contaminants may be produced from the burning of plastic and waste too. It has been stated that pollution sources can be from road side litter and landfill trash burning. [15,17]. The PCA suggested that the predominant sources in the study areas, with the exception of Eti-Osa near the lagoon, were vehicular, dumping and burning of wastes, and industrial sources.
5. Conclusions
This study shows preliminary results (40 days) of a year-long monitoring study of Lagos, Nigeria. The data generated in this study were received via a satellite model provided by Air Quality.com. The AQI, pollutants (PM2.5, PM10, O3, CO, SO2, and NO2), and meteorological factors were used for the assessment. It was observed the AQI values were high, translating into ‘Very Unhealthy’, but most of the results in Eti-Osa area were ‘good’ due to its location being near a lagoon. Most of the results for the pollutants were above the WHO, NAAQS, and FMEnv 1-hour mean limits. The Pearson correlation coefficient revealed great relationships between the pollutants and the meteorological factors. In conclusion, it was found that elevated concentrations of the pollutants were caused by man-made activities such as vehicular movements, burning of biomass and wastes, industrial, and national demonstration by the youths of the country. The is no doubt that the locations are in danger in terms of air pollution, efforts to reduce the menace and the aftermath effects should be put in place by all stakeholders (government, residents, Non-governmental Organisations (NGOs), environmental scientists, journals, and philanthropists, just to mention a few).
Author Contributions
F.O.A. and U.D. conceived and designed the experiments; S.A., A.A. and K.M.A. produced the map of the location and the statistical analyses. K.M.A. performed the experiments; F.O.A. wrote the paper. All authors have read and agreed to the published version of the manuscript.
Institutional Review Board Statement
Not applicable.
Informed Consent Statement
Not applicable.
Data Availability Statement
The data presented in this study are available on request from the corresponding author.
Acknowledgments
The authors wish to acknowledge Air Quality.com for making the data available for use.
Conflicts of Interest
The authors declare no conflict of interest.
Abbreviations
The following abbreviations are used in this manuscript:
| AQI | Air Quality Index |
| IoT | Internet of Things |
| WHO | World Health Organization |
| NGO | Nongovernmental organization |
| NAAQS | National Ambient Air Quality Standards |
| NYCCAS | New York City Community Air Survey |
| PCA | Principal component analysis |
| FMEnv | Federal Ministry of Environment |
References
- World Health Organization (WHO). RHN Workshop on Environment and Health (Air Pollution and Active Mobility) Ljubljana, Slovenia 30 November 2018; p. 39. Available online: https://www.euro.who.int/en/about-us/networks/regions-for-health-network-rhn/activities/network-updates/rhn-workshop-on-environmentand-health-air-pollution-and-active-mobility-at-the-11th-european-public-health-conference (accessed on 26 September 2020).
- Air Pollution. Available online: https://www.who.int/health-topics/air-pollution#tab=tab_1/ (accessed on 13 March 2020).
- Iskandaryan, D.; Ramos, F.; Trilles, S. Air Quality Prediction in Smart Cities Using Machine Learning Technologies based on Sensor Data: A Review. Appl. Sci. 2020, 10, 2401. [Google Scholar] [CrossRef]
- Giffinger, R.; Fertner, C.; Kramar, H.; Kalasek, R.; Pichler-Milanovi, C.N.; Meijers, E. Smart Cities: Ranking of European Medium-sized Cities. Vienna, Austria: Centre of Regional Science (srf), Vienna University of Technology. Available online: http://www.smart-cities.eu/download/smart_cities_fifinal_report.pdf (accessed on 31 March 2020).
- Trilles, S.; Calia, A.; Belmonte, Ó.; Torres-Sospedra, J.; Montoliu, R.; Huerta, J. Deployment of an open sensorized platform in a smart city context. Future Gener. Comput. Syst. 2017, 76, 221–233. [Google Scholar] [CrossRef]
- Granell, C.; Kamilaris, A.; Kotsev, A.; Ostermann, F.O.; Trilles, S. Internet of Things. In Manual of Digital Earth; Springer: Singapore, 2020; pp. 387–423. [Google Scholar]
- Daful, M.G.; Adewuyi, T.O.; Muhammad, M.N.; Oluwole, O.A.; Dadan-Garba, A.; Ezeamaka, C.K. Assessment of the Spatial Relationship between Air Pollutants in Kaduna Metropolis, Nigeria. J. Sustain. Dev. 2020, 13, 204–223. [Google Scholar] [CrossRef]
- Croitoru, L.; Chang, J.C.; Akpokodje, J. The Health Cost of Ambient Air Pollution in Lagos. J. Environ. Prot. 2020, 11, 753–765. [Google Scholar] [CrossRef]
- Osimobi, O.J.; Yorkor, B.; Nwankwo, C.A. Evaluation of daily pollutant standard index and air quality index in a university campus in Nigeria using PM10 and PM2.5 particulate matter. J. Sci. Technol. Environ. Inform. 2019, 07, 517–532. [Google Scholar] [CrossRef]
- Air-Quality.Com. Available online: https://airquality.com/place/nigeria/lagos/ba6302a2?lang=en&standard=aqius (accessed on 12 November 2020).
- CantyMedia, Lagos, Nigeria. Available online: https://www.weatherbase.com/weather/weather-summary.php3?s=10256&cityname=Lagos%2C+Lagos%C+Nigeria&units=metric (accessed on 23 October 2020).
- Kinfolarin, O.M.; Boisa, N.; Obunwo, C.C. Assessment of Particulate Matter-Based Air Quality Index in Port Harcourt, Nigeria. J. Environ. Anal. Chem. 2017, 4, 224. [Google Scholar] [CrossRef]
- Abulude, F.O.; Ndamitso, M.M.; Abdulkadir, A. Environmental Situation of an Agricultural Area in Akure, Nigeria, Based on Physico-Chemical Properties of Rainwater. Pollution 2018, 4, 317–325. [Google Scholar]
- Fu, P.Q.; Kawamura, K.; Pavuluri, C.M.; Swaminathan, Y.; Chen, J. Molecular characterization of urban organic aerosol in tropical India: Contributions of primary emissions and secondary photooxidation. Atmos. Chem. Phys. 2010, 10, 2663–2689. [Google Scholar] [CrossRef]
- Bahino, J.; Yoboué, V.; Galy-Lacaux, C.; Adon, M.; Akpo, A.; Keita, S.; Liousse, C.; Gardrat, E.; Chiron, C.; Ossohou, M.; et al. A pilot study of gaseous pollutants’ measurement (NO2, SO2, NH3, HNO3 and O3) in Abidjan, Côte d’Ivoire: Contribution to an overview of gaseous pollution in African cities. Atmos. Chem. Phys. 2018, 18, 5173–5198. [Google Scholar] [CrossRef]
- Haddad, E.I.; Marchand, N.; Dron, J.; Temime-Roussel, B.; Quivet, E.; Wortham, H.; Jaffrezo, J.L.; Baduel, C.; Voisin, D.; Besombes, J.L.; et al. Comprehensive primary particulate organic characterization of vehicular exhaust emissions in France. Atmos. Environ. 2009, 43, 6190–6198. [Google Scholar] [CrossRef]
- Simoneit, B.R.; Medeiros, P.M.; Didyk, B.M. Combustion products of plastics as indicators for refuse burning in the atmosphere. Environ. Sci. Technol. 2005, 39, 6961–6970. [Google Scholar] [CrossRef] [PubMed]
Publisher’s Note: MDPI stays neutral with regard to jurisdictional claims in published maps and institutional affiliations. |
© 2020 by the authors. Licensee MDPI, Basel, Switzerland. This article is an open access article distributed under the terms and conditions of the Creative Commons Attribution (CC BY) license (https://creativecommons.org/licenses/by/4.0/).