2. Material and Methods
The study area selected for this research covers parts of polar as well as non-polar regions. The craters chosen from the Northern and Southern poles include Gioja, an unnamed crater near Byrd referred to as Crater1, Haworth, and Nobile, respectively. The non-polar craters include Arago and Moltke, which takes an important aspect in the study of comparing polar and non-polar regions. The datasets used are acquired by Chandrayaan-1 and Lunar Reconnaissance Orbiter (LRO) Mini-SAR besides Digital Elevation Models (DEM) products from Terrain Mapping Cameras (TMC). The Mini-SAR of Chandrayaan-1 worked on 12.6 cm (S-band) wavelength, 75 m as its spatial resolution with 8 km swath, whereas LRO’s Mini-RF worked on two wavelength regions (S-band: 12.6 cm and X-band: 4.2 cm) with 30 m per pixel resolution and 6 and 4 km swath for S- and X-bands, respectively. The datasets used for this research study are given in
Table 1.
The data were obtained in SAR mode, which were formatted and stored in Planetary Data System (PDS) geosciences. The level-1 dataset products are level-1 Calibrated Data Records (CDRs), produced by ingesting the level-0 EDR products and associated level-0 ancillary files into the SAR processor. The level-1 CDRs are SAR images that have been radiometrically and polarimetrically calibrated. Each cross-product image file contains simple pixel lines, consisting of four 4-byte floating-point numbers. A typical Mini-SAR image strip consists of 16 bytes data in four channels of 4 bytes each given by |
Eн|
2, |
Ev|
2, Real |
Eн
Ev*| and Imaginary |
Eн
Ev*|. The four channels represent Horizontal (H) polarization, Vertical (V) polarization, Real (
Re), and Imaginary (
Im) part of cross-product intensity between Horizontal and Vertical signals [
5].
The Stokes vectors are measured from the architecture of hybrid polarimetry of the Mini-SAR dataset and can be given as follows:
Here, S1, S2, S3, and S4 are known as Stokes parameters, whereas Eн and Ev represent the horizontal and vertical polarization components of the electromagnetic field, respectively, and the ‘∗’ represents the complex conjugate of horizontal or vertical polarization components. The first parameter (S1) describes the total intensity of the backscattered field. The second parameter (S2) gives the difference between horizontal and vertical components of the polarized portion of the electromagnetic field. The third and fourth parameters (S3 and S4) are the real and imaginary parts, representing the cosine and sine of the average phase between the horizontally and vertically polarized components of the field. They are used to describe the polarization property of the backscattered wave.
The Stokes parameters are further used to derive Stokes-child parameters like the degree of polarization (
m), the relative phase between transmitted and received signals (
δ), and Poincare ellipticity (
χ). These parameters are responsible for exhibiting the scattering behavior of polarized waves and computed using Equation (2), Equation (3), and Equation (4), respectively.
Here, in the above equations,
S₁,
S₂,
S₃, and
S₄ are the Stokes parameters and
m is the degree of polarization. These parameters are used for polarimetric decomposition as well as the Circular Polarization Ratio (CPR) to detect the water ice regions inside the craters [
6].
The polarimetric analysis in the case of decomposition provides radar information by the scattering coherency. These techniques have also been useful for land and oceanic applications for compact polarimetric data. The
m-
δ technique was proposed and developed by Raney [
7]. In this technique, the degree of polarization is used to segment the total intensity into polarized and unpolarized components. The polarized part consists of surface and double-bounce scattering components and the unpolarized part is regarded as the volume scattering component. These components are given in Equation (5).
where
R represents Double-bounce scattering,
G represents Volume scattering, and
B represents Surface scattering. Surface scattering seems dominant in the case of the positive value of
δ; however, for the negative value of
δ double-bounce scattering is dominant. As for the volume scattering, the degree of polarization is multiplied by the total power intensity of the wave, as given in Equation (5).
The
m-
χ technique was also developed by Raney [
7] with the main objective to differentiate surface from double-bounce scattering. The Electric field loses its circularity for every piece of scattering, thus considered Poincare ellipticity. Similar to the
m-
δ technique, the polarized part of this technique is also divided into surface and double-bounce components, and the unpolarized part is used as a volume scattered component [
8]. It can be expressed as an equation using a color-coded plane where R, G, and B represent Double-bounce (Equation (6)), Volume (Equation (7)), and Surface (Equation (8)) scattering respectively.
The H-
α decomposition technique is based on the Eigenvalue and Entropy analysis of the target coherency matrix. Entropy (H) measures the randomness of unpolarized and random components of the backscattered wave. Eigenvalues and Eigenvectors define the magnitude of scattering and the type of scattering mechanism [
9]. This technique employs normalized Eigenvalues represented by probabilities for interpretation [
10]. Firstly, a 2 × 2 coherency matrix [
J] was generated, known as the Wolf coherency matrix, given in Equation (9). Each element of this matrix represents the intensity of the wave. The first matrix corresponds to the transmission of left circular polarization and reception in horizontal and vertical polarization and the second matrix is the representation of the generated coherency matrix in terms of Stokes parameters.
This coherency matrix [
J] is used to understand the polarization properties of the backscattered wave. The eigenvalues (λᵢ) are generated from this matrix as given in Equation (8) to embed it in the coherency matrix. Also, to obtain entropy (H), polarization states of the wave interpreted as probabilities (
Pᵢ) are estimated using Equation (10) and the value of alpha is derived from the Stokes parameters as given by Equation (11).
The matrix shown in the Equation (10) shows the decomposition in terms of polarization (H) and depolarization parameter (
α) [
9].
The mean alpha () calculated using Equation (12) is also used to characterize the scattering mechanism as done by other decomposition techniques. Different values are set to determine the scattering properties exhibited respectively where α → 0 corresponds to single-bounce scattering, α → corresponds to volume scattering, and α → corresponds to double-bounce scattering.
The stereographic Terrain Mapping Camera (TMC) ortho-imagery with a high spatial and altitude of 5 m resolution and with 10-bit quantization has been used for this study to delineate the boundaries of the craters [
11].
Table 2 describes the dataset for the study area used to achieve this objective.
The detection and delineation of crater boundaries are done using an ESRI’s ArcGIS add-in crater tool and histogram-based approach. The ArcGIS crater tool is an automatic map-projection-independent tool, found precise in detecting the boundaries of craters. This tool performs two processing functions. The first process finds out the sizes of homogeneously cratered measurement areas. The second process determines the diameters of the craters through digitization. Along with this method, another approach is also used to extract the crater boundaries, i.e., through histogram-based extraction. The histogram-based approach does the crater extraction based on the portioning of an image into distinct non-overlapping regions. The histogram values are selected such that the differentiation between the craters and background could be possible.
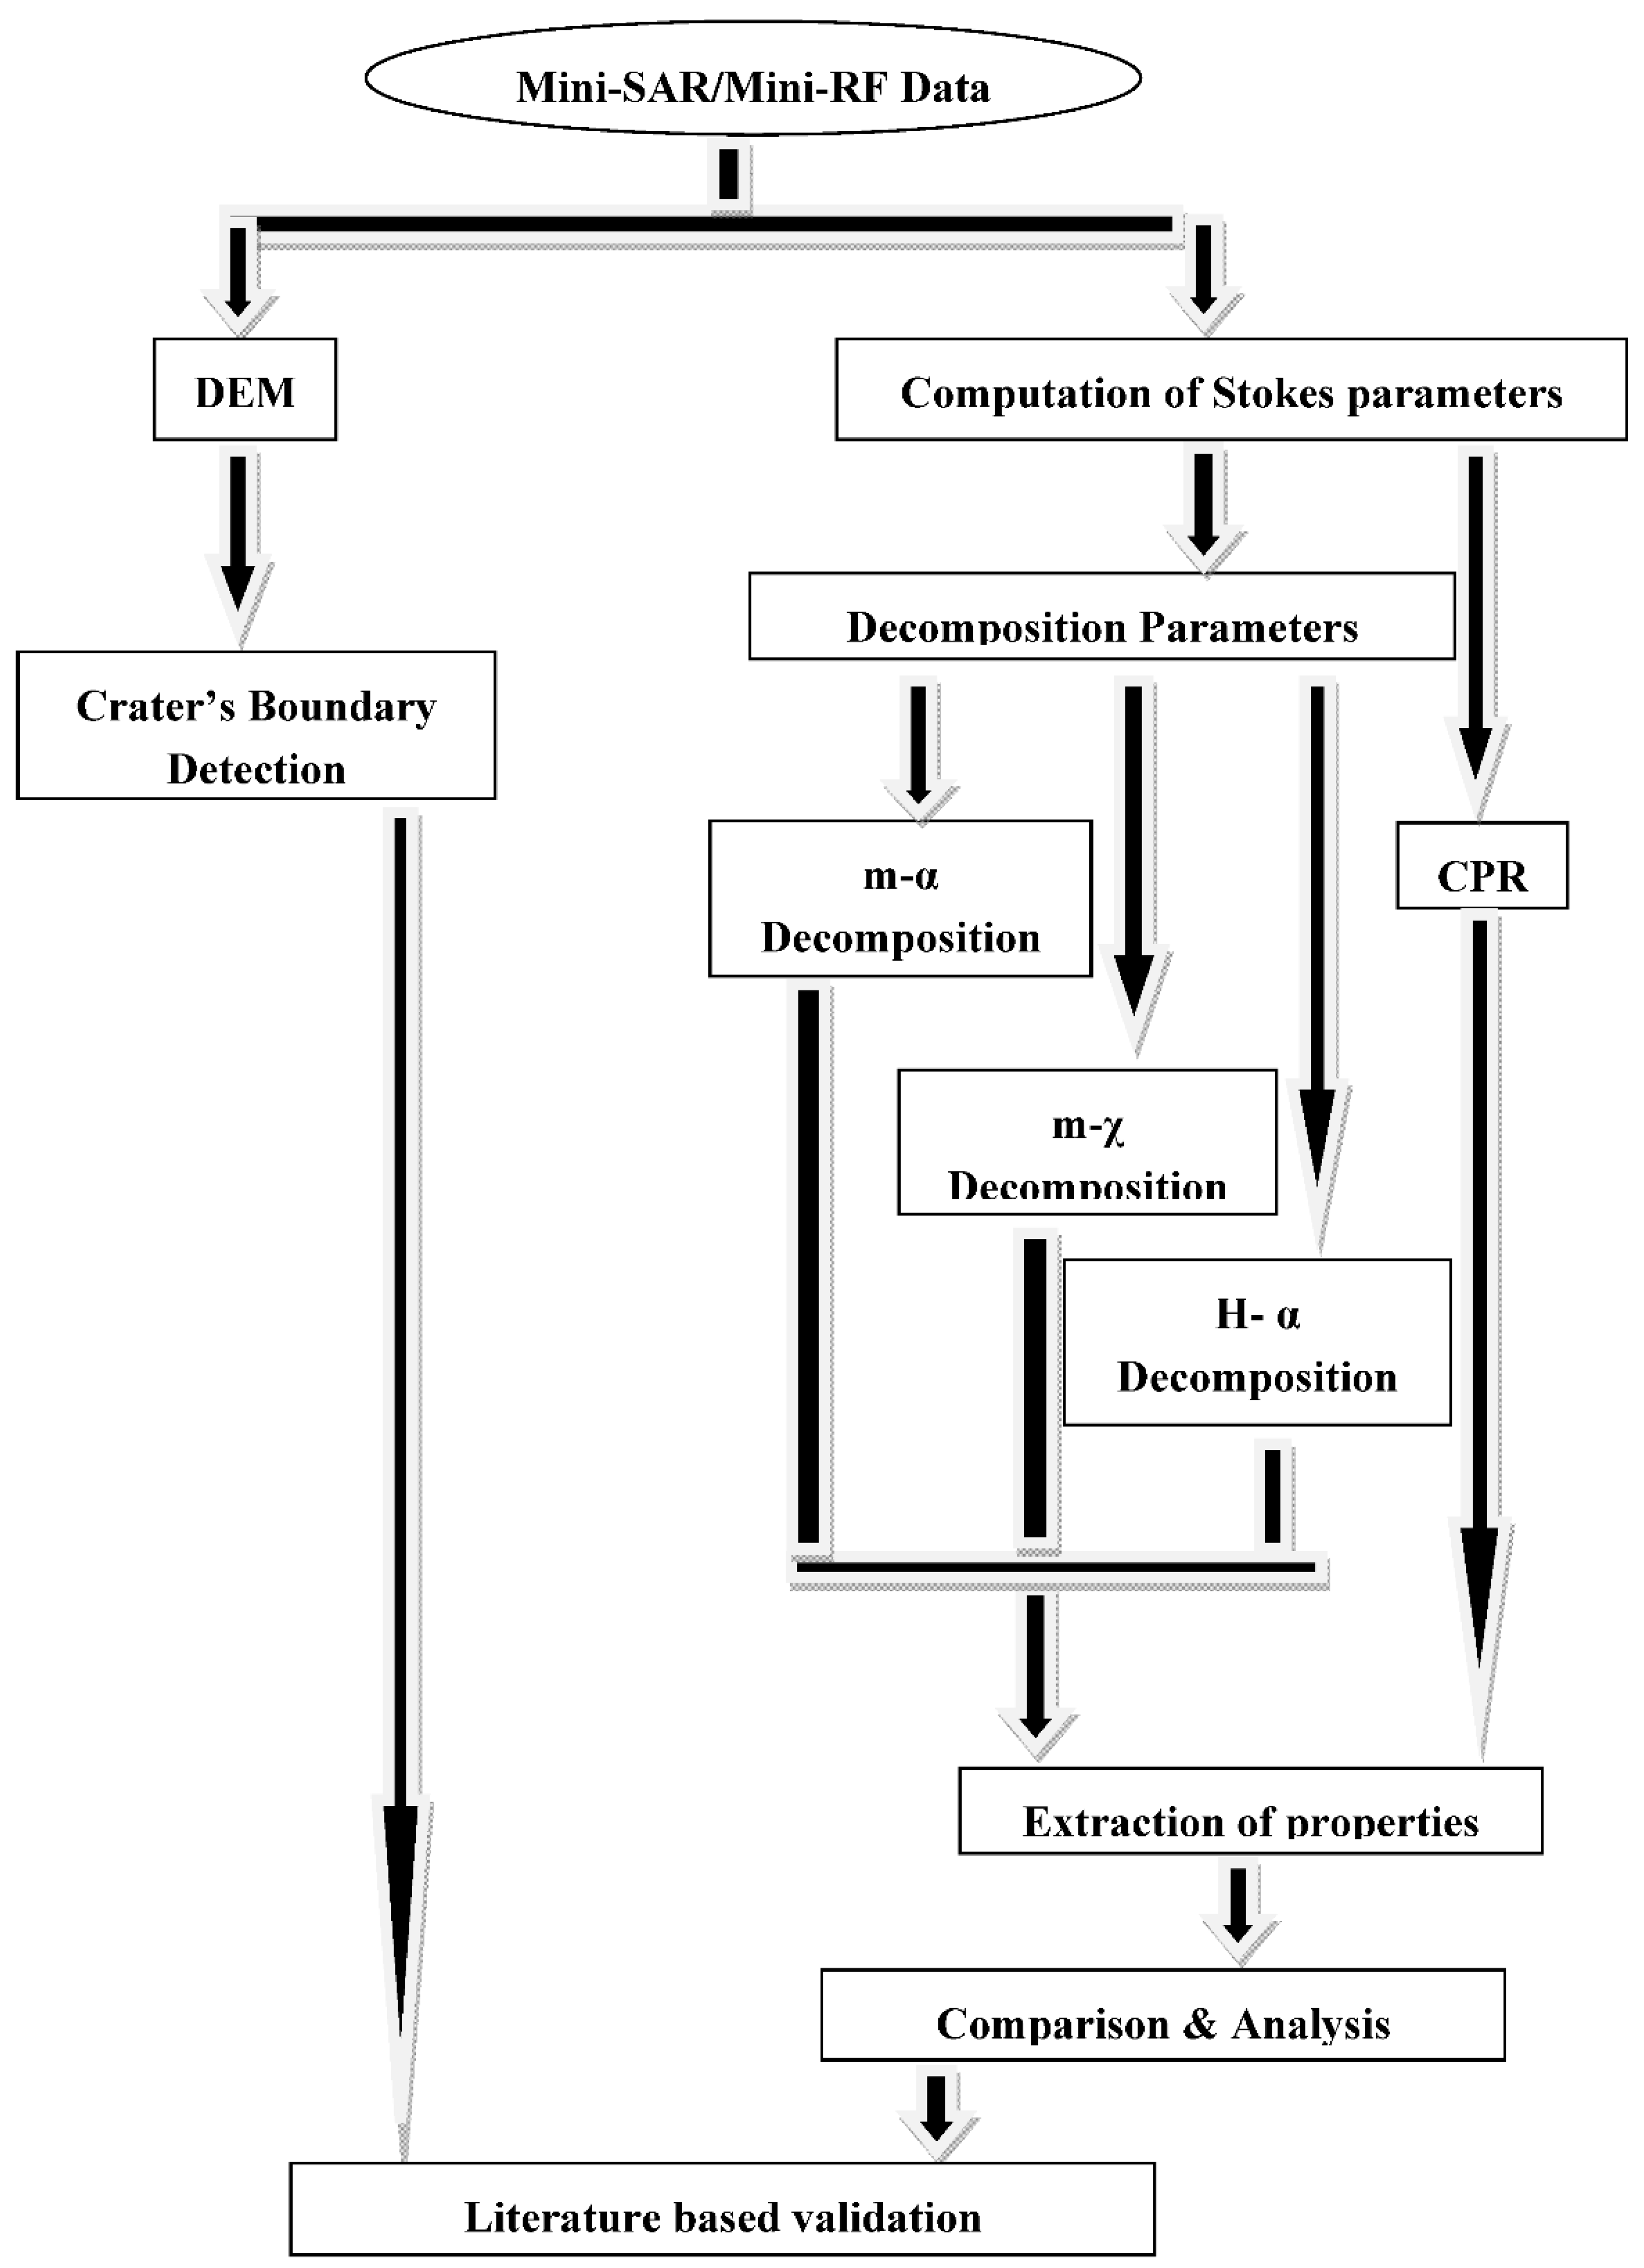
3. Processing and Results
The parameters and techniques described in
Section 2 are essential to study and characterize the surface of the Moon through the scattering mechanism. The overall methodology is given in
Figure 1.
3.1. Analysis of Stokes Parameters
Depending on the shape, surface roughness, orientation angle, dielectric constant, etc., the distinct type of scattering takes place. The derived Stokes parameters are used to study individual crater’s surface properties as well as to compare one crater with others.
The degree of polarization defines the status of electromagnetic waves and the relative phase is sensitive to the variation of polarization in the backscattered signals when struck to targets. The Poincare ellipticity states the extent of the circularity of polarization ellipse. It ranges from −45° to +45°, which corresponds to the right and left circular polarization respectively.
3.2. Polarimetric Decomposition
The
m,
δ,
χ, and
α parameters are used to apply the
m-
δ,
m-
χ, and H-
α decomposition techniques. The estimation of these parameters using Stokes parameters has been explained in
Section 2. These decomposition techniques are used to retrieve scattering information of the craters’ surface and sub-surface. The decomposition results characterize the surface of the craters based on the three scattering mechanisms (surface, double-bounce, and volume scattering). The scattering mechanisms have been displayed using the RGB classification plane for the individual crater in
Figure 2 and
Figure 3. The other colors (yellow, cyan, and magenta) also seen in the figures result from a mix of the RGB palette, where the intensity of each color is the relative contribution of the components. These three scattering mechanisms provide information about the surfaces of the craters which in turn helps in understanding the morphological texture of the craters. The decomposition results also provide an insight to obtain certain findings which could contribute to the presence of water ice in the deep shadowed regions of the craters.
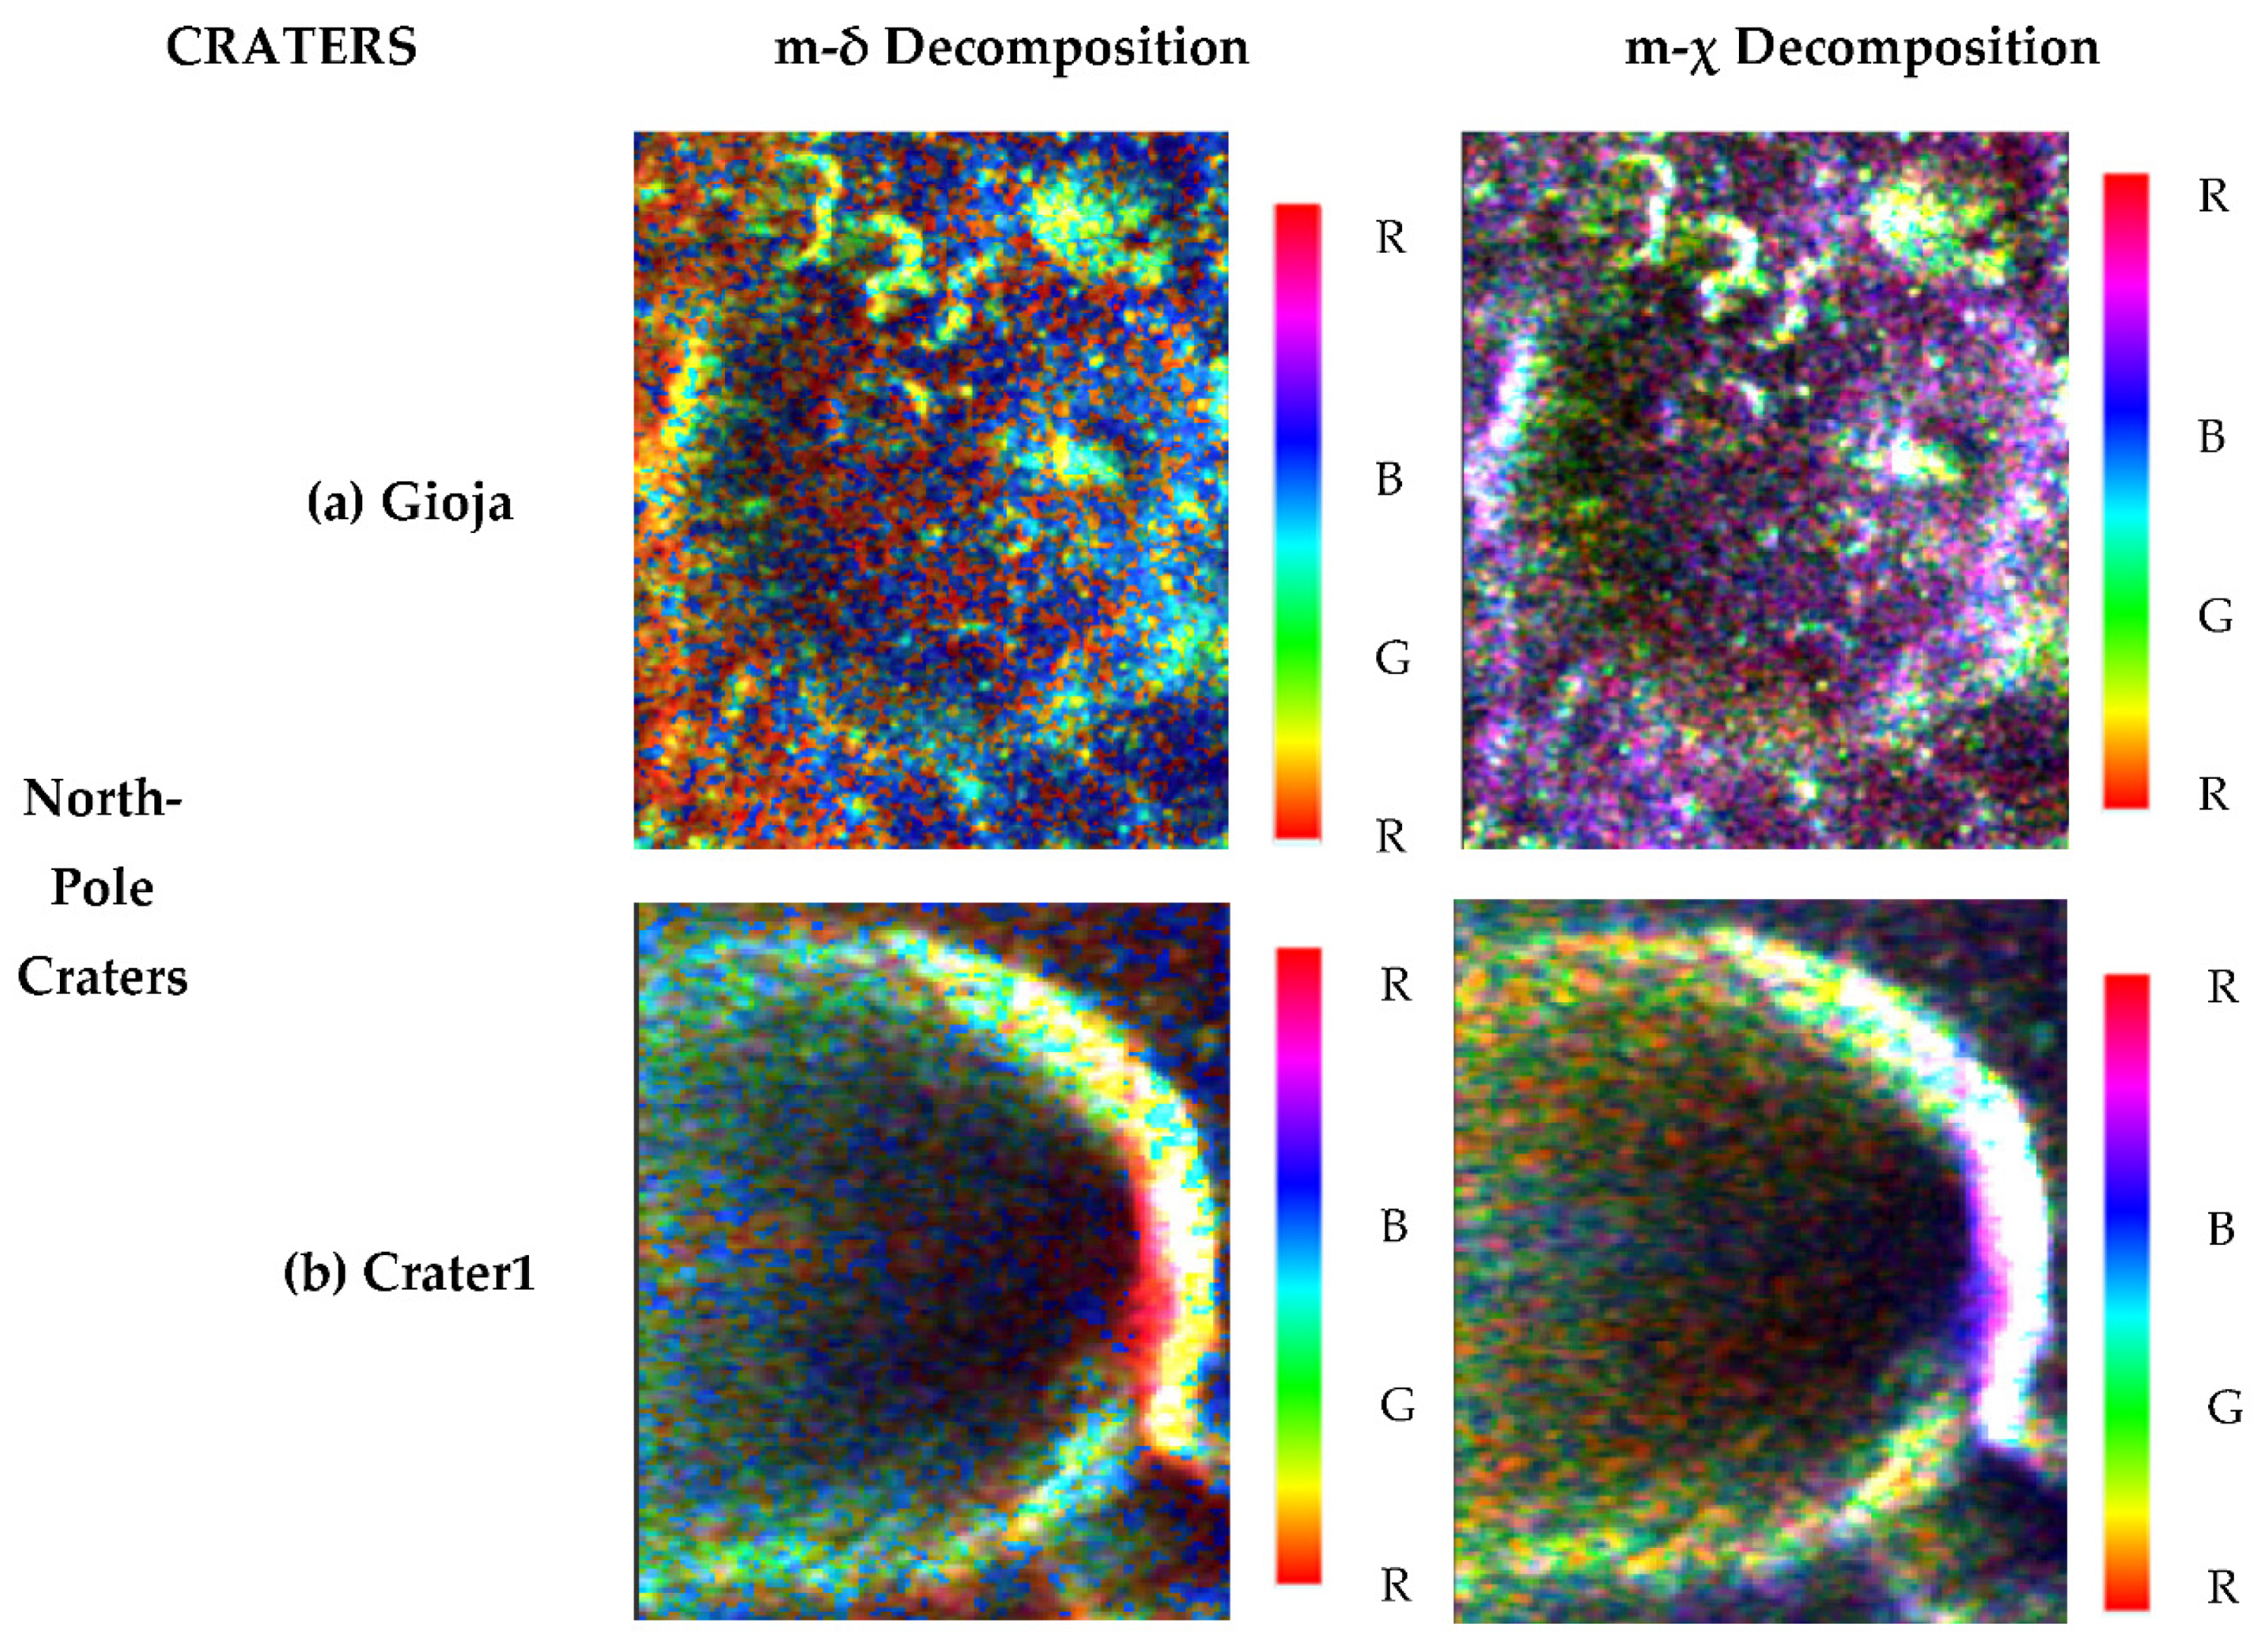
The
m-
δ and
m-
χ decompositions shown in
Figure 2 describe the scattering mechanism of the crater’s surface. For the Gioja crater, a high amount of double-bounce scattering is observed on one side of the outer region of the crater followed by the dominance of surface scattering observed on the other side and inner region of the crater by
m-
δ decomposition. However, the
m-
χ decomposition has shown a mixture of double-bounce and surface scattering in both the regions of the crater. The volume scattering is seen on the steep walls of the craters. On comparing the decomposition techniques for Crater1, a mixture of volumetric and double-bounce scattering is seen more on the walls and inner region of the crater than the double-bounce scattering observed as few pixel regions on its walls. For the Haworth crater, both the decomposition techniques have shown almost similar results. A high amount of surface scattering is seen on the outside of this crater along with volume scattering on the irregular walls of the crater. As for the Nobile crater, several secondary craters are found inside and on its walls. The contribution of the volume scattering component is observed on the walls of the Nobile crater along with the secondary craters found on it. The region outside the crater is associated with a high amount of surface scattering, making this surface smoother as compared to other regions. The
m-
δ decomposition has shown the high intensity of double-bounce inside the crater while a mixture of double-bounce and surface scattering is observed in the same region by
m-
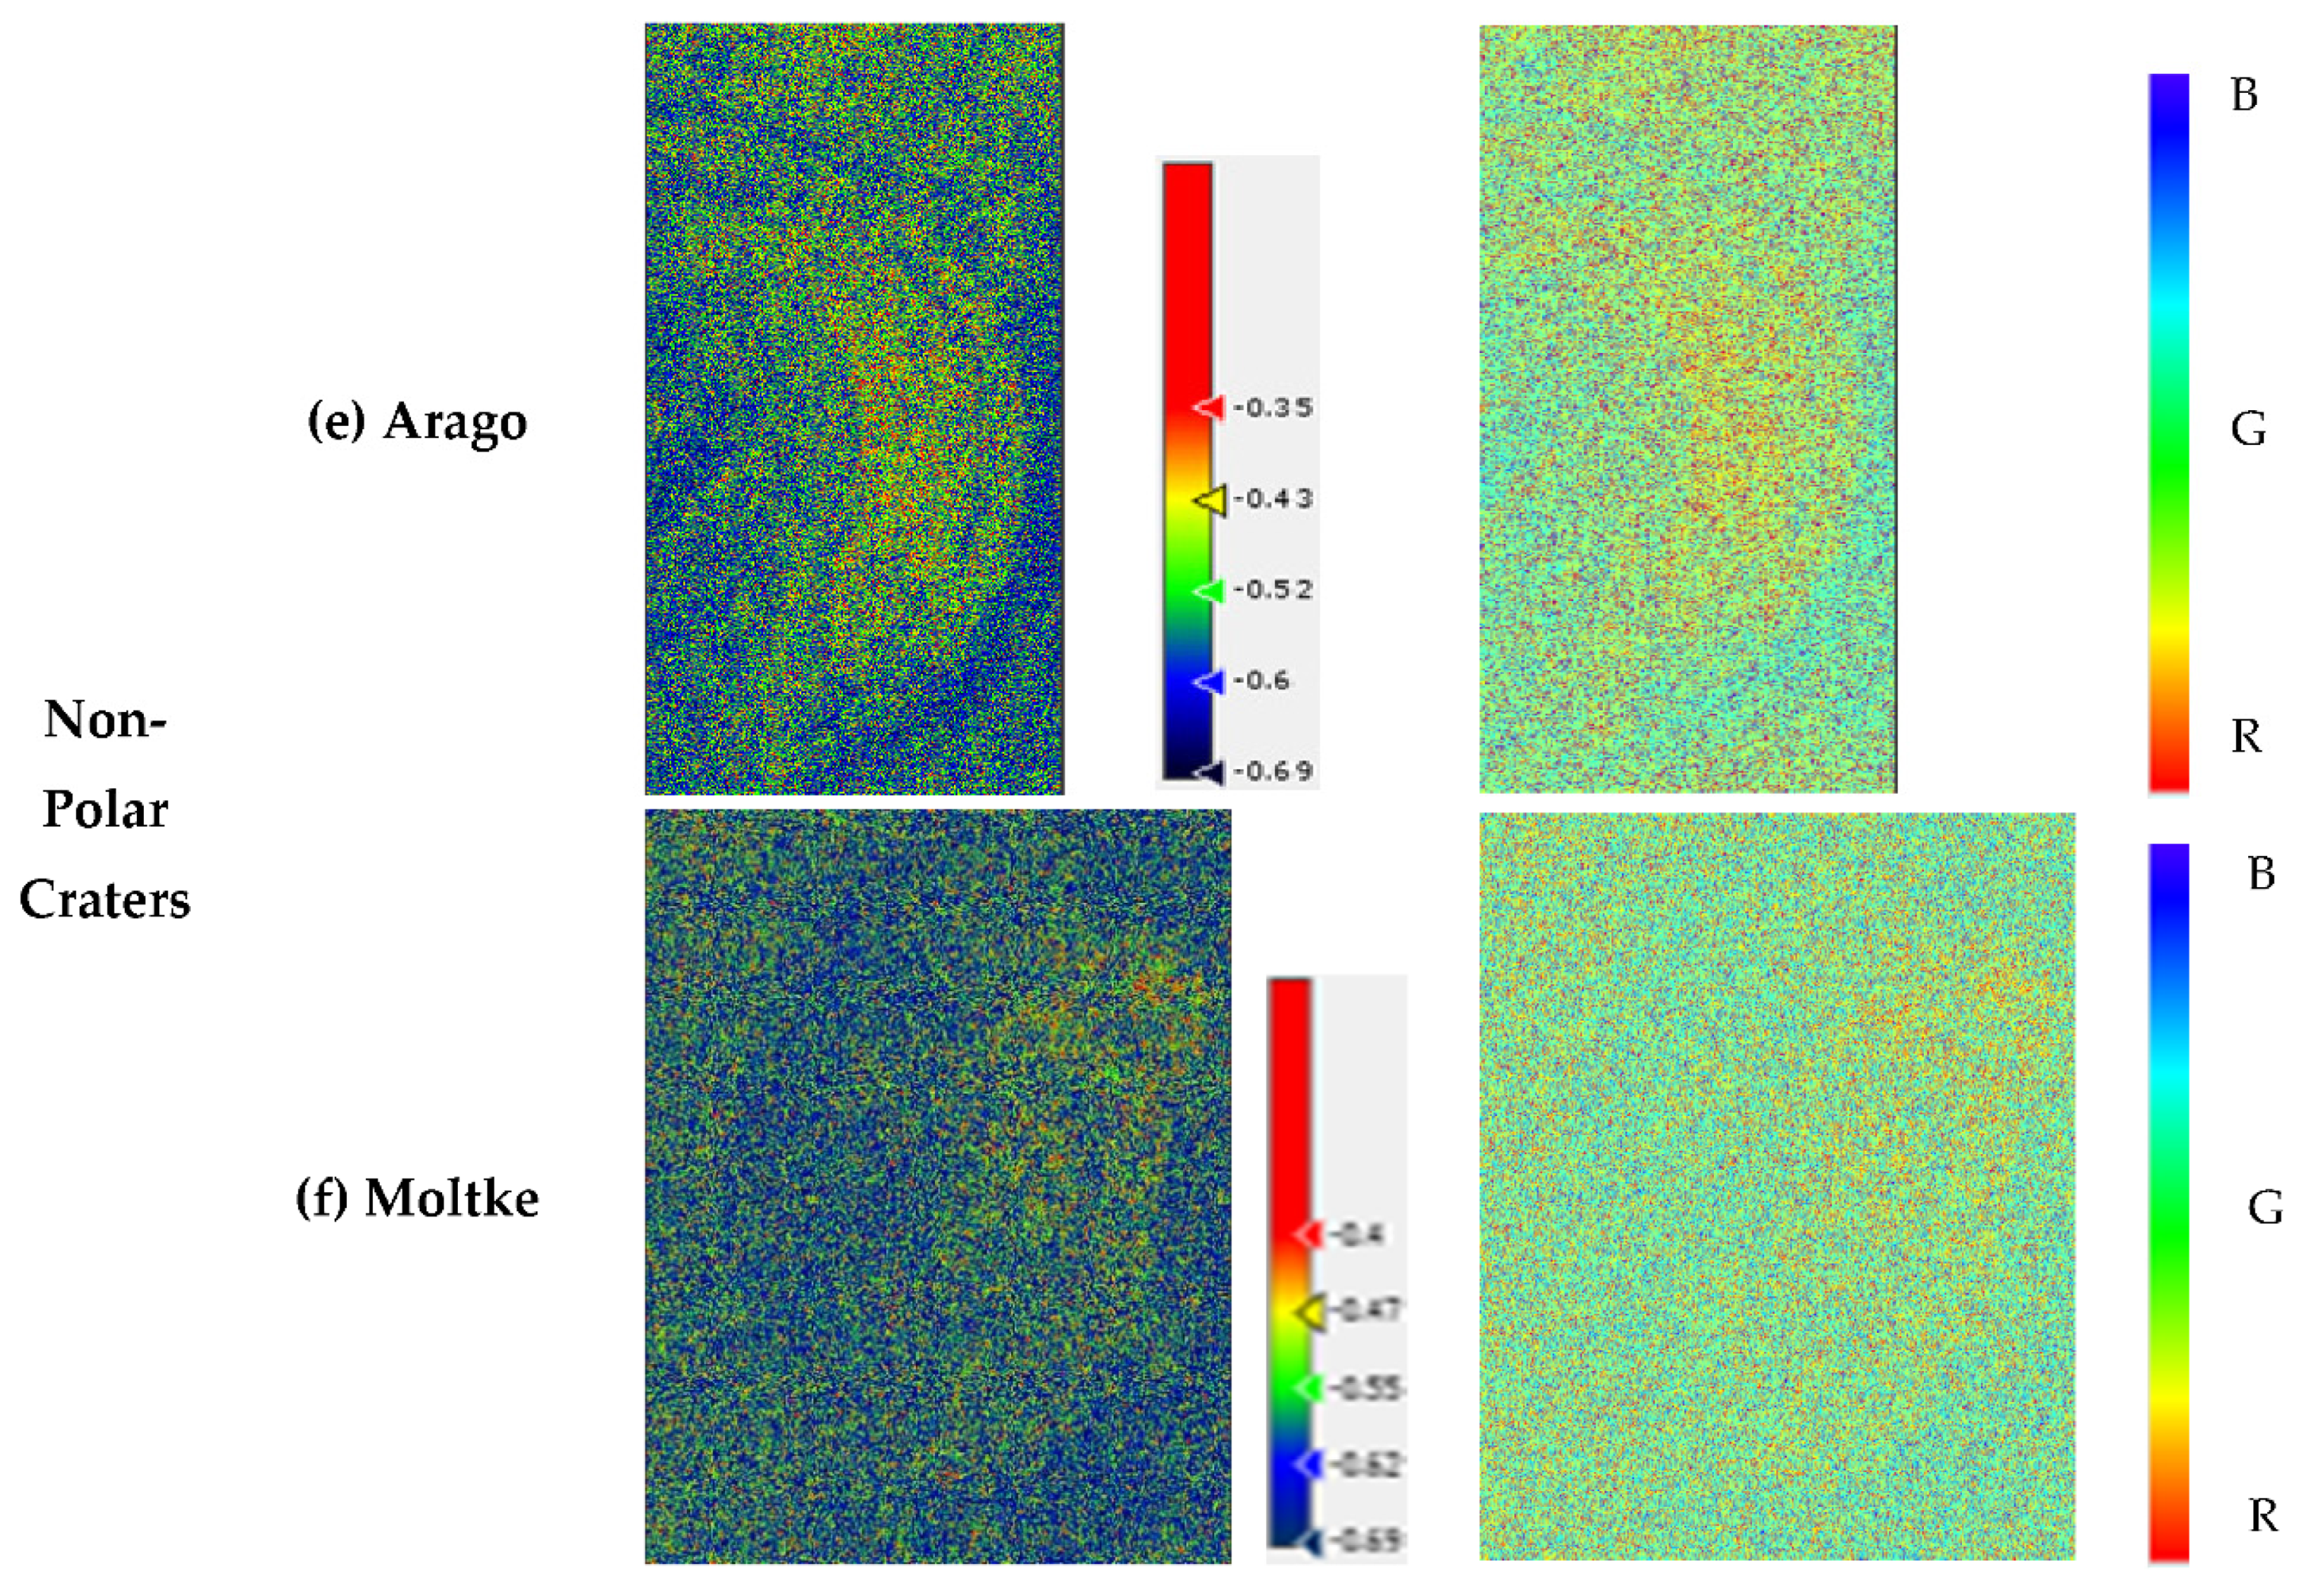
χ decomposition. On comparing the texture of the inner and outer regions of the crater, since more double-bounce and volume scattering are observed, therefore, it can be said that the inner region is rougher as compared to the outer region, which could be due to the reflection of backscattered wave after striking the regions of the secondary craters. As for the non-polar craters, high intensity of volumetric and double-bounce scattering is observed on the ring-like walls of the Arago crater by
m-
δ and
m-
χ decompositions, respectively. Similar results are also found for the Moltke crater, associating with the combination of double-bounce and volume scattering on its walls. The scattering mechanism has shown the dominance of surface scattering outside both crater regions. Since the non-polar craters are present on the Lunar Mare region, the outer region of these craters can be expected to have a smoother surface.
For most of the craters, both these decomposition techniques have shown different results in terms of the contribution of scattering components. So, the roughness and smoothness of the surface of craters cannot be verified with these results alone, thus the additional technique is used to understand the scattering mechanism properly. The H-α decomposition is applied to the same craters to see its contribution to the backscattered signal and find out the intensity of scattering components.
The H-
α decomposition technique comprises entropy (H) and auxiliary angle (
α) parameters, which help in analyzing the behavior of the surfaces of craters. The entropy component is responsible for describing the degree of polarization and the mean-alpha component is used to understand the type of scattering associated with the surface. Both these parameters are combined and interpreted in terms of the scattering mechanism to understand the surfaces. For the Gioja crater, the high degree of entropy is found at few regions present inside and outside the crater, associating them with double-bounce and mixture of volume and double-bounce scattering. The walls of this crater have contributed to the low value of entropy and are associated with surface scattering. As for Crater1, a low value of entropy with a high amount of surface scattering is observed within the crater. However, a mixture of double-bounce and volume scattering with moderate entropy is observed outside the crater region which relates to high roughness in terms of texture properties. In the entropy imagery of
Figure 3b, the high intensity of double-bounce scattering associating with high entropy value is observed on its walls. On comparing the entropy and mean-alpha parameter of Haworth crater, the dominance of volume scattering followed by surface scattering is seen within the crater, whereas a little amount of double-bounce scattering is found outside the crater region. In
Figure 3d, more contribution of double-bounce and mixture of volume and double-bounce scattering is observed on the walls of the Nobile crater, associating with high entropy values that correspond to greater roughness. Surface scattering is observed at low entropy values inside the region of the Nobile crater. As for the non-polar crater named Arago and Moltke, low values of entropy with high volume scattering are found within and outside the regions of the craters. High entropy values associating with double-bounce scattering are observed on the ring-like walls of the craters. The high amount of volume scattering found in most crater regions corresponds to the high backscatter intensity which could relate to either the presence of water ice deposits or more roughness due to reflection by natural dihedrals. To find the presence of water ice in the surface or sub-surface of the craters, the Circular Polarization Ratio (CPR) is calculated and then it is compared with the scattering mechanism for analysis.
3.3. Analysis of Water Ice Deposits
CPR is defined as the ratio of the received power in the same sense polarization (SC) with received echo in the opposite sense of circular polarization (OC). It is also known to be a robust indicator of surface roughness. It can be determined using Equation (8).
A low value of CPR (less than 0.4) indicates a smooth texture of the surface and a rough surface is indicated as double-bounce with higher CPR value. However, a CPR value greater than 1 strongly indicates the possibility of presence of water ice deposits present on the surface.
The CPR results for polar and non-polar craters, namely, Gioja, Crater1, Haworth, Nobile, Arago, and Moltke, are shown in
Figure 4. The regions of the polar craters have shown their CPR values reaching up to +1.5 and +3.37 for Gioja and Crater1, and +6.28 and 3.0 for Haworth and Nobile, respectively. However, the peak value of the CPR is obtained for the non-polar craters consisting of Arago and Moltke, with +4.0 and +9.0, respectively. The results have shown very high CPR values for all the craters, which could either be due to the presence of water ice deposits or reflection from natural dihedrals. Since CPR values result from variation in the backscatter intensity of the respective surfaces, the scattering mechanism could play a crucial role in determining the true regions of water ice deposits by relating it with CPR values. After proper analysis, it is found that the walls of the Gioja crater and inner region of Crater1 contribute to the volume scattering mechanism with high CPR values. As for the Haworth and Nobile crater, the high CPR along with the contribution of volume scattering is observed within the crater regions. Therefore, these respective regions of the craters could be concluded for the presence of water ice deposits. For the Arago and Moltke crater, the contribution of pure volume scattering component is not observed anywhere in the crater regions; instead double-bounce scattering is seen which concludes to high surface roughness. Thus, it is concluded that the high CPR values in the regions of these craters are due to reflection by natural dihedrals.
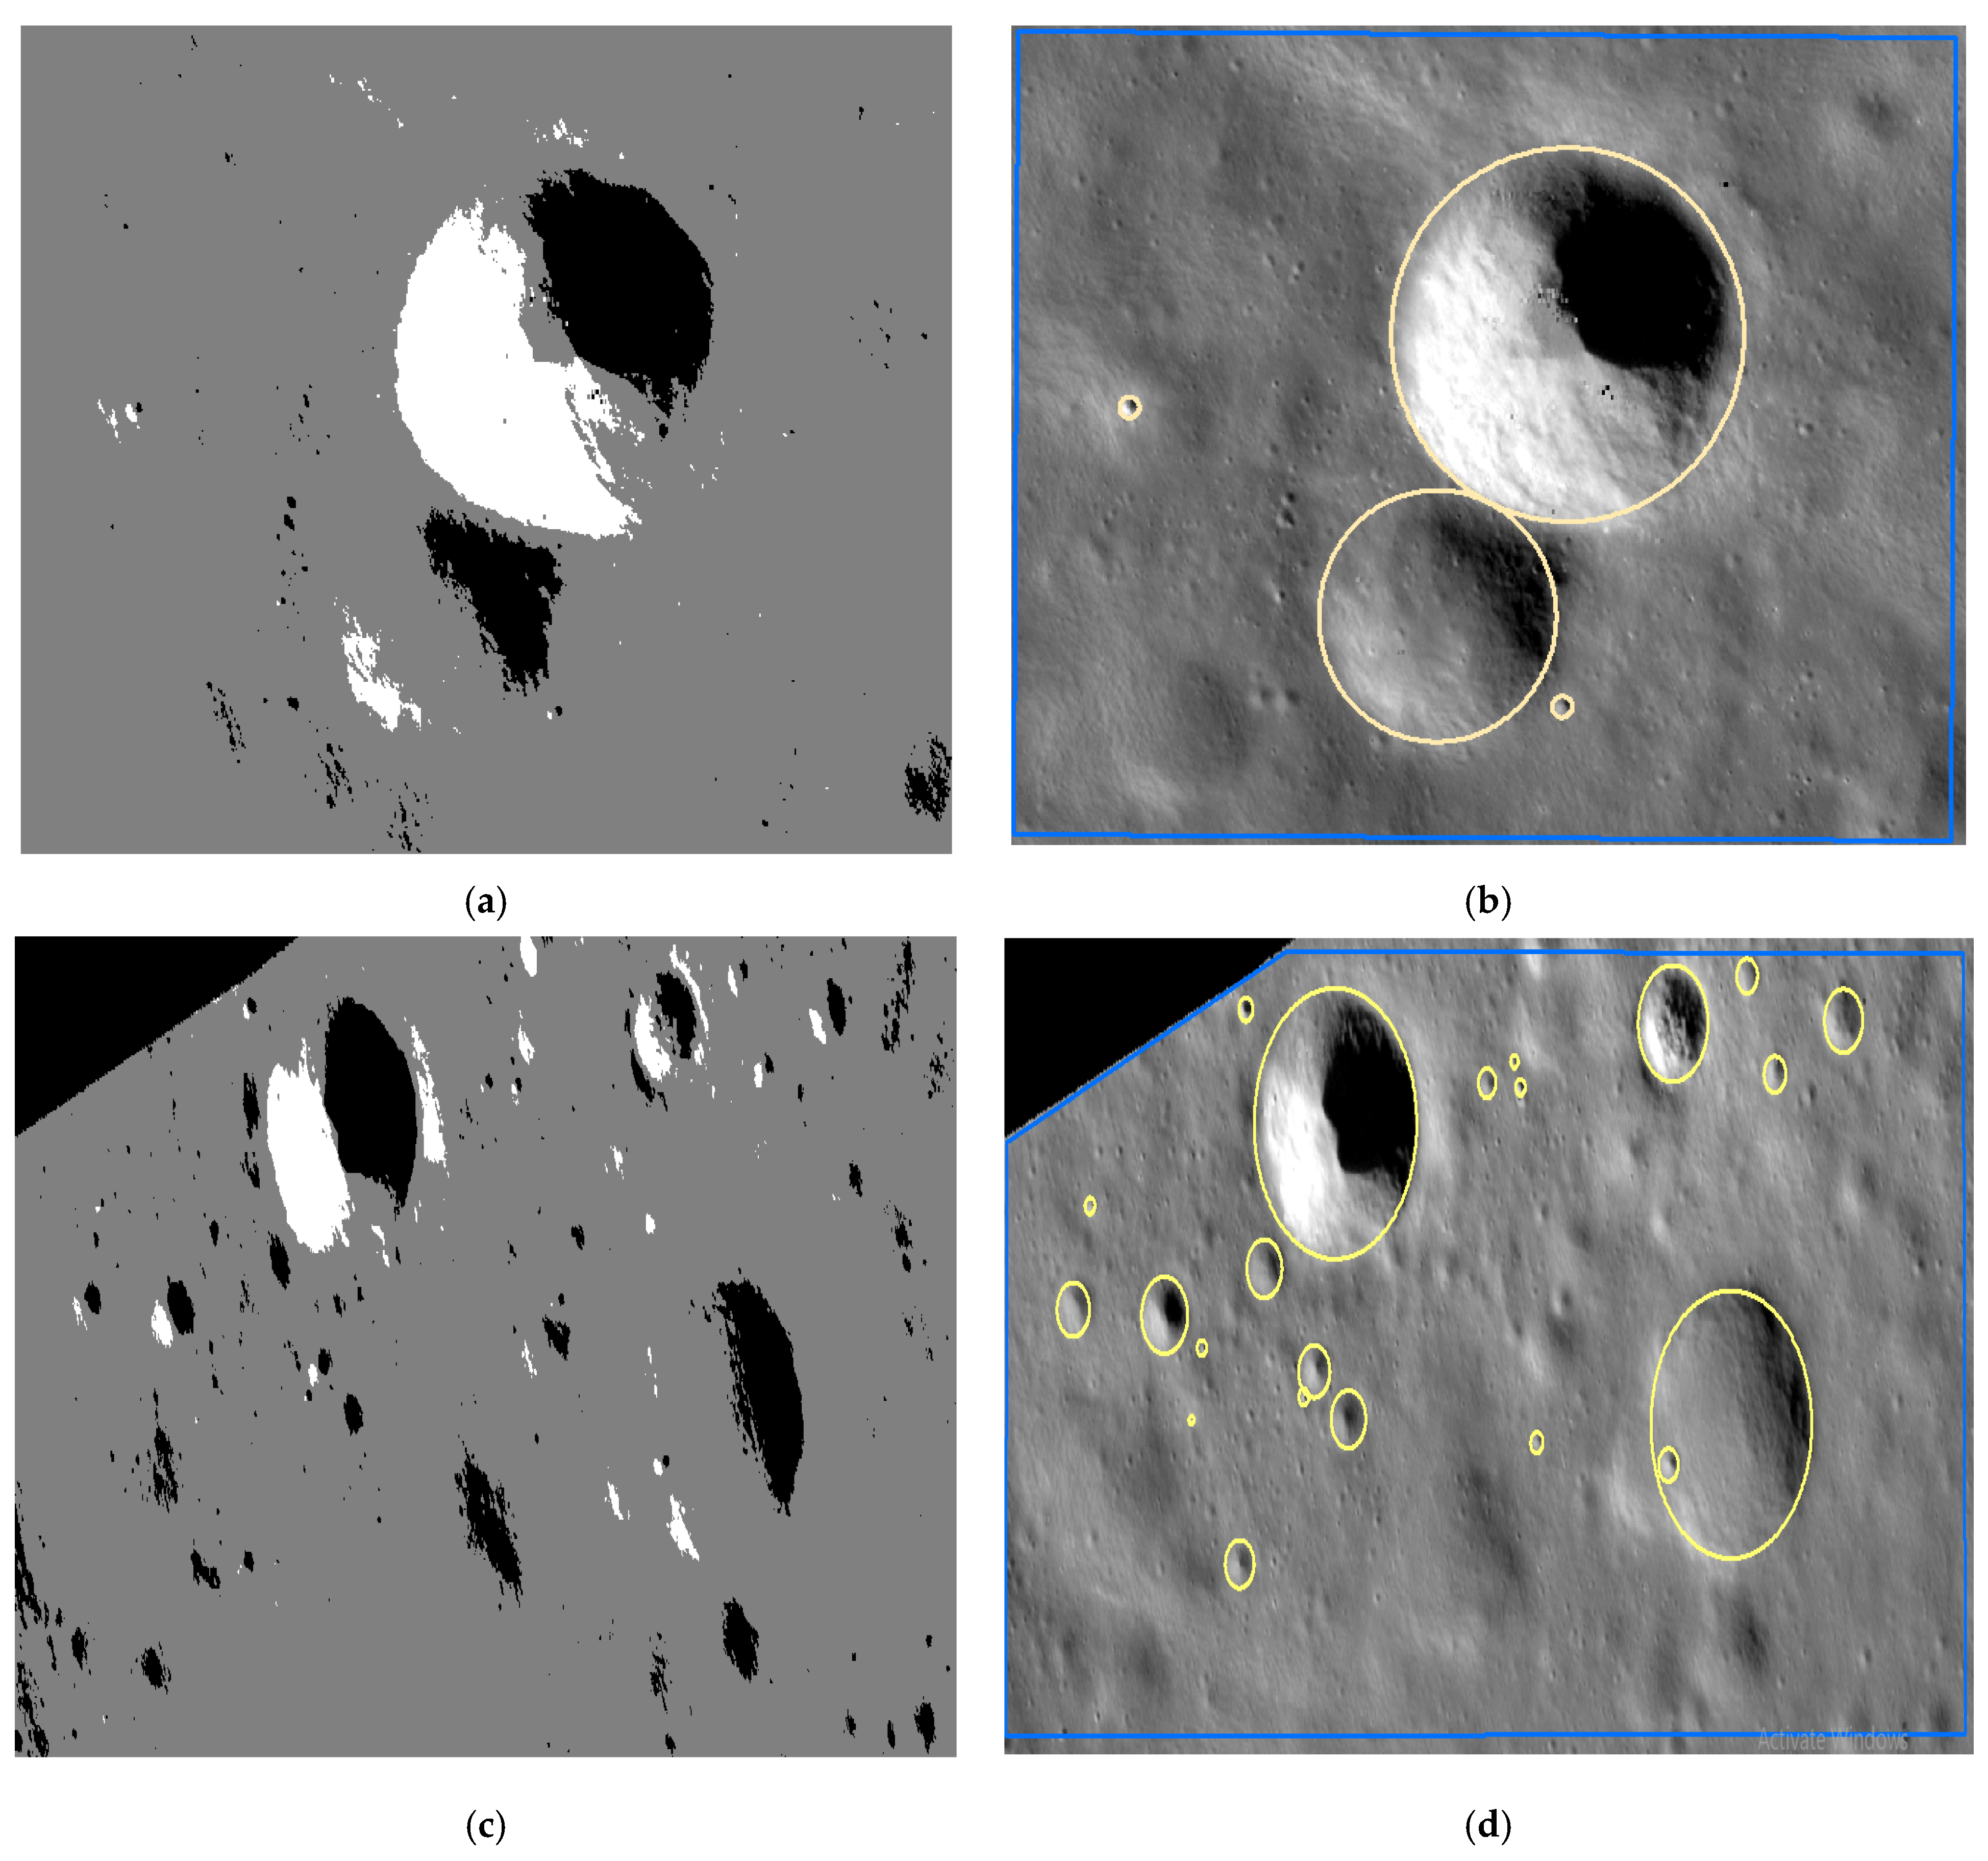
3.4. Crater Boundary Extraction
The study area used for boundary delineation is subsetted in two regions, from which the impact craters are drawn using crater boundary extraction techniques. The boundary extraction of the craters is done using two approaches, ArcGIS Crater tool and histogram-based extraction. The results obtained by using these methods are shown in
Figure 5.
The histogram-based detection is based on the threshold given to a particular set of regions to differentiate between the craters and the background. The intensity values of the craters and the background are recorded and the most intermediate values at the inner and the outer regions of the crater were decided. These intermediate values are used to divide the histogram into two classes, as given in
Table 3.
The extracted circular boundaries using the ArcGIS Crater tool are shown by the circles in
Figure 5b,d. The best-fit circular boundaries of the craters are drawn by marking three points around their circular rim. Along with the manual marking of the craters via 3-point features, a grid of 500 m is formed around those craters. The measurement grid helped with the investigation of large measurement areas using the crater digitization approach cell by cell [
12]. The coordinates of the craters extracted using the ArcGIS Crater tool are given in
Table 4 and
Table 5.
After proper analysis, it was concluded that the histogram-based approach for the crater’s boundary extraction was not able to delineate the precise boundaries of the craters. This is due to the eroded irregular structures and ejecta flow of the craters that it is found difficult to provide differentiated values for craters and the background. However, in the case of delineation through the ArcGIS tool, the craters are extracted in a much better way but this technique only seemed to work for circular craters.


