Abstract
The aim of this study was to identify the dynamics of land-use change, the factors associated with these changes, and potential transformations of paramos and Andean forests through the modeling of land-use change scenarios in the department of Boyacá, Colombia. Throughout the classification of satellite images, we assessed land-use change during two time periods: 1998 to 2010 and 2010 to 2018. Seven transition sub-models were analyzed and associated with 36 explanatory variables. Three future scenarios of land-use change were projected for the years 2030 and 2050: trend, agricultural expansion, and conservation scenarios. We found a gradual reduction in paramos and Andean forests with an increase in secondary vegetation. The most relevant variables explaining land-use change were elevation, distance to roads, and distance to protected areas. The scenario with the greatest impact on paramos and Andean forests was agricultural expansion, in which 29% and 41% of forests would be lost by 2030 and 2050 and in which 44% and 59% of paramos would be lost by the same years. Forests and paramos in the central eastern area showed critical losses and highly fragmented distributions in all scenarios; hence, we recommend focusing conservation efforts in these areas.
1. Introduction
Land-use transformation is recognized as a key factor in global change, influencing human environments and socioeconomic welfare [1,2]. Many factors are identified as drivers of land-use change. The rise in the human population and an increase in meat demand, especially in developing countries, are two main drivers that have increased the need for agricultural land [3,4]. Therefore, crops and pastures have gradually replaced forests in many places on earth, altering natural ecosystems [5,6,7].
Conversion to pastures and crops is constant in Latin América [7]; particularly, the South American tropical Andes have endured intense agricultural activity, as they have become highly populated over the years [8,9].
In the Colombian Andes, the department of Boyacá is one of the main agricultural producers at the national level. This department holds most of the Andean forests and paramos in the country, for it is a place with high biodiversity and numerous endemic species [10,11]. Agricultural pressures have accelerated the transformation of these natural ecosystems in the department to cover product demand both locally and nationally [12]. These high mountain ecosystems are especially vulnerable to climate change, which with high transformation rates, can lead to habitat and biodiversity loss, impacting social and ecological processes [13]. Boyacá aims to maintain high sustainable agricultural production while maintaining its ecosystems and biodiversity [12]. This situation, along with a high rural population with needs, represents a complex challenge. Hence, it is crucial to know and understand potential future patrons that could guide optimal planning decisions in the territory.
Modeling spatial land-use change scenarios can be an effective tool for managing and planning the use of natural resources, as it allows us to explore where and when certain changes could be expected. It also provides a look at a potential future, where different pathways of change can be analyzed and can support important conservation decisions [14]. Our objectives included an analysis to explore land-use changes in the Andean forest and paramos of Boyacá from 1998 to 2018, assessing the drivers associated with these changes and exploring potential future changes throughout the spatial modeling of three pathways for the years 2030 and 2050: (i) trend (busines as usual), (ii) agriculture expansion, and (iii) conservation.
2. Methods
2.1. Land-Use/Cover Changes
The study area was in the Boyacá department, Colombia. This department sits in the central eastern region of the country along the central part of the eastern Andes mountain range. Altitudes in the department vary from 400 to 5.000 meters above the sea level. This study focuses on the Andean forests and paramos above 900 m.a.s.l.
To estimate land-use change in the study area both quantitively and spatially, three maps of land use/cover were created for the years 1998, 2010, and 2018. The maps were produced by classifying Landsat images 5, 7, and 8 L1T. Image classification was performed using the Erdas Imagine software 2015 using the maximum likelihood supervised parametric method. We undertook an accuracy test for each classified image in the module “Accuracy Assessment” of Erdas, using stratified sampling. The outcoming values for general accuracy and Kappa coefficient were satisfactory. Map 2018 presented a general accuracy of 86% and Kappa coefficient of 0.8337. The maps for 2010 and 1998 obtained values of 85% and 0.8325 and of 84% and 0.7861 correspondingly.
A land-use change analysis was performed using the Land Change Modeler (LCM,) in the Idrisi Selva software V. 17.2. Changes in land use/cover were analyzed in 11 categories: Andean forest, paramo, secondary vegetation, pastures and crops, thickets, shrubs, rock surfaces, bare soil, urban, forest plantations, and water bodies. The analysis was carried out during two periods: 1998–2010 and 2010–2018. Gains, losses, and persistence were calculated in the two periods for each land-cover category [15]. We also calculated the annual rate of change for each category, applying the Puyravaud (2003) formula [16]:
where r is the rate of change, t1 is the initial time, t2 is final or next time step, A1 is the cover area (ha) in t1, and A2 is the cover area (ha) in t2.
2.2. Transition Sub-Models and Drivers of Change
We worked seven sub-models, grouped in two categories: degradation and regeneration.
Degradation: (1) Andean forests to pastures and crops, (2) Andean forests to secondary vegetation, (3) paramos to pastures and crops, (4) paramos to secondary vegetation, and (5) paramos to bushes.
Regeneration: (6) pastures and crops to secondary vegetation, and (7) pastures and crops to scrub.
We prepared a group of 36 variables to be consider as drivers of change (Appendix A). Many of them were previously reported as important factors that induced change in the South American Andes [17]. The variables were both quantitative and categoric, discriminated into eight categories: (1) physical environment, (2) accessibility, (3) landscape composition, (4) landscape structure, (5) management policies, (6) degradation, (7) demographic, and (8) socioeconomic.
For each sub-model, most suitable variables were assigned taking into account the explanatory value for the Cramer statistic (optimal values > 0.15), the relevance of the variable towards the transition, and its potential influence in the process based on previous studies in the Andean biome. We also considered the combination of variables that yields the highest accuracy values in the sub-model.
We modeled each transition using the multilayer perceptron (MLP) method in Idrisi [18]. After running each sub-model, we obtained seven transition maps and their corresponding accuracy values.
2.3. Scenarios Construction and Predictions
Land-use/cover change predictions were done using Markov chains analysis in the Land-Use Change Modeler (LCM) in Idrisi. Three future scenarios were developed: (i) trend, (ii) agricultural expansion, and (iii) conservation. Projections for each scenario were made for the years 2030 and 2050. The scenarios were inspired on the Representative Concentrations Pathways (RCP) deforestation assumptions, showing distinct plausible future pathways.
(i) The trend or Business As Usual (BAU) scenario assumes that the observed trends in Andean forests and paramos during 1998 and 2010 will continue to be the same in the landscape for 2030 and 2050. Neither conservation actions nor incrementation in crop and pasture areas were considered.
(ii) The agricultural expansion scenario was created based on the RCP 8.5 IPCC scenario: A scenario of comparatively high greenhouse gas emissions, which assumes an increase of 12% of arable land on the planet for 2050 [19]. In this line, our agricultural expansion scenario contemplates a 12% increment of the arable land in the study area. The transition probabilities from secondary vegetation, Andean forests, and paramos to pastures and crops were incremented by 2%, 5%, and 5%, respectively. This scenario does not apply any conservations actions, leading to loss and degradation of Andean forests and paramos.
(iii) The conservation scenario is based on the RCP 4.5 IPCC scenario: A pathway for stabilization of radiative forcing by 2100. RCP 4.5 suggests a slight decrease in greenhouse gases on the planet for 2100 due to forest expansion and the implementation of green technologies [20]. Our conservation scenario assumes the implementation of conservation measures such restoration projects, protected area expansions, and payment for ecosystem services, allowing regeneration processes in these areas. The transition probabilities from pastures and crops to secondary vegetation and Andean forests were incremented by 4% each for a total regeneration increase of 8%.
3. Results and Discussion
3.1. Land-Use/Cover Change
3.1.1. Land-Use/Cover Change during 1998–2010
Most representative land/use covers during this period were pasture-crops and Andean forests with 39% and 29.2% of the area, respectively (Table 1). Andean forests and paramo were the land covers that had higher reductions at the end of the period. Andean forests showed the highest annual rate of loss, −1.3%, while bushes and secondary vegetation presented the highest annual gaining rates, 7% and 4.2%, respectively.

Table 1.
Land-cover change between 1998 and 2010 (%): persistence, losses, and gains for 2010 in hectares. The annual gain/loss per category is presented as the annual exchange rate (%).
3.1.2. Land-Use/Cover Change during 2010–2018
The larger land-cover categories for this period were pasture-crops and Andean forests, followed by secondary vegetation, with cover percentages of 41.8%, 18.4%, and 17.6% for 2018, respectively. The category that experimented with a bigger reduction was Andean forests, losing 154.792 hectares, with a loss rate of 3.7% annually. The category with the greatest increment was pasture-crops, earning 2.3% of its area annually, represented by 192.458 hectares in the study area for 2018 (Table 2).
Table 2.
Land-cover change between 2010 and 2018 (%): persistence, losses, and gains for 2018 in hectares. The annual gain/loss per category is presented as the annual exchange rate (%).
For the first study period, our results showed an increment in secondary vegetation, while crops and pastures decreased. The opposite situation was found in the second period. This is consistent with a repetitive patron previously reported in the tropical Andes, where secondary vegetation and crop-pastures were replaced systematically with each other. This is due to a dynamic where the land was abandoned after agricultural use, permitting secondary vegetation recovery. This patron was also reported in the Venezuelan, Bolivian, and Colombian Andes before [21,22,23,24,25].
3.2. Transition Sub-Models and Drivers of Change
Overall, the variables that intervene the most in land-use change dynamics were the digital elevation model and the distance to national protected areas. The distance to other categories of protection (distance to regional natural parks, distance to municipal natural parks, and distance to civil society reserves) played an important role as well, ranked second for frequency intervention, together with distance to secondary roads. Concerning the socioeconomic variables, agricultural density, number of households, and conflict overuse were the most frequent variables explaining land-use change.
The elevation (Digital Elevation Model), our most frequent variable in the transitions, showed high positions of influence and was also reported to be an important factor affecting land transformation in the Andes according to previous studies [22,26]. A similar situation occurs with the variables distance to roads and distance to protected areas, also particularly important in our study and in previous investigations in the Andean region [9]. Once more, these variables have been proven to be drivers of change in Andean forests and paramos.
Compared to other land-use change investigations, we included numerous socioeconomic variables in this study. In many of the cases, the influence of these variables in the transitions was low. This is in line with Redo et al. (2012) [22], in which the influence on land-use change of variables related to needs, development, education, and demographics turned out to be low in the Bolivian Andes. However, socioeconomic variables were present in all the transitions and, in some cases, had great influence.
3.3. Spatial Explicit Land-Use Scenarios for 2030 and 2050
Taking 2010 as the reference year, the scenarios indicated land-cover reductions in three categories. Andean forests, paramos, and crop-pastures (negative values), as well as an increase in bushes and secondary vegetation (positive values). The most drastic changes occurred in the agricultural intensification scenario, while trend and conservation scenarios behaved more closely (Table 3).
Table 3.
Percentages of change for each land cover and scenario.
Paramo land cover reached its highest percentage of change in the agricultural intensification scenario, reducing its area by 44.17% in 2030 and by 59.78% in 2050. Change percentages for paramo behaved very similarly in trend and conservation scenarios. Also, the agricultural intensification scenario would represent the greatest impact on Andean forest cover, generating losses of 29.67% by 2030 and 41.80% by 2050. Crops and pastures would achieve the greatest reduction in the conservation scenario, and secondary vegetation would have the highest increasing values (Table 3). The agricultural expansion scenario would represent the biggest impact in terms of fragmentation and connectivity in the study area. These disturbances can lead to ecosystem degradation, altering energy flows and leading to a loss in biodiversity [27,28]. Less resilient species with low plasticity and restricted distribution could be the most affected [29]. For example, Agudelo et al. (2019) [30] reported a loss of suitable habitat for the anurans in the Colombian Andes, between 49.6% and 72.6% by the year 2050, due to climate and land-use change, which would certainly increase the risk of extinction of several species in this group.
The conservation scenario was the best pathway for Andean forests and paramos, with lower losses values. This is consistent with Jantz et al. (2015), who reported the lowest values of natural cover loss (77%) for the Andean hotspot by 2100 in a scenario that considers forest expansion (RCP 4.5). Our conservation scenario presents the lowest decline values in the Andean forest and paramo; however, the impact in these natural covers is important and differs little from the trend scenario values. This can indicate that degradation processes are happening fast in the area, suggesting that better and prompt conservation measures are needed to safeguard these resources and the ecosystem services they provide. These measures can be thought to be linked to climate change mitigation actions, as they can also prevent habitat and biodiversity loss due to land-use change [31].
In all scenarios, the biggest and most conspicuous changes take place in the Tota–Bijagual–Mamapacha and Pisba paramo complexes, in the center and south west of the study area (Figure 1, Figure 2 and Figure 3) Particularly, Tota–Bijagual–Mamapacha has gone through intense agricultural pressure, as it is placed near the municipality of Aquitania, a high agricultural producer. Our results revealed congruent information with that of Sarmineto et al. (2013) [32], where after the paramo complex of Altiplano Cundiboyasense (not taken into account in this study, as it is very reduced and no paramo cover was detected), Tota–Bijagual–Mamapacha showed the biggest percentage of transformation: 31.39%. The most vulnerable areas to be transform agree with those stated by Armenteras et al. (2012) [17], in which the majority of hot spots of paramo loss in the Colombian Andes were located in the eastern mountain range, particularly in the Boyacá and Cundinamarca departments.
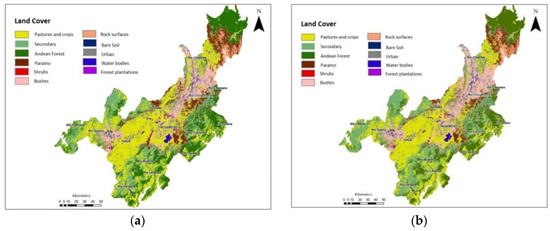
Figure 1.
Land cover according to the trend scenario for (a) 2030 and (b) 2050.
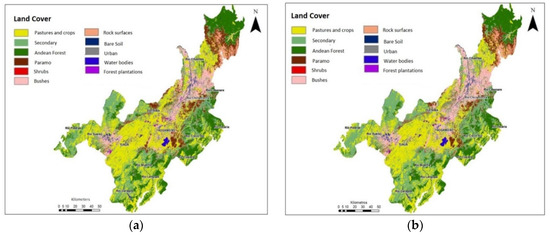
Figure 2.
Land cover according to the agriculture expansion scenario for (a) 2030 and (b) 2050.
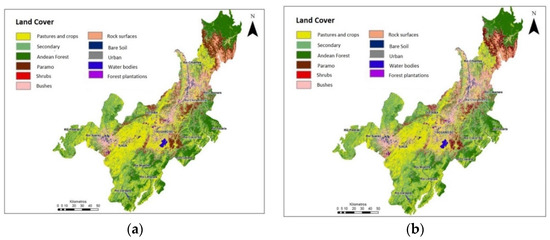
Figure 3.
Land cover according to the conservation scenario for (a) 2030 and (b) 2050.
4. Conclusions
In 20 years (1998–2018), a gradual loss of Andean forests and paramos will be observed in the study area. We also found an increase in secondary vegetation and a dynamic between crop-pastures and secondary vegetation that agrees with a cyclical pattern previously reported in the South American Andes.
The most recurrent explanatory variables that influenced the transitions in this study area belonged to three categories: physical environment (DEM), accessibility (distance to secondary roads), and management policies (distance to national protected areas). Overall, the socioeconomic variables obtained medium and low influences in the transitions but were recurrent in the changes; therefore, it is recommended to include and explore these types of variables in future investigations.
The scenario with the most drastic values of forest and paramo loss was the agricultural intensification scenario, while the tendency and conservation scenarios showed similar loss values. Tota–Bijagual–Mamapacha and Pisba turned out to be the most affected paramos in all three scenarios; thus, it is recommended to increase conservation efforts in these areas (e.g., restoration or Payment for Ecosystem Services initiatives).
Funding
This research received no external funding.
Data Availability Statement
The main data (satellite images) that were used to achieve the purposes of this study are available in a publicly accessible repository: The USGS Earth Explorer Server (https://earthexplorer.usgs.gov/).
Acknowledgments
Special thanks to professor Jesus Anaya from the Antioquia University for his valuable help in the historical images and the environmental authority Corpoboyacá for providing important spatial information for this research.
Conflicts of Interest
The authors declare no conflict of interest.
Appendix A
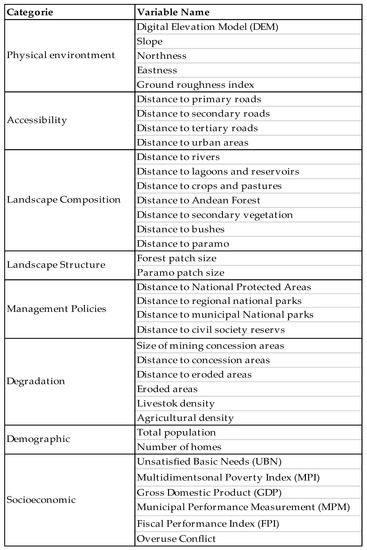
Figure A1.
Explanatory variables used in the transition sub-models.
References
- Bax, V.; Francesconi, W.; Quintero, M. Spatial modeling of deforestation processes in the Central Peruvian Amazon. J. Nat. Conserv. 2016, 29, 79–88. [Google Scholar] [CrossRef]
- Foley, J.A.; DeFries, R.; Asner, G.P.; Barford, C.; Bonan, G.; Carpenter, S.R.; Snyder, P.K. Global consequences of land use. Science 2005, 309, 570–574. [Google Scholar] [CrossRef] [PubMed]
- The Food and Agriculture Organization of the United Nations and Earthscan. The State of the World’s Land and Water Resources for Food and Agriculture. Managing Systems at Risk; The Food and Agriculture Organization of the United Nations and Earthscan: Rome, Italy; New York, NY, USA, 2011; p. 285. [Google Scholar]
- Smith, P.; Gregory, P.J.; Vuuren, D.; Van Rounsevell, M.; Obersteiner, M.; Havlı, P.; Bellarby, J. Competition for land. Philos. Trans. R. Soc. 2010, 2941–2957. [Google Scholar] [CrossRef]
- Asner, G.P.; Elmore, A.J.; Olander, L.P.; Martin, R.E.; Harris, A.T. Grazing systems, ecosystem responses, and global change. Annu. Rev. Environ. Resour. 2004, 29, 261–299. [Google Scholar] [CrossRef]
- Wanumen-mesa, A.M. ¿Son los paisajes agrícolas dinámicos o estables? Estudio de caso en el lago de Tota (Boyacá, Colombia). Cuad. Geogr. Rev. Colomb. Geogr. 2020, 29, 207–223. [Google Scholar] [CrossRef]
- Wassenaar, T.; Gerber, P.; Verburg, P.H.; Rosales, M.; Ibrahim, M.; Steinfeld, H. Projecting land use changes in the Neotropics: The geography of pasture expansion into forest. Glob. Environ. Chang. 2007, 17, 86–104. [Google Scholar] [CrossRef]
- Cortés-Duque, J.; Sarmiento Pinzón, C.E. Visión Socioecosistémica de los Páramos y la alta Montaña Colombiana: Memorias del Proceso de Definición de Criterios Para la Delimitación de Páramos; Instituto de Investigación de Recursos Biológicos Alexander von Humboldt: Bogotá, Colombia, 2013; p. 235. Available online: http://repository.humboldt.org.co/handle/20.500.11761/31458#.WwYqtgebLwc.mendeley (accessed on 3 February 2020).
- Etter, A.; Mcalpine, C.; Wilson, K.; Phinn, S.; Possingham, H. Regional patterns of agricultural land use and deforestation in Colombia. Agric. Ecosyst. Environ. 2006, 114, 369–386. [Google Scholar] [CrossRef]
- Mittermeier, R.A.; Myers, N.; Thomsen, J.B.; Da Fonseca, G.A.B.; Olivieri, S. Biodiversity Hotspots and Major Tropical Wilderness Areas: Approaches to Setting Conservation Priorities. Conserv. Biol. 1998, 12, 516–520. [Google Scholar] [CrossRef]
- Hofstede, R.; Segarra, P.; Patricio, M.V. Los Paramos del Mundo. Proyecto Altlas Mundial del los Paramos; Global Peatland Iniciative/NC-IUCN/Ecociencia: Quito, Ecuador, 2003; 297p. [Google Scholar]
- Gobernación de Boyacá. Plan de Desarrollo 2016–2019. 2016. Available online: http://sedboyaca.gov.co/plan-de-desarrollo-boyaca-2016-2019/ (accessed on 9 November 2019).
- Beniston, M. Climatic change in mountain regions: A review of possible impacts. Clim. Chang. 2003, 59, 5–31. [Google Scholar] [CrossRef]
- Kindu, M.; Schneider, T.; Döllerer, M.; Teketay, D.; Knoke, T. Scenario modelling of land use/land cover changes in Munessa-Shashemene landscape of the Ethiopian highlands. Sci. Total Environ. 2018, 622–623, 534–546. [Google Scholar] [CrossRef]
- Eastman, J.; TerrSet, R. Manual; Clatk University: Worcester, MA, USA, 2015; p. 394. [Google Scholar]
- Puyravaud, J.P. Standardizing the calculation of the annual rate of deforestation. For. Ecol. Manag. 2003, 177, 593–596. [Google Scholar] [CrossRef]
- Armenteras, D.; Rodríguez, N.; Retana, J.; Morales, M. Understanding deforestation in montane and lowland forests of the Colombian Andes. Reg. Environ. Chang. 2010, 11, 693–705. [Google Scholar] [CrossRef]
- Eastman, R.; Solorzano, L.; van Fossen, M. Transition Potential Modeling for Land-Cover Change. In GIS, Spatial Analysys and Modeling; Maguire, J.D., Baty, M., Goodchild, M., Eds.; Redlands: New York, NY, USA, 2005; p. 423. [Google Scholar]
- Riahi, K.; Rao, S.; Krey, V.; Cho, C.; Chirkov, V.; Fischer, G. RCP 8.5—A scenario of comparatively high greenhouse gas emissions. Clim. Chang. 2011, 109, 33–57. [Google Scholar] [CrossRef]
- Thomson, A.M.; Calvin, K.V.; Smith, S.J.; Kyle, G.P.; Volke, A.; Patel, P.; Edmonds, J.A. RCP4.5: A Pathway for Stabilization of Radiative Forcing by 2100. Clim. Chang. 2011, 109, 1–25. [Google Scholar] [CrossRef]
- Rodríguez Eraso, N.; Armenteras-Pascual, D.; Alumbreros, J.R. Land use and land cover change in the Colombian Andes: Dynamics and future scenarios. J. Land Use Sci. 2012, 8, 154–174. [Google Scholar] [CrossRef]
- Redo, D.J.; Aide, T.M.; Clark, M.L. The Relative Importance of Socioeconomic and Environmental Variables in Explaining Land Change in Bolivia, 2001–2010. Ann. Assoc. Am. Geogr. 2012, 102, 778–807. [Google Scholar] [CrossRef]
- UNEP—United Nations Environment Programme. Latin America and the Caribbean: Environment Outlook, 2010, GEO LAC 3; UNEP: Panama City, Panama, 2010. [Google Scholar]
- Gutiérrez, B.N.; Gärtner, S.; López, H.J.Y.; Pacheco, C.E.; Reif, A. The recovery of the lower montane cloud forest in the Mucujún watershed, Mérida, Venezuela. Reg. Environ. Chang. 2013, 13, 1069–1085. [Google Scholar] [CrossRef]
- Sánchez-Cuervo, A.M.; Aide, T.M.; Clark, M.L.; Etter, A. Land Cover Change in Colombia: Surprising Forest Recovery Trends between 2001 and 2010. PLoS ONE 2012, 7. [Google Scholar] [CrossRef]
- Aide, T.M.; Grau, H.R.; Graesser, J.; Chacon, E.; Francisco, M.; Jose, M.; Rueda, X. Woody vegetation dynamics in the tropical and subtropical Andes from 2001 to 2014: Satellite image interpretation and expert validation. Glob. Chang. Biol. 2019, 2112–2126. [Google Scholar] [CrossRef]
- Armenteras, D.; Gast, F.; Villareal, H. Andean forest fragmentation and the representativeness of protected natural areas in the eastern Andes, Colombia. Biol. Conserv. 2003, 113, 245–256. [Google Scholar] [CrossRef]
- DeFries, R.; Hansen, A.J.; Newton, A.C.; Hansen, M.C. Increasing isolation of protected areas in tropical forests over the past twenty years. Ecol. Appl. 2005, 15, 19–26. [Google Scholar] [CrossRef]
- Sekercioglu, C.H.; Schneider, S.H.; Fay, J.P.; Loarie, S.R. Climate change, elevational range shifts, and bird extinctions. Conserv. Biol. 2008, 22, 140–150. [Google Scholar] [CrossRef] [PubMed]
- Agudelo-hz, W.J.; Urbina-cardona, N.; Armenteras-pascual, D. Critical shifts on spatial traits and the risk of extinction of Andean anurans: An assessment of the combined effects of climate and land-use change in Colombia. Perspect. Ecol. Conserv. 2019, 17, 206–219. [Google Scholar] [CrossRef]
- Jantz, S.M.; Barker, B.; Brooks, T.M.; Chini, L.P.; Huang, Q.; Moore, R.M.; Hurtt, G.C. Future habitat loss and extinctions driven by land-use change in biodiversity hotspots under four scenarios of climate-change mitigation. Conserv. Biol. 2015, 29, 1122–1131. [Google Scholar] [CrossRef] [PubMed]
- Sarmiento, C.C.; Cadena, M.; Sarmiento, J.Z. Aportes a la conservación estratégica de los paramos de Colombia: Actualización de la Cartografía de los Complejos de Paramo a Escala 1:100.000. Repositorio Instituto de Investigación de Recursos Biológicos Alexander von Humboldt. 2013. Available online: http://repository.humboldt.org.co/handle/20.500.11761/31406 (accessed on 20 January 2020).
Publisher’s Note: MDPI stays neutral with regard to jurisdictional claims in published maps and institutional affiliations. |
© 2020 by the authors. Licensee MDPI, Basel, Switzerland. This article is an open access article distributed under the terms and conditions of the Creative Commons Attribution (CC BY) license (https://creativecommons.org/licenses/by/4.0/).