1. Introduction
As timber sale is the primary source of income in the forestry, it is crucial to estimate timber volume and its value with the highest achievable accuracy. In Central Europe, it is a common practice to sell the timber with the bark, however the customer pays for the volume estimated under the bark. The conversion of over-bark measurements to under-bark records is made using various methods of bark thickness or bark volume determination [
1,
2]. Therefore, in addition to the improvement of the measurement methods and equipment, efforts are undertaken to develop better and better models that allow to determine bark features precisely [
3].
Recent shift of the bark reception from a harvest by-product or residue towards the perspective and commercially important fuel or biomaterial and source of tannins caused the increase interest in bark volume estimates development [
4,
5,
6]. Moreover, assessment of bark volume is also important for quantifying carbon stocks [
7].
Our objectives included: (i) analysis of the variability of bark volume and bark volume fraction for Larix sp. in Poland as well as (ii) development of models to estimate the investigated parameters with regard to the basic dendrometric attributes.
2. Material and Methods
Data that served for bark volume (bV) and bark volume fraction (%bV) modeling was collected in 5 locations in various parts of Poland: Dobrzany and Kolbudy—northern part, Rogów—central Poland, Pińczów and Prudnik—southern, upland, and mountain part of the country. Altogether, we measured 599 trees on 62 study plots that differed in growth conditions (oligo-, meso-, and eutrophic sites) and age (19–127 years).
For each tree, we obtained its breast height diameter (d), height (h), and total volume (V, determined with section-wise method). Using bark gauge, we determined the bark thickness that allowed to convert the over-bark volume to under-bark volume. The difference of these two constituted bark volume. Bark volume fraction was calculated as a ratio of bark volume and total over-bark volume of a tree.
The distribution of bV and %bV differed significantly from the normal one (Shapiro–Wilk test, p < 0.001), and we used the Kruskal–Wallis test to assess the impact of location (5 variants), site type (3 variants of growth conditions), and age class (we distinguished 4 ones: <40, 40–60, 60–80, >80 years-old) on the analyzed bark attributes. Pearson correlation was applied to evaluate the relationship between bV or %bV and d, h, or V, as well as between one another.
Following previous studies [
5,
6], we used breast height diameter, height, and total tree volume as an independent variables in models to estimate bark volume and bark volume fraction. We chose the following equations for the model elaboration:
where ŷ—estimated bark parameter, x—independent variable (d—breast height diameter, h—height, V—total tree volume), a, b, c—model parameters.
Based on bark volume distribution, we split our data into calibration and validation sets in proportion 2/3 to 1/3. Obtained sets did not differ significantly in terms of tree’s age, breast height diameter, height, total tree volume, bark volume, and bark volume fraction (Mann–Whitney test; p > 0.4). Best model selection was based on Akaike Information Criterion (AIC) and R2 goodness-of-fit measures. We chose two best performing ones (#1 and #4) and verified them based on the data from validation set using R2 and root mean square error (RMSE) of the residuals as an evaluation measures. Finally, we tested obtained residuals for the impact of location, site type, and age class (Kruskal–Wallis test).
All statistical analyses were performed with PAST4.03 software [
8].
3. Results and Discussion
3.1. Variability of Bark Volume and Bark Volume Fraction
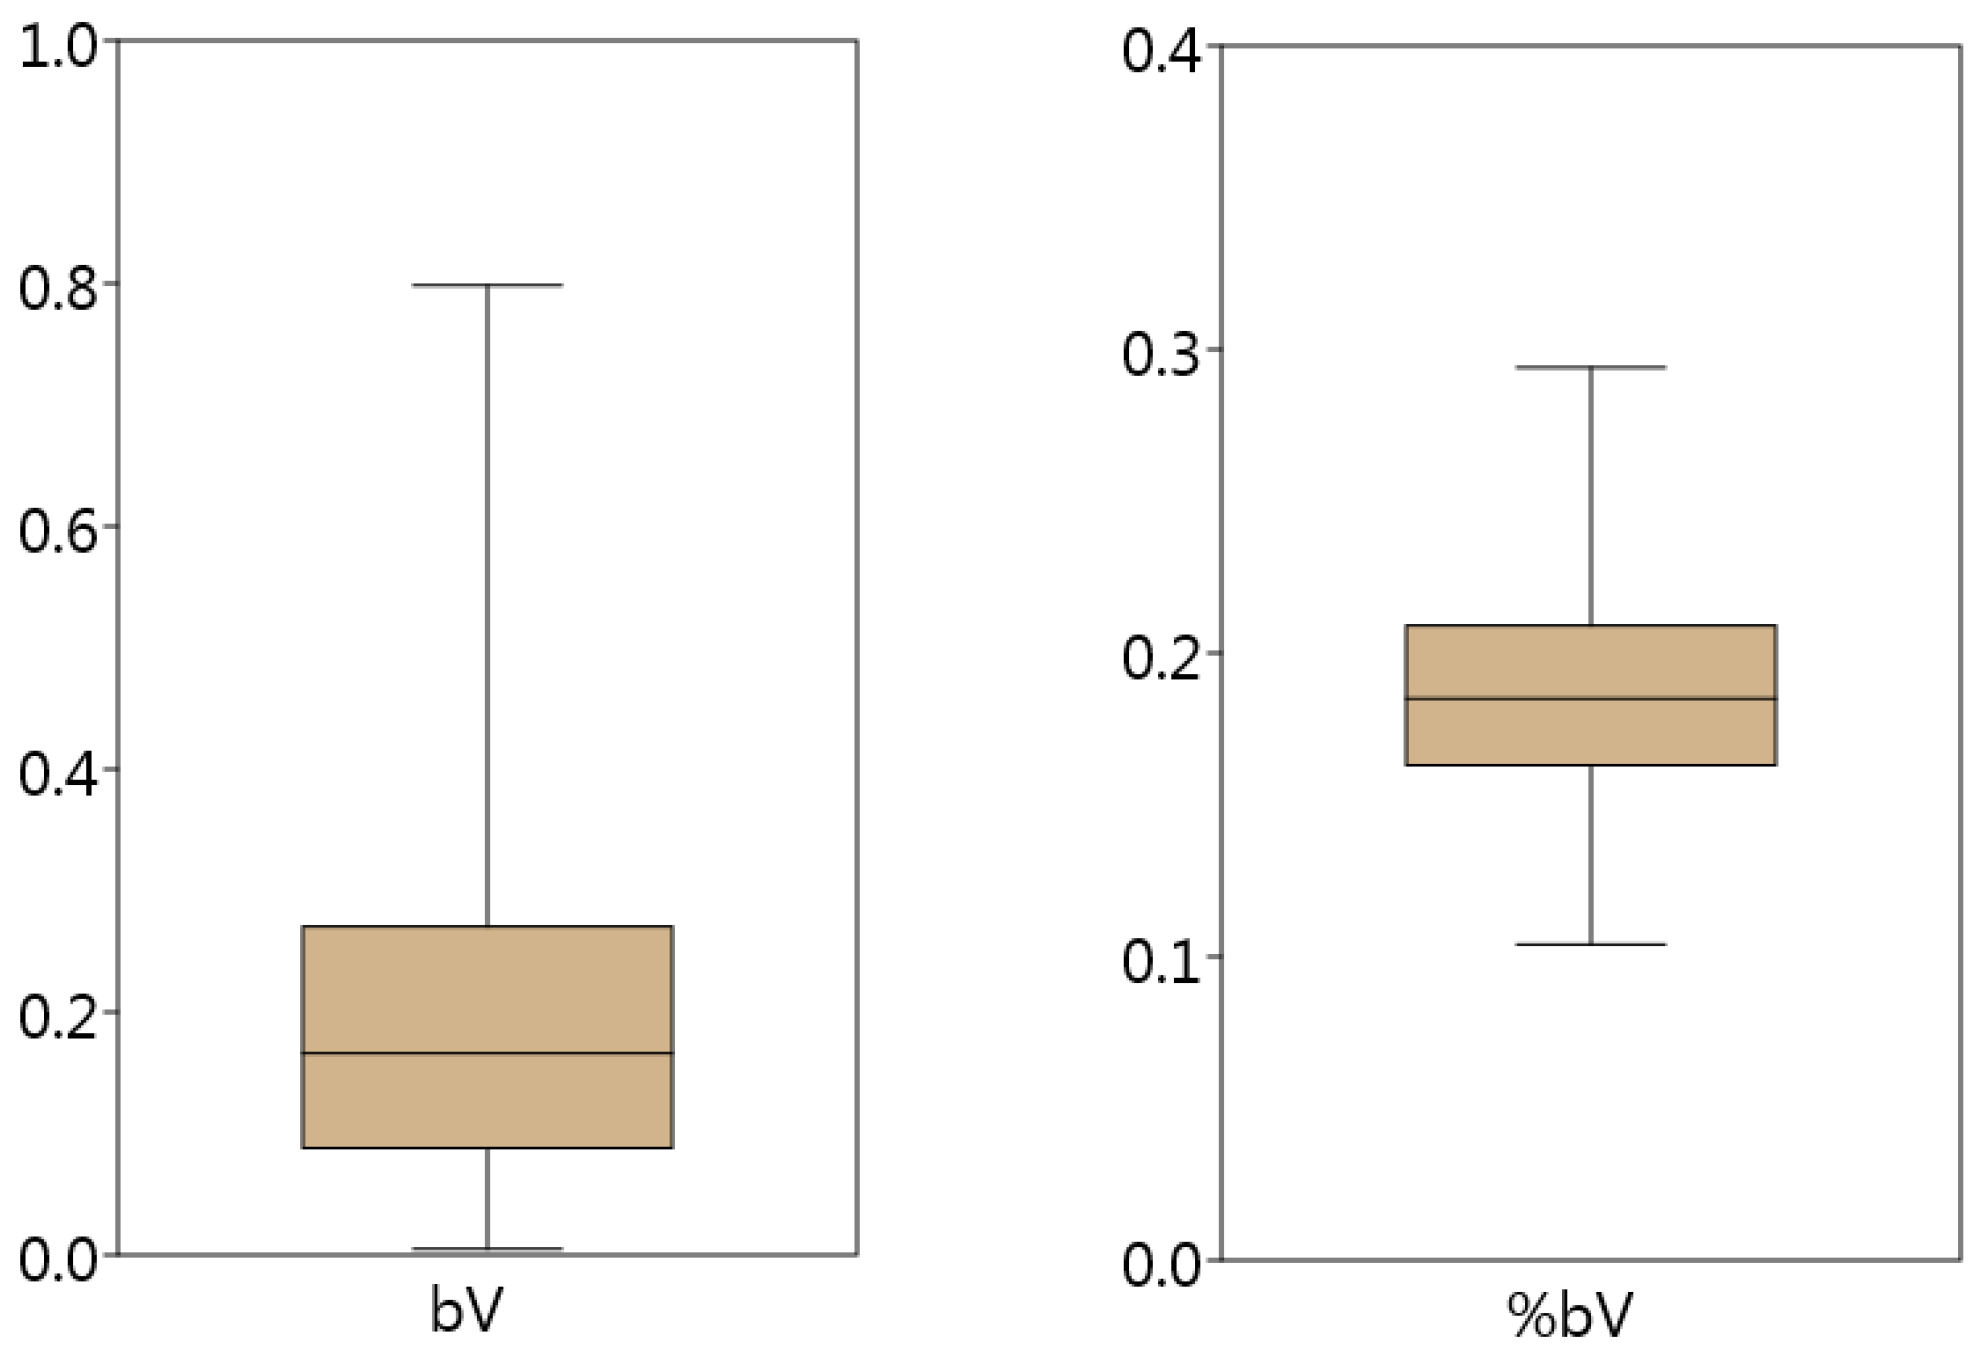
Bark volume of the analyzed larches ranged from 0.0048 to 0.7984 m
3, with mean value amounting to 0.1985 ± 0.006 m
3. Its distribution is characterized by strong positive asymmetry as skewness equals to 1.29 (
Figure 1). Coefficient of variation for that attribute was high end reached 75.5%. In turn, bark volume fraction was not so diversified as its coefficient of variation amounted to 17.7%. Observed values varied from 0.104 to 0.294, with mean amounting to 0.188 ± 0.001. They were rather symmetrically distributed, for skewness reached 0.39 (
Figure 1). These values are a little bit lower than those reported for larch in Europe [
6].
Both bark volume and bark volume fraction varied significantly with regard to the analyzed location, site type, and age class (
p < 0.001). The highest bV was observed for Rogów and Kolbudy (0.2891 ± 0.019 m
3 and 0.2662 ± 0.016 m
3, respectively), while the lowest for Dobrzany (0.1528 ± 0.011 m
3). The more fertile site, the more bark larches have–bV for eutrophic sites equaled to 0.2238 ± 0.008 m
3, while for oligotrophic–0.1364 ± 0.012 m
3. Additionally, older have more bark than younger ones (0.3119 ± 0.015 m
3 (V age class) vs. 0.083 ± 0.006 m
3 (II age class)). For %bV, the highest values were noted in Rogów (0.236 ± 0.026), while the lowest in Kolbudy (0.168 ± 0.02). The least fertile site is characterized with higher values than the other sites (0.200 ± 0.003 vs. 0.182 ± 0.003 and 0.188 ± 0.002). In turn, the oldest trees had lower %bV than the other age classes (0.176 ± 0.003), while the highest values were noted for IV age class (0.192 ± 0.003). Observed relationships confirm previous findings about dependence of bark parameters on various factors [
5,
6,
9].
3.2. Relationships between Bark Parameters and Dendrometric Attributes
Bark volume was significantly and strongly correlated with d (r = 0.939,
p < 0.001), h (r = 0.781,
p < 0.001) and V (r = 0.956,
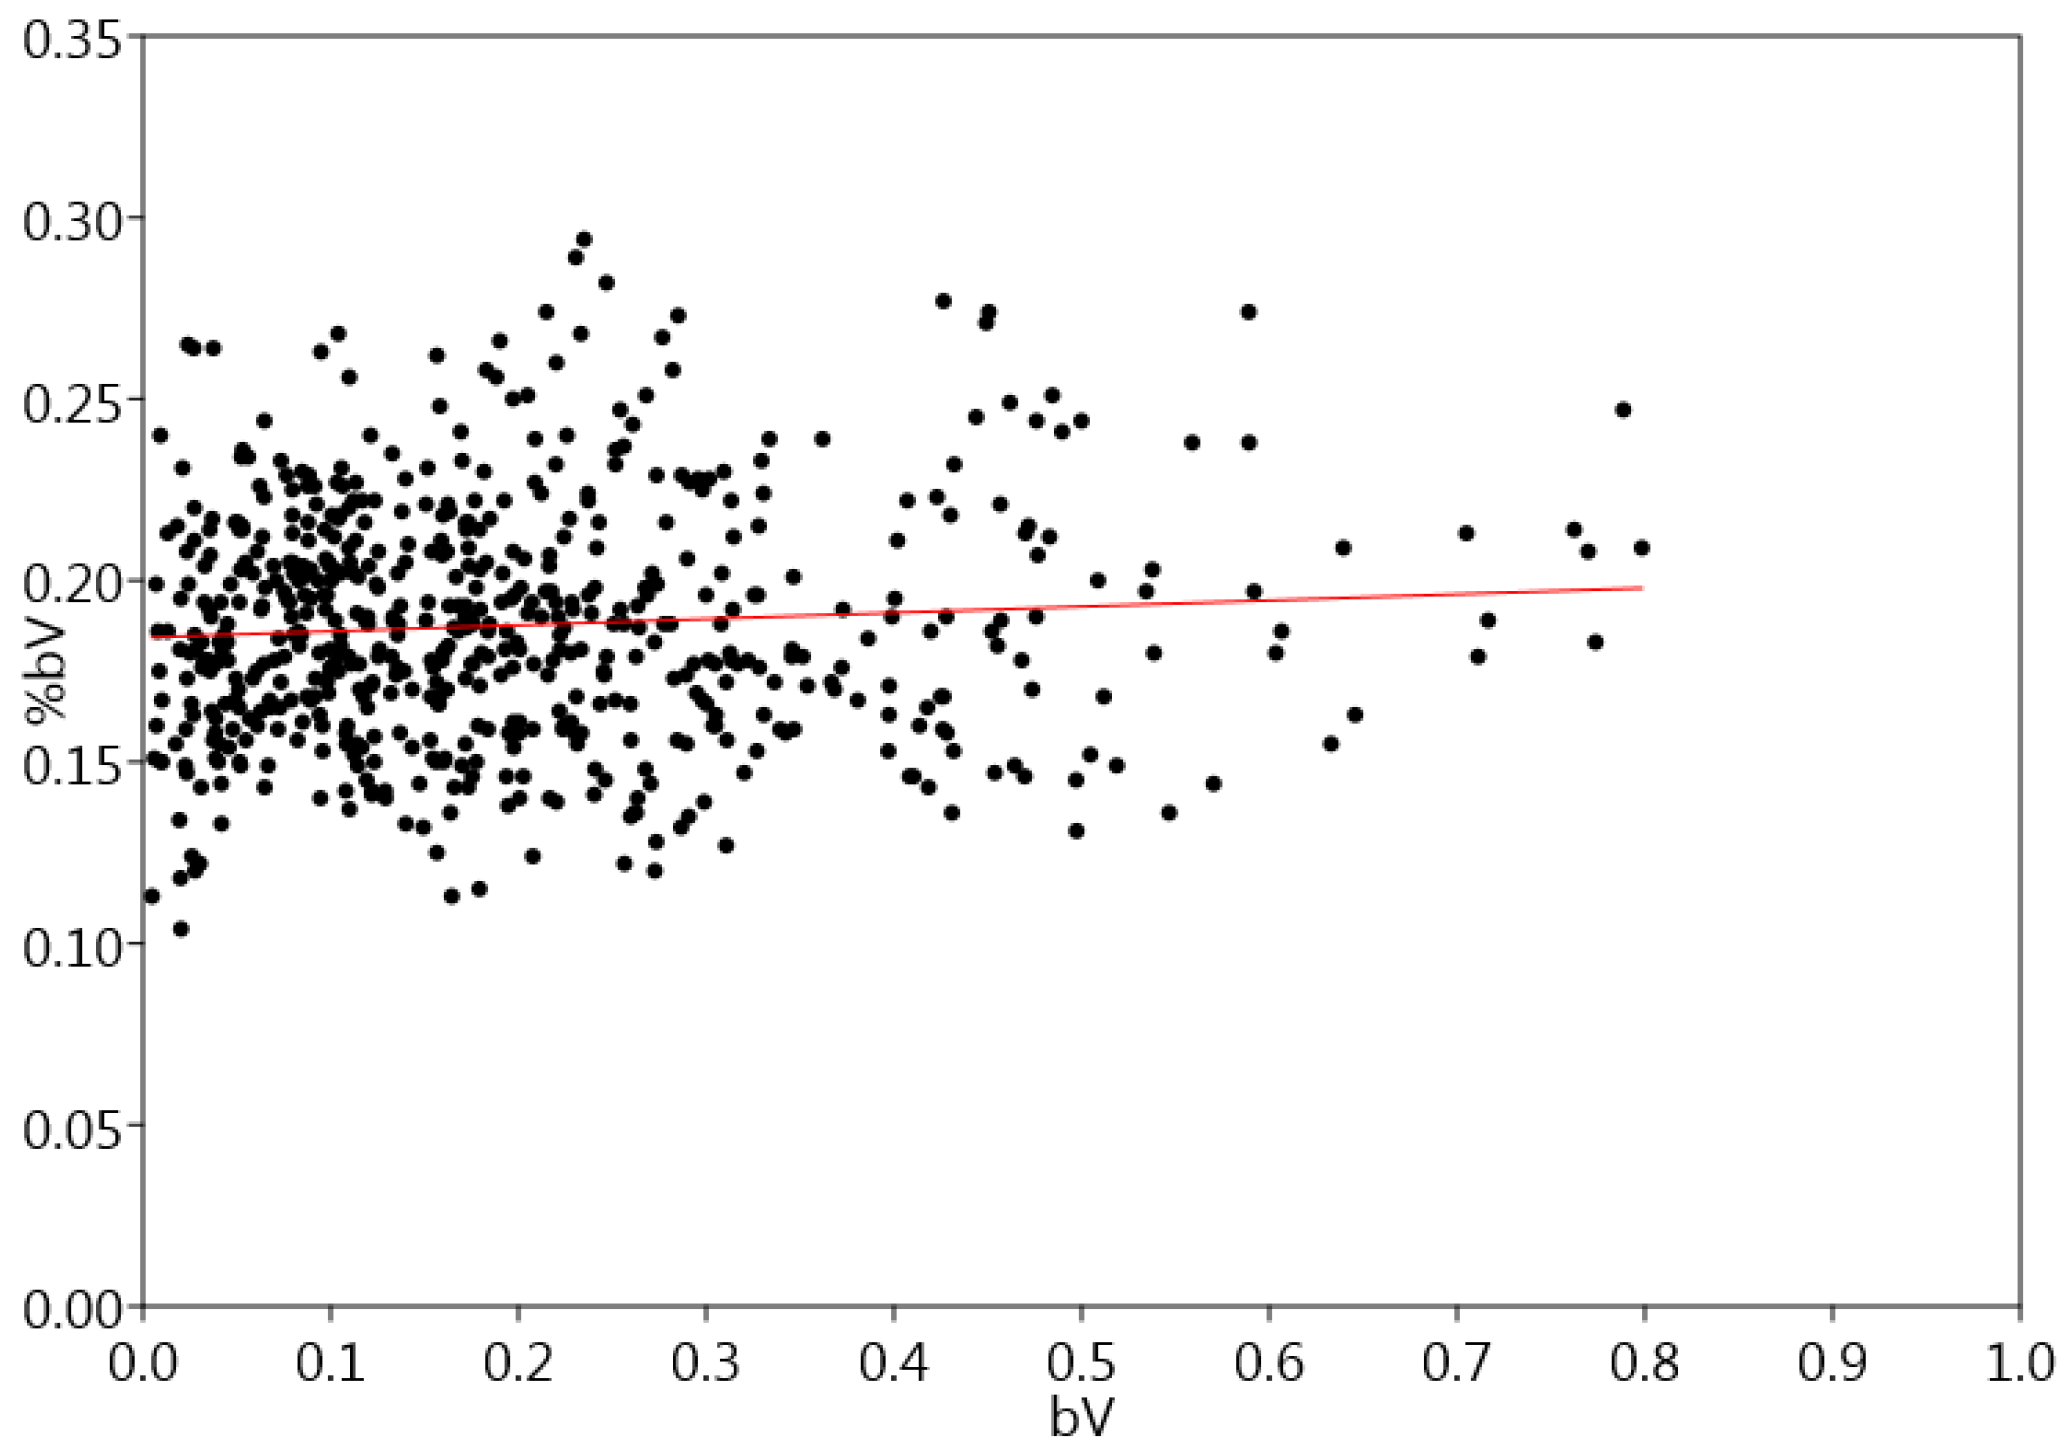
p < 0.001). In turn, for bark volume fraction, we observed weak but significant negative relationship with d (r = −0.106,
p < 0.001), h (r = −0.121,
p =0.003), and V (r = −0.164,
p < 0.001). The analyzed features were insignificantly correlated one to the other (r = 0.077,
p = 0.060) (
Figure 2). Similar relationships are reported for many other species in Latvia [
5] or Mexico [
6].
3.3. Models for Bark Parameters Estimation
For both investigated bark parameters, the lowest AIC values in the case of each independent variable (d, h, and V) were found for linear (Equation (1)) and Michaelis–Menten (Equation (4)) models. Both these equations showed similar performance for bV as well as for %bV. For bark volume, the lowest R
2 and RMSE values characterized models using height as the independent value, while the highest ones were observed for equations based on total tree volume (
Table 1). Such relationship only partially confirms previous findings as height turns to perform weaker as a bark volume descriptor than reported by other authors [
5,
6].
The goodness-of fit measures obtained for the validation dataset proved the good performance of the best models chosen based on AIC for bark volume prediction in the case of d and V as independent variables (
Table 2). For height, R
2 and RMSE values were lower than ones calculated with the calibration dataset. Residues of the validated models were not normally-distributed and their means differed significantly from 0, indicating systematic bias (
Table 2). As models developed for %bV showed poor relationship of this feature with d, h, and V, no validation was performed in that case.
We found significant effect of location on the residuals of the chosen best models for estimation of bark volume (
Table 3), which indicates the necessity of elaboration of locally-based formulae. Site type influenced significantly the residuals of the models based on V as the independent variable, while age class affected the results of models based on the tree’s height.
4. Conclusions
Both analyzed bark parameters varied significantly with regard to location, site type, and age class. Bark volume is strongly and significantly dependent on the tree’s breast height diameter, height, and total volume. For bark volume fraction, this correlation is significant but very weak. The best results of bark volume estimation are achieved for the model with total tree volume as an independent variable. For the weak relationship with dendrometric parameters, modeling of bark volume fraction seems to be pointless and a constant ratio should be applied. Because of the strong effect of location, it is recommended to elaborate locally-based models for bark volume estimation.
Author Contributions
Conceptualization, S.B. and T.C.; methodology, S.B.; K.B. and M.Z.; validation, A.B. and M.Z.; formal analysis, S.B.; investigation, S.B., T.C., R.W. and R.T.; data curation, P.B.; writing—original draft preparation, S.B.; writing—review and editing, S.B.; visualization, S.B; supervision, S.B.; project administration, A.B.; funding acquisition, M.Z. All authors have read and agreed to the published version of the manuscript.
Funding
This research was partially supported by Polish State Forests, National Forest Holding within grant number OR.5001.3.1.2017.
Conflicts of Interest
The authors declare no conflict of interest. The funders had no role in the design of the study; in the collection, analyses, or interpretation of data; in the writing of the manuscript, or in the decision to publish the results.
References
- Cellini, J.M.; Galarza, M.; Burns, S.L.; Martinez-Pastur, G.J.; Lencinas, M.V. Equations of bark thickness and volume profiles at different heights with easy-measurement variables. For. Syst. 2012, 21, 23–30. [Google Scholar] [CrossRef]
- Löwe, R.; Sedmíková, M.; Natov, P.; Jankovský, M.; Hejcmanová, P.; Dvorˇák, J. Differences in Timber Volume Estimates Using Various Algorithms Available in the Control and Information Systems of Harvesters. Forests 2019, 10, 388. [Google Scholar] [CrossRef]
- Polkowski, K.; Zarzyńnski, P.; Tomusiak, R. Accuracy of methods to determine under bark volume of logs according to the PN−D−95000:2002 standard—A case study of Scots pine (Pinus sylvestris L.) from the Płaska Forest District. Sylwan 2019, 163, 460–468. [Google Scholar]
- Doruska, P.F.; Patterson, D.; Hartley, J.; Hurd, M.; Hart, T. Newer technologies and bioenergy bring focus back to bark factor equations. J. For. 2009, 107, 38–43. [Google Scholar]
- Liepinš, J.; Liepinš, K. Evaluation of bark volume of four tree species in Latvia. In Proceedings of the Research for Rural Development–International Scientific Conference, Jelgava, Latvia, 13–15 May 2015. [Google Scholar]
- Wehenkel, C.; Cruz-Cobos, F.; Carrillo, A.; Lujan-Soto, J.E. Estimating bark volumes for 16 native tree species on the Sierra Madre Occidental, Mexico. Scand. J. 2012, 27, 578–585. [Google Scholar] [CrossRef]
- Temesgen, H.; Affleck, D.; Poudel, K.; Gray, A.; Sessions, J. A review of the challenges and opportunities in estimating above ground forest biomass using tree-level models. Scand. J. For. Res. 2015, 30, 326–335. [Google Scholar]
- Hammer, Ø.; Harper, D.A.T.; Ryan, P.D. PAST: Paleontological statistics software package for education and data analysis. Palaeont Electr. 2001, 4, 9. [Google Scholar]
- Stängle, S.M.; Dormann, C.F. Modelling the variation of bark thickness within and between European silver fir (Abies alba Mill.) trees in southwest Germany. Forestry 2018, 91, 283–294. [Google Scholar] [CrossRef]
| Publisher’s Note: MDPI stays neutral with regard to jurisdictional claims in published maps and institutional affiliations. |
© 2020 by the authors. Licensee MDPI, Basel, Switzerland. This article is an open access article distributed under the terms and conditions of the Creative Commons Attribution (CC BY) license (https://creativecommons.org/licenses/by/4.0/).


