Next Article in Journal
Effect of Competition and Climatic Conditions on the Growth of Beech in the Mixed Pine Beech Stand: Lithuanian Case Study
Previous Article in Journal
Empowering Women on Bamboo Utilization and Conservation in the Lake Toba Catchment Area of the North Sumatra Province of Indonesia
 
 
Please note that, as of 4 December 2024, Environmental Sciences Proceedings has been renamed to Environmental and Earth Sciences Proceedings and is now published here.
Proceeding Paper

Spatial-Temporal Analysis of the Forest Fragments Surrounding a Conservation Unit in the Southern Region of Brazil †

1
Mapa SA, Londrina, 86062-660, Brazil [email protected]
2
Federal University of Technology of Paraná State, Londrina 86036-370, Brazil
*
Author to whom correspondence should be addressed.
Presented at the 1st International Electronic Conference on Forests—Forests for a Better Future: Sustainability, Innovation, Interdisciplinarity, 15–30 November 2020; Availvable online: https://iecf2020.sciforum.net.
Environ. Sci. Proc. 2021, 3(1), 48; https://doi.org/10.3390/IECF2020-07876
Published: 11 November 2020

Abstract

:
In recent years, anthropogenic actions have intensified forest fragmentation, causing several damages to the landscape’s natural components, propagating the loss of biodiversity. This study aims to present an analysis of the forest fragments in a conservation unit located at southern of Brazil. The evaluation was carried out for the years 1998, 2008, and 2018, by using landscape metrics and classification of remote sensing imagery of the Landsat satellite. The following metrics were analyzed: area and edge, shape, core area, and aggregation. The results indicated an increase of 16.88% in the total area of vegetation, and the percentage of fragments increased from 16.16% to 18.89%. The number of fragments decreased, resulting in an increase of the mean area in 5.4 ha. The percentage of vegetation under border effect changed from 40.2% to 37.1%. In 1998, the average nearest neighbor distance was 155.4 m, and in 2018, 149.7 m. However, this distance is still classified as a high degree of isolation, which hinders the movement of organisms and the dispersion of species. Thus, all the analyzed metrics indicated a decrease in the fragmentation, except for the edge density metric, in which its increase of 1.86 pointed to a lower degree of conservation during the analyzed period. A study of this nature is important as it provides subsidies for future researches and can contribute to action strategies to be adopted in the management plan of the area.

1. Introduction

Forest fragmentation process has been intensified in recent years, due to anthropic actions, and it has implied in landscapes with low habitat diversity, in which the fragments are isolated and they have reduced dimensions [1]. Simple actions, such as landscape study and adequate management policies, can help in forest patches preservation, which must have suitable size and shape for wild species maintenance, minimizing such consequences.
Knowledge about forest fragmentation stage based on studies which used landscape ecology metrics allow to diagnose current issues and to point out efficient environmental management policies to control the local conditions [2]. In this sense, remote sensing images joined to Geographic Information Systems (GIS) are very important tools to understand the landscape structure, as they allow land use cover mapping, which is essential for impact detection arising from improper handling [3].
The northern region of Paraná State, which is located in southern Brazil, has been suffering with fragmentation due to urbanization process and agricultural and grazing activities [4]. The state park Mata dos Godoy is a conservation unit known for being the most important forest remnant of the entire northern region of Paraná, not only by its extension, but also for its state of conservation, as it is considered very important for preservation strategies as cited in [5]. However, only this forest is not enough to guarantee the region’s biodiversity. It is necessary to establish a reserve system, based on forest fragments [6].
The relation between patches isolation, fragmentation, conservation, and biodiversity is present in the approach of many works. A study of occurrence of maned sloth when there is habitat loss in relation to a critical threshold of forest cover was carried out [7]. Their results showed that the occupancy probability of the species reaches zero in areas with less than 20% of forest cover.
The landscape connectivity and the gene flow using habitat modeling approaches are presented with the aim of mitigating future habitat losses, focused on an isolated population of capercaillie (Tetrao urogallus), in the Western Carpathians [8]. They concluded that the proximity of settlements and the isolation of patches were negative to the connectivity.
Assessment of land use cover change (LUCC) using remote sensing and landscape metrics was performed in an area of Iran [9]. The results achieved showed that the area had suffered drastic changes in 25 years, related to urban expansion, which had caused a high fragmentation in the region, besides turning into a scenario of many environmental impacts.
This study aims to contribute to characterize landscape dynamics, focused in forest patches, for the buffer zone of state park Mata dos Godoy and its influence area, during the period from 1998 to 2018.

2. Materials and Methods

2.1. Study Area

The study area is situated in the northern region of the state of Parana, southern Brazil, as showed in Figure 1. It includes the following municipalities: Londrina (where the state park is located), Assaí, Ibiporã, Califórnia, Apucarana, Arapongas, Sabáudia, Rolândia, and Cambé e Pitangueiras. The total area analyzed exceeds 500 thousand hectares.

2.2. Image Processing

Three Landsat images were used, which were acquired in years of 1998, 2008, and 2018. After clipping the study area, we applied supervised classification methods of Maximum Likelihood, Minimum Distance, and Spectral Angle Mapping [10], aimed at identifying the thematic classes of water, vegetation, agriculture, and bare soil.
In the training step, we collected 20 sample polygons of each class, which were defined by photointerpretation of the color composition image R5G4B3, which means swir infrared in red channel, near infrared in green channel, and visible (blue wavelength) in blue channel. The accuracy of results was evaluated with independent samples (10 polygons of each class), by calculating overall accuracy and kappa index [11].
After obtaining the results of classification, the sieve procedure was executed in order to remove isolated pixels and to homogenize the thematic map. The best result of classification for each year was then selected, according to the biggest values of kappa index and overall accuracy.
An urban area mask was used to overlap the thematic map, with the aim of delimiting an urban class in the final result. We have decided not to include urban class during the classification step due to high confusion with others classes, mainly bare soil, which have similar spectral signature. Thus, data from Global Urban Footprint project [12] were used as this mask.

2.3. Landscape Analysis

Metrics of vegetation class were calculated with Fragstats software [13], according to Table 1.

3. Results

The classification results were considered visually and quantitatively good for the years analyzed. The overall accuracy metric showed that more than 95% of samples tested were correctly classified, which is a value bigger than the established by [14]. The Kappa index presented values above 0.92, which is considered excellent according to the intervals proposed by [15]. Thus, the methods that presented the best results were Maximum Likelihood for years 1998 and 2018, and Minimum Distance for 2008. All calculated indexes are in Table 2.
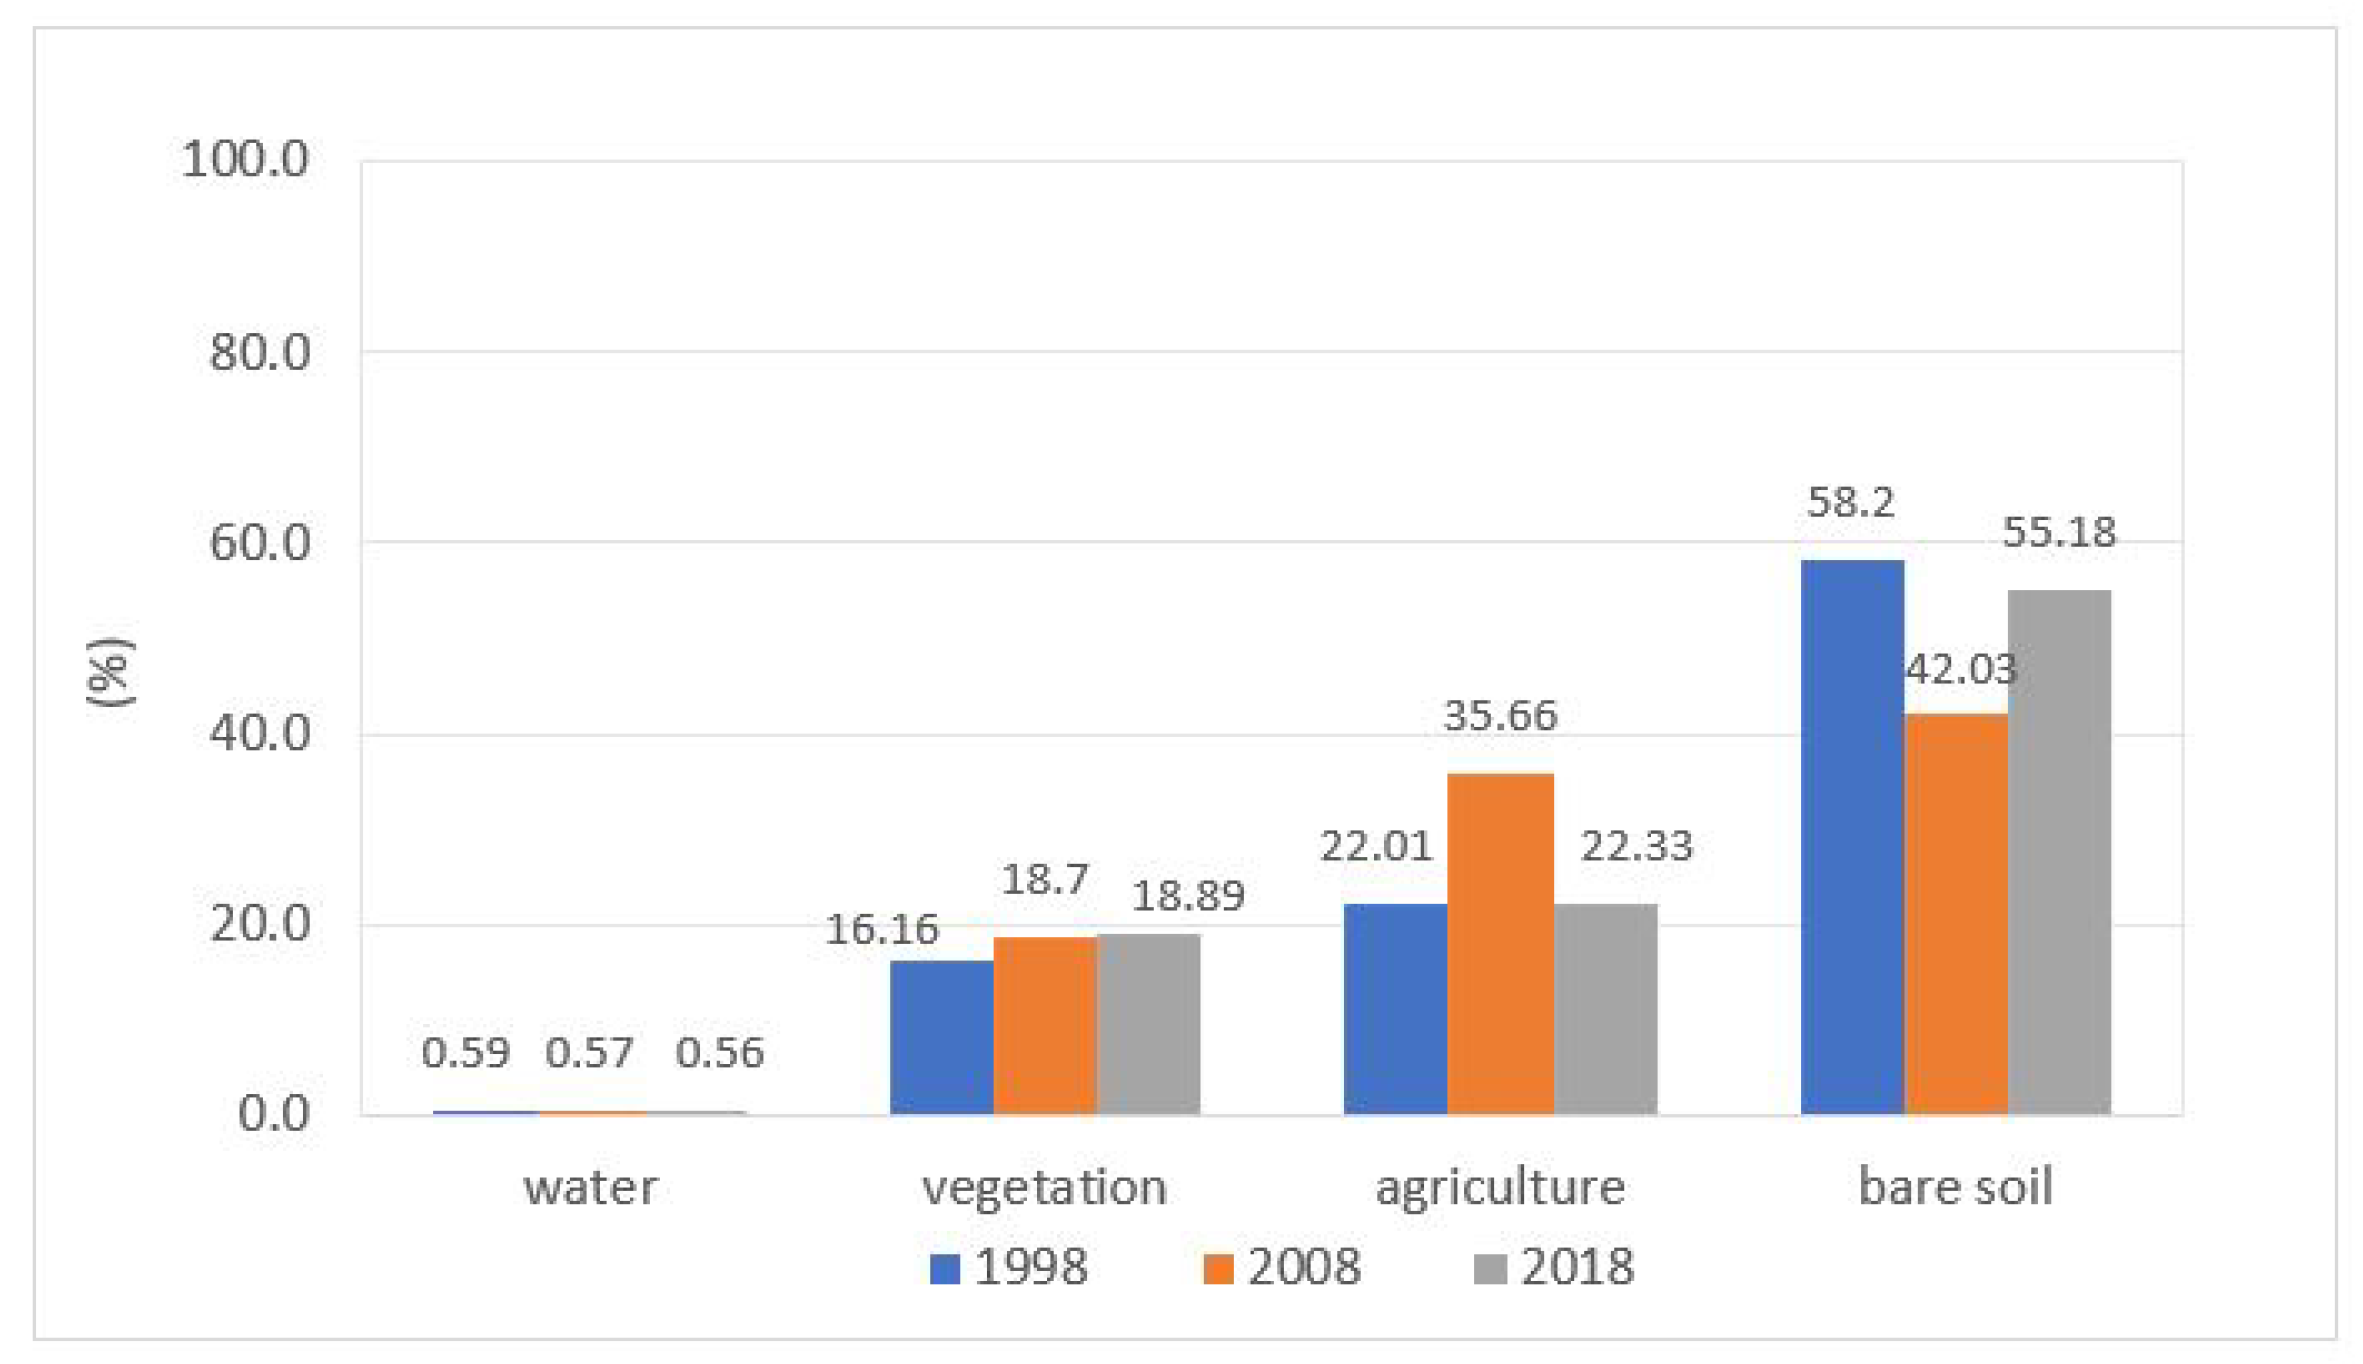
Areas by each class of land use cover maps generated by classification are presented in the graphic of Figure 2. For 2018, there is no expressive change for vegetation in relation to the year of 2008. However, we must emphasize the increasing of 2.73% of vegetation area in the interval of twenty years, from the first to the last date, corresponds to 15,367.41 ha, which is considered quite good.
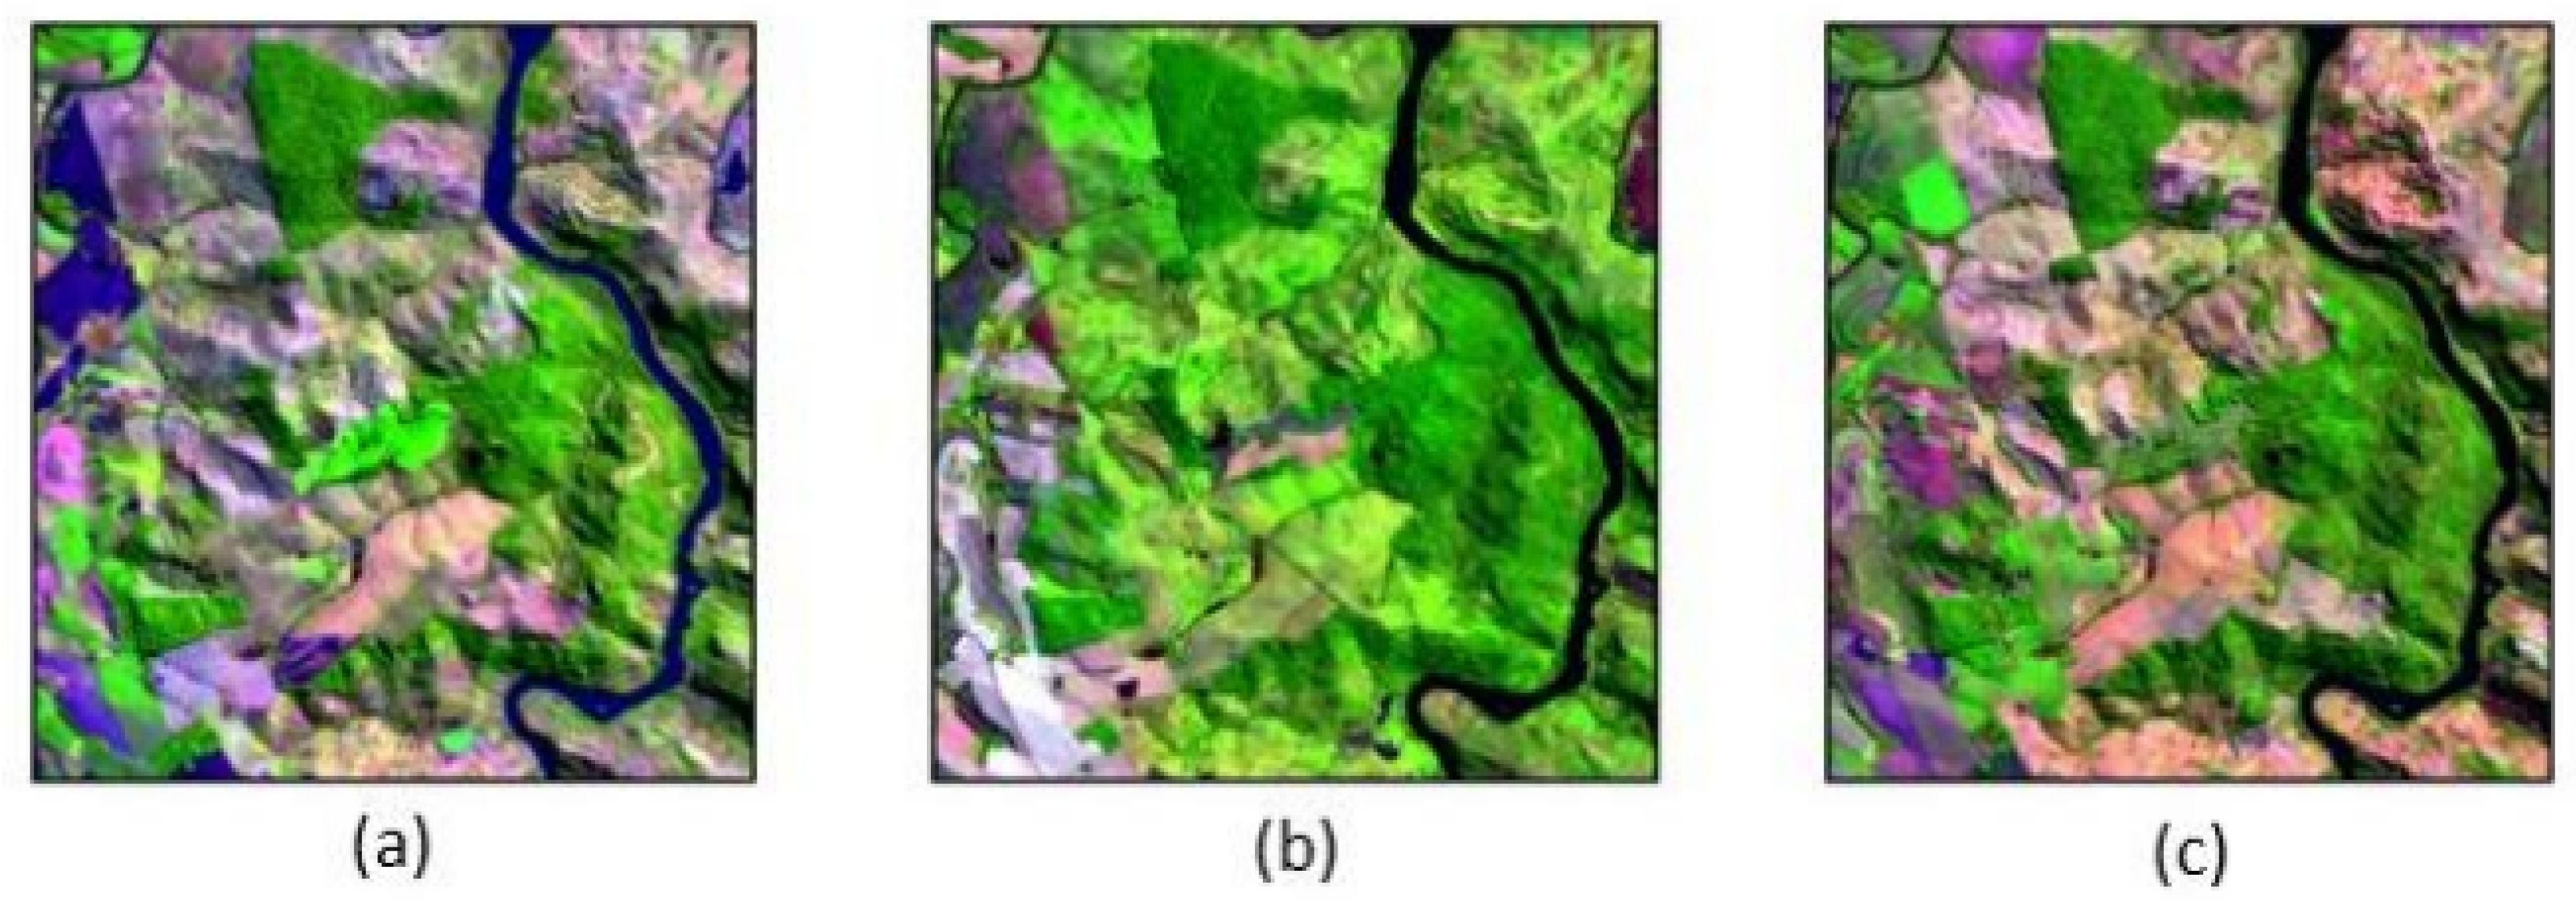
Aiming at searching for examples to verify the veracity of the vegetation increment, a comparison of color composition images in the three years was performed. The result of a small area is shown in Figure 3. It is possible to see some dark green areas, mainly in Figure 3a,c. In Figure 3b, most part of the light green is related to agricultural class, and thus it can not be considered as dense vegetation.
Reduction of fragmentation can be better analyzed if we look only to the vegetation class (Figure 4). In this picture, it is easy to see that the green areas is getting more connected along time.
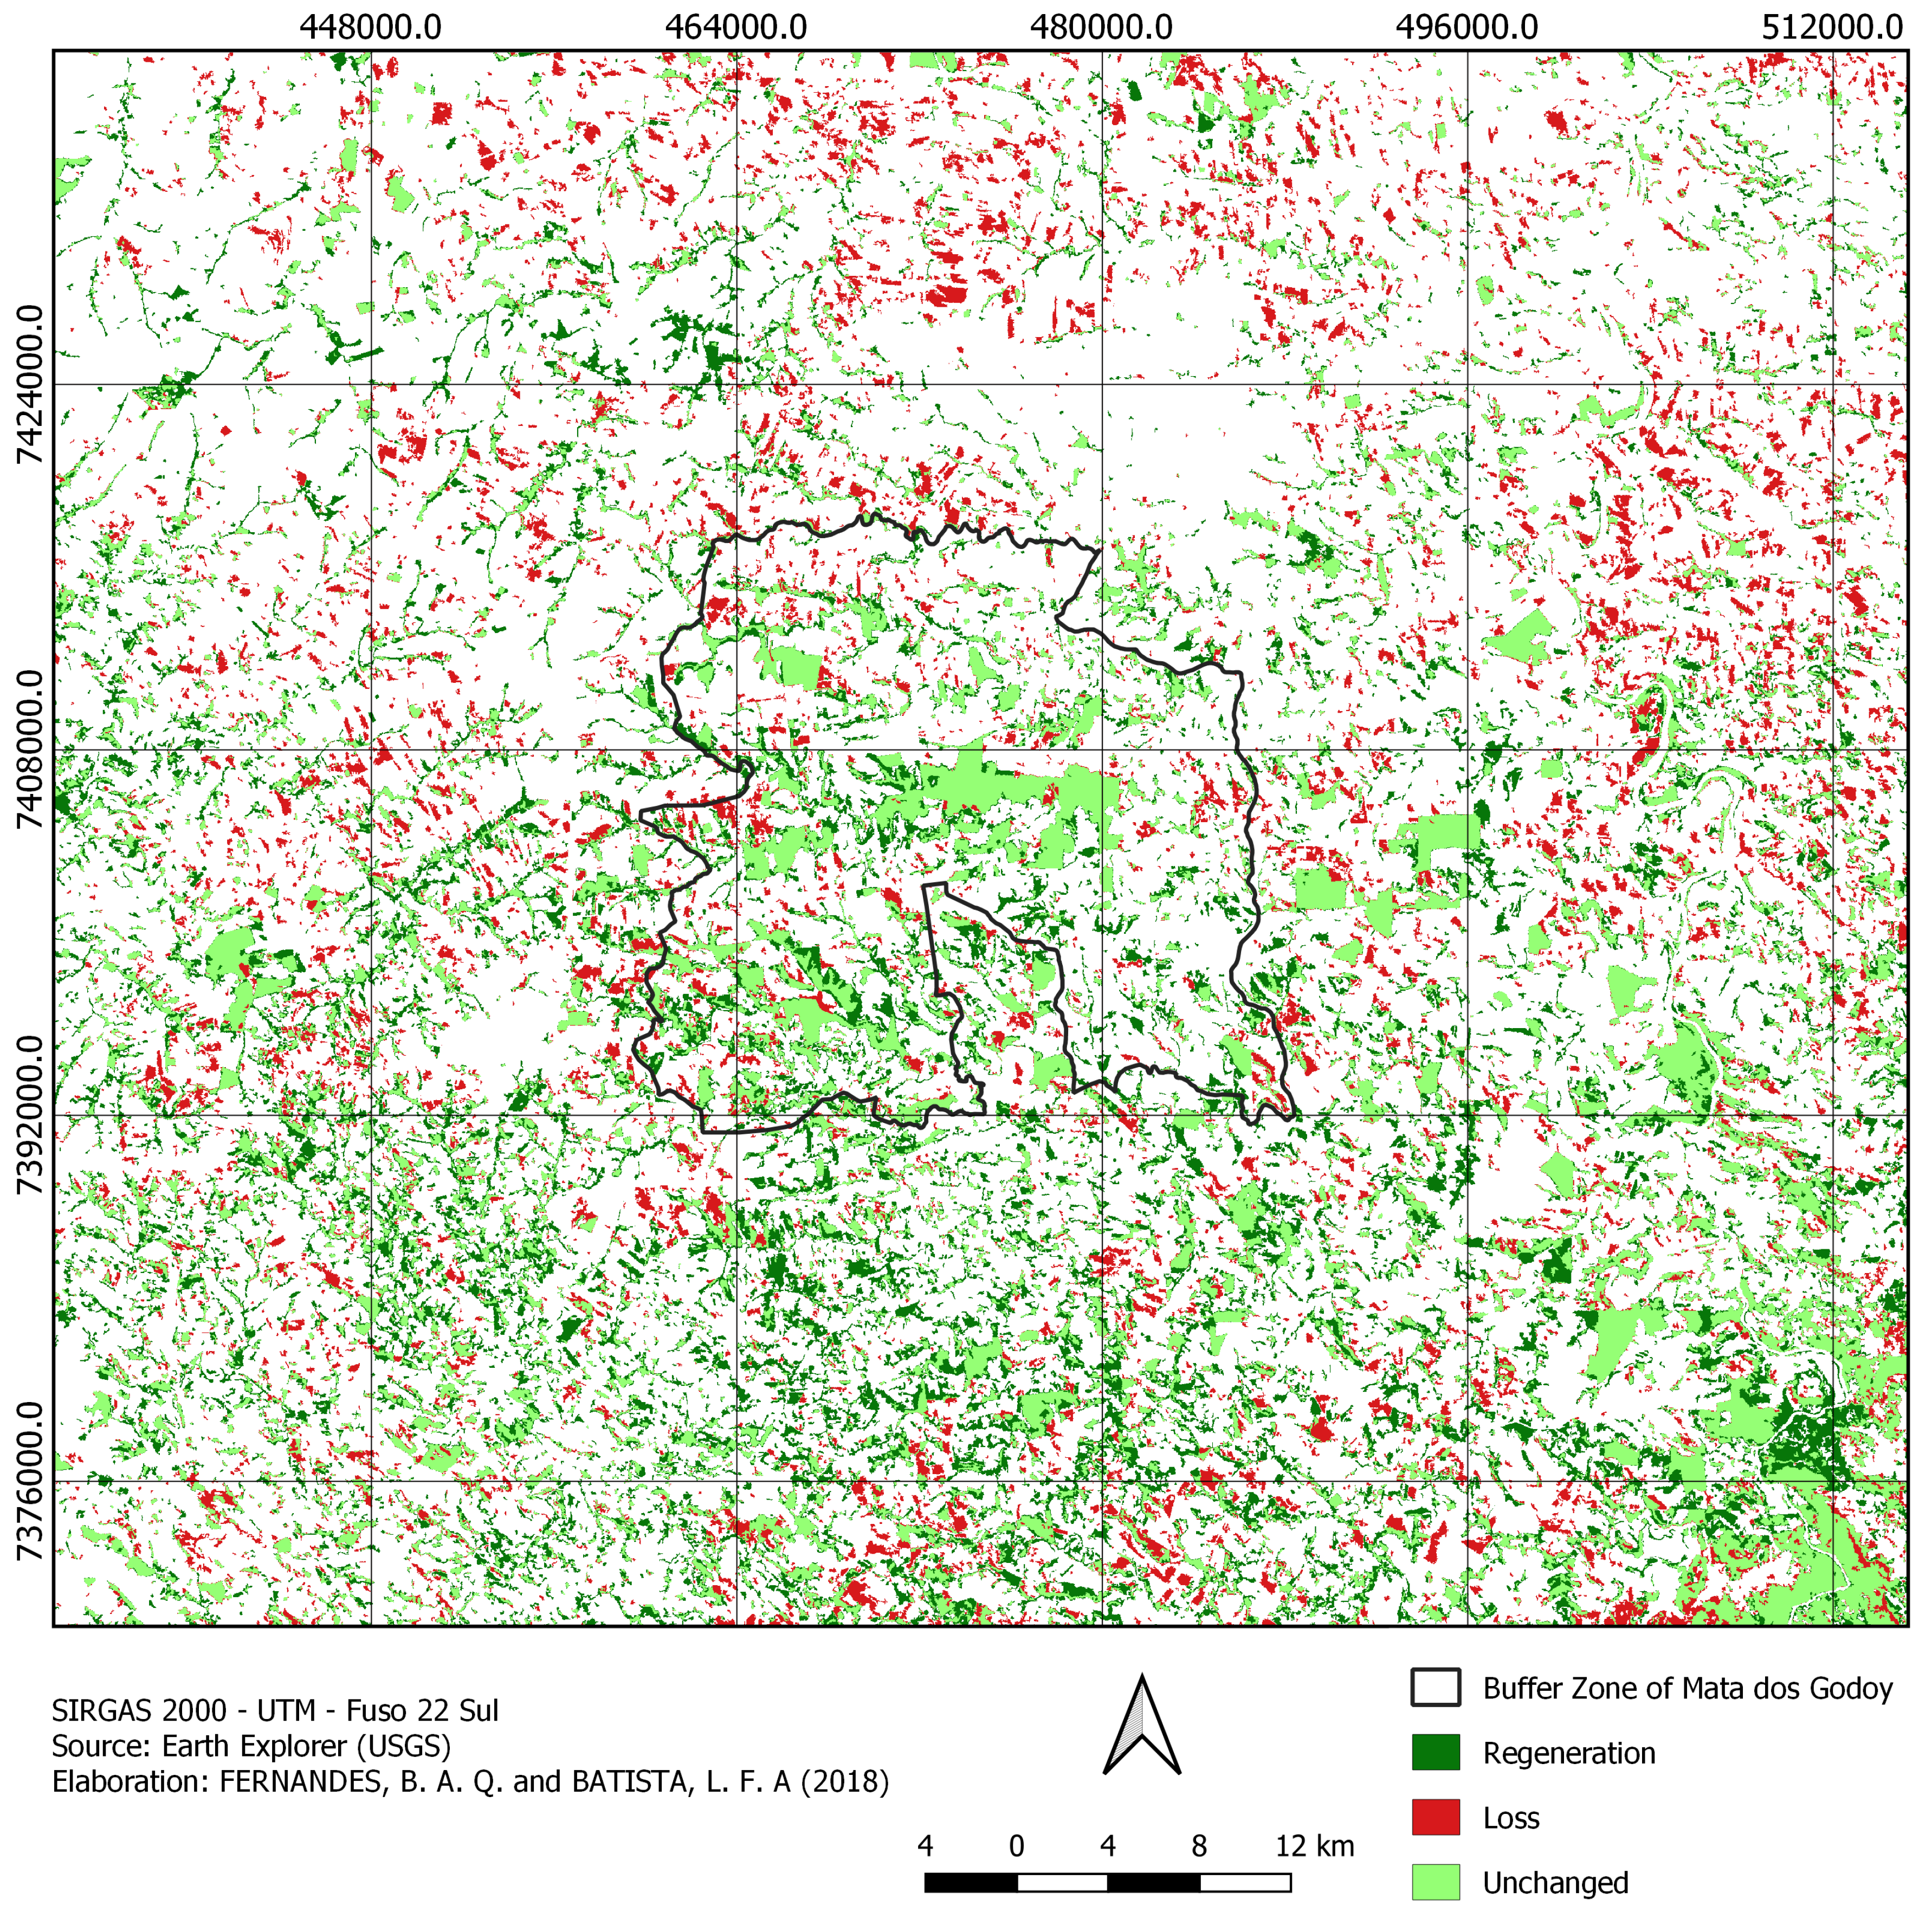
In Figure 5, it is possible to see the changes that occurred in the vegetation class between the years of 1998 and 2018. We observed that the areas where the greatest loss of vegetation is concentrated are very near urban regions, probably because the city expansion reduces the distance between rural and urban regions, modifying the landscape structure.
Table 3 presents the results obtained in the calculation of metrics for the three years analyzed. Land use and cover change observed between 1998 and 2008 resulted in a progressive increase of total area metric (CA) for vegetation class, which increased by 15,367 ha (16.88%) in the time interval of this study.
Referring to the percentage of fragments in landscape (PLAND metrics), that indicates the proportional abundance of vegetation, we verify the 2018 year have gotten the biggest index, around 18.9%, then showing a progressive growth, and an agreement with the previous results of CA metrics and percentage of land use cover (Figure 2). Thus, it demonstrates that vegetation class raise its domain on the landscape matrix, emphasizing our verification that the fragmentation has been reduced.
By analyzing the number of fragments metric (NP) and mean patch size (AREA_MN), it is possible to notice that although the number of vegetation fragments decreased in the studied period (reduction of 2257 patches), their average area increased (more 5.4 ha). It suggests an union of patches instead of their disappearance.
Patches density (PD), which refers to the number of fragments found in 100 ha of the landscape, varied from 1.62 to 1.23 fragments for the year 2018. Although this decrease is not so high, it is similar to the observed for the NP metric, in which the number of fragments decreased.
The metric related to total core area (TCA) presented an increment of 12,447.6 ha, around 23%, in the time interval of this study. This is very positive, as it means a smaller area under border effect, where species are more susceptible to risks and impacts external to their habitat.
The values found for the average shape index (SHAPE_MN) represent a landscape whose vegetation patches have a smooth trend to become irregular, which is evidenced by the increase of 0.103 during the 20 years analyzed.
The edge density metric (ED) has increased from 1998 to 2008, and it has shown a small reduction from 2008 to 2018, but in the whole period there was an increase in relation to the initial value, indicating areas most susceptible to external interference, as the border represents the transition between the fragment’s core, the most protected region, and environments of anthropic interference.
The isolation degree of landscape is quantified by mean of euclidean distance to the nearest patch (ENN_MN). This is very important for ecological processes, as it affects the movement of organisms and the dispersion of species [3]. Although it has decreased along time, around 150 m is still considered a high value [16], which is associated to high degree of isolation.

4. Discussion

The general interpretation of the results indicates a better ecological scenario along time analyzed. Vegetation has increased in relation to total area (CA), percentage in landscape (PLAND), mean patches area (AREA_MN), and total core area (TCA). These four metrics show that preservation and restoration have prevailed in the area analyzed.
The number of fragments (NP) and density (PD) have decreased, as well as mean distance to nearest patch (ENN_MN). Because of this, we can verify that the fragmentation is also smaller, as the values of the metrics of vegetation areas have increased over time. Consequently, isolation has also decreased.
These relatively good situation can be associated to the regulamentation of rural properties, as well as the creation of the state park Mata dos Godoy in the year of 1989 and its management plan, elaborated in 2002. They established specific rules to the occupation and use of resources in the area, aiming to protect the unit conservation. Similar results were found in other areas of Brazil, like the southeast state of Minas Gerais [1].
Although the percentage of landscape area occupied by vegetation has increased in this period, it is important to highlight that the value found is below the minimum established by Brazilian legislation for the preservation of natural vegetation. In every rural property, the Forest Code of 2012 establishes that 20% of the total area of the rural property has to be preserved as a legal reserve.
It is important to emphasize that most forests in Brazil are under degradation [17,18] due of the deforestation processes, and because of this, the edge effect causes carbon losses, mainly in the Amazonia tropical forest [19]. Therefore, what our study showed is an exception to what have been registered in the country.
The decrease in the NP metric can mean union or extinction of fragments of the same class. Extinction occurs when this reduction is accompanied by a decrease in the metrics CA, PLAND, and AREA_MN. On the other hand, the increase in these metrics, which is verified in the present study, means the union of fragments, reinforcing the idea that the process of fragmentation has been decreasing over the years, so the previously fragmented vegetation has given way to continuous areas.
Referring to shape (SHAPE_MN), we observed no significant changes. This metric indicates that the standard shape of the fragment is given when this metric has a value equal to one, resembling to a square. Still, according to the authors, the fragment becomes more susceptible to edge effect, the farther the fragment is from this standard shape and the smaller is your area.
Regarding the density of edge (ED), an increase in its value was noticed, which is associated with the fragmentation of the landscape. Such metric indicated a lower degree of conservation of vegetation, diverging from the results of other metrics, as these pointed to the decrease in the landscape fragmentation in the period considered.
Furthermore, we must emphasize that there are no perfect metrics for habitat fragmentation measurements [20]. Besides, landscape metrics and classification accuracy can be affected by both spatial pattern and by processing methods. Therefore, the magnitude of difference between the results may change depending on the data processing method, and therefore absolute values may need to be interpreted with caution [21].

5. Conclusions

The remote sensing techniques combined with the concepts and metrics of landscape ecology constitute a tool of great importance for the analysis of changes in landscape fragmentation in the study area. In this context, it was possible to understand the structure and dynamics of the forest mosaic, in addition to the diagnosis in relation to the evolution and conservation of vegetation, in the period of time analyzed.
These conclusions can contribute to the decisions on action strategies to be adopted in the state park Mata dos Godoy management plan, increasing the chance of success of conservation programs, as it enables the application of resources in strategic locations. We must emphasize the importance of the application of techniques like these that allow the analysis of large extensions areas, allowing a synoptic assessment, given the continental dimensions of our country.
Integrated assessment of biological diversity and ecological processes in the landscape is essential, for the definition of management and zoning of protected areas, such as delimitation of priority areas to be conserved, environmental risk and recovery areas, creation of systems agroforestry, as well as for the establishment of ecological corridors, in order to minimize problems of low genetic variability, so contributing to the sustainable use of the region.

Author Contributions

Conceptualization, L.B. and B.F.; methodology, L.B.; investigation, B.F.; resources, B.F.; data curation, B.F.; writing—original draft preparation, B.F and L.B.; writing—review and editing, L.B.; visualization, B.F.; supervision, L.B.; project administration, L.B. All authors have read and agreed to the published version of the manuscript.

Funding

This research received no external funding.

Acknowledgments

We are thankful for Federal University of Technology of Parana State, Campus Londrina, by the support provided to this work.

Conflicts of Interest

The authors declare no conflict of interest.

References

  1. Calegari, L.; Martins, S.V.; Gleriani, J.M.; Silva, E.; Busato, L.C. Análise da dinâmica de fragmentos florestais no município de Carandaí, MG, para fins de restauração florestal. Rev. Árvore 2010, 34, 871–880. [Google Scholar] [CrossRef]
  2. Abdalla, L.D.S.; Madureira, C. Análise de fragmentação florestal no município de Silva Jardim, APA do Rio São João, RJ. Rev. Bras. Cartogr. 2015, 67, 169–184. [Google Scholar]
  3. Cemin, G.; Schneider, V.E.; Finotti, A.R.; Reginato, P.A.R. Análise estrutura da paisagem da sub-bacia do Arroio Boa Vista, RS: uma abordagem em Ecologia de Paisagem; Anais do XIII Simpósio Brasileiro de Sensoriamento Remoto: Florianópolis, Brasil, 2007; pp. 3821–382. [Google Scholar]
  4. Herrmann, B.C.; Rodrigues, E.; Lima, A.D. A paisagem como condicionadora de bordas de fragmentos florestais. Floresta 2005, 35, 13–22. [Google Scholar] [CrossRef]
  5. Molina, J.M.P. Orchidaceae Juss. No Parque Estadual Mata dos Godoy e Entorno, Paraná, Brasil; Mathesis, Universidade Estadual de Londrina: Londrina, Brazil, 2014. [Google Scholar]
  6. Torezan, J.M.D.; Souza, R.F.d.; Ruas, P.M.; Ruas, C.d.F.; Camargo, E.H.; Vanzela, A.L.L. Genetic variability of pre and post-fragmentation cohorts of Aspidosperma polyneuron Muell. Arg. (Apocynaceae). Braz. Arch. Biol. Technol. 2005, 48, 171–180. [Google Scholar] [CrossRef]
  7. Santos, P.M.; Bailey, L.L.; Ribeiro, M.C.; Chiarello, A.G.; Paglia, A.P. Living on the edge: Forest cover threshold effect on endangered maned sloth occurrence in Atlantic Forest. Biol. Conserv. 2019, 240. [Google Scholar] [CrossRef]
  8. Klinga, P.; Mikolas, M.; Smolko, P.; Tejkal, M.; Hoglund, J.; Paule, L. Considering landscape connectivity and gene flow in the Anthropocene using complementary landscape genetics and habitat modelling approaches. Landsc. Ecol. 2019, 34, 521–536. [Google Scholar] [CrossRef]
  9. Jaafari, S.; Sakieh, Y.; Shabani, A.A.; Danehkar, A.; Akbar Nazarisamani, A. Landscape change assessment of reservation areas using remote sensing and landscape metrics (case study: Jajroud reservation, Iran). Environ. Dev. Sustain. 2016, 18, 1701–1717. [Google Scholar] [CrossRef]
  10. Richards, J.A.; Jia, X. Remote Sensing Digital Image Analysis: An Introduction, 4th ed.; Springer: New York, NY, USA, 2006. [Google Scholar]
  11. Congalton, R.G. A review of assessing the accuracy of classifications of remotely sensed data. Remote. Sens. Environ. 1991, 37, 35–46. [Google Scholar] [CrossRef]
  12. Esch, T.; Bachofer, F.; Heldens, W.; Hirner, A.; Marconcini, M.; Palacios-Lopez, D.; Roth, A.; Üreyen, S.; Zeidler, J.; Dech, S.; et al. Where We Live—A Summary of the Achievements and Planned Evolution of the Global Urban Footprint. Remote. Sens. 2018, 10. [Google Scholar] [CrossRef]
  13. McGarigal, K.; Cushman, S.; Neel, M.; Ene, E. FRAGSTATS –—Spatial Pattern Analysis Program for Categorical Maps; University of Massachusetts: Amherst, MA, USA, 2002. [Google Scholar]
  14. Jensen, J. Introductory Digital Image Processing; Prentice Hall: Upper Saddle River, NJ, USA, 1986. [Google Scholar]
  15. Landis, J.R.; Koch, G.G. The Measurement of Observer Agreement for Categorical Data. Biometrics 1977, 33, 159–174. [Google Scholar] [CrossRef] [PubMed]
  16. Almeida, C.G. Análise Espacial dos Fragmentos Florestais na área do Parque Nacional dos Campos Gerais, Paraná; Mathesis, Universidade Estadual de Ponta Grossa: Ponta Grossa, Brazil, 2008. [Google Scholar]
  17. Pinheiro, E.A.L.; Camini, N.A.; Soares, M.R.S.; Sumida, S.S. Cellular Automata Model—Landscape Dynamics Simulation Tool in the Process of Change in Land Use and Cover in the City of GaÚCha Do Norte—Mt. In Proceedings of the 2020 IEEE Latin American GRSS ISPRS Remote Sensing Conference (LAGIRS), Santiago, Chile, 22–26 March 2020; pp. 225–229. [Google Scholar] [CrossRef]
  18. Pascoal, L.M.L.; Parente, L.L.; Sérgio Nogueira, H.M.; Júnior, L.G.F. Deforestation Polygon Assessment Tool: Providing Comprehensive Information On Deforestation In The Brazilian Cerrado Biome. In Proceedings of the 2020 IEEE Latin American GRSS ISPRS Remote Sensing Conference (LAGIRS), Santiago, Chile, 22–26 March 2020; 428–433. [Google Scholar] [CrossRef]
  19. Silva Junior, C.H.L.; Aragão, L.E.O.C.; Anderson, L.O.; Fonseca, M.G.; Shimabukuro, Y.E.; Vancutsem, C.; Achard, F.; Beuchle, R.; Numata, I.; Silva, C.A.; et al. Persistent collapse of biomass in Amazonian forest edges following deforestation leads to unaccounted carbon losses. Sci. Adv. 2020, 6. [Google Scholar] [CrossRef] [PubMed]
  20. Wang, X.; Blanchet, F.G.; Koper, N. Measuring habitat fragmentation: An evaluation of landscape pattern metrics. Methods Ecol. Evol. 2014, 5, 634–646. [Google Scholar] [CrossRef]
  21. Lechner, A.M.; Reinke, K.J.; Wang, Y.; Bastin, L. Interactions between landcover pattern and geospatial processing methods: Effects on landscape metrics and classification accuracy. Ecol. Complex. 2013, 15, 71–82. [Google Scholar] [CrossRef]
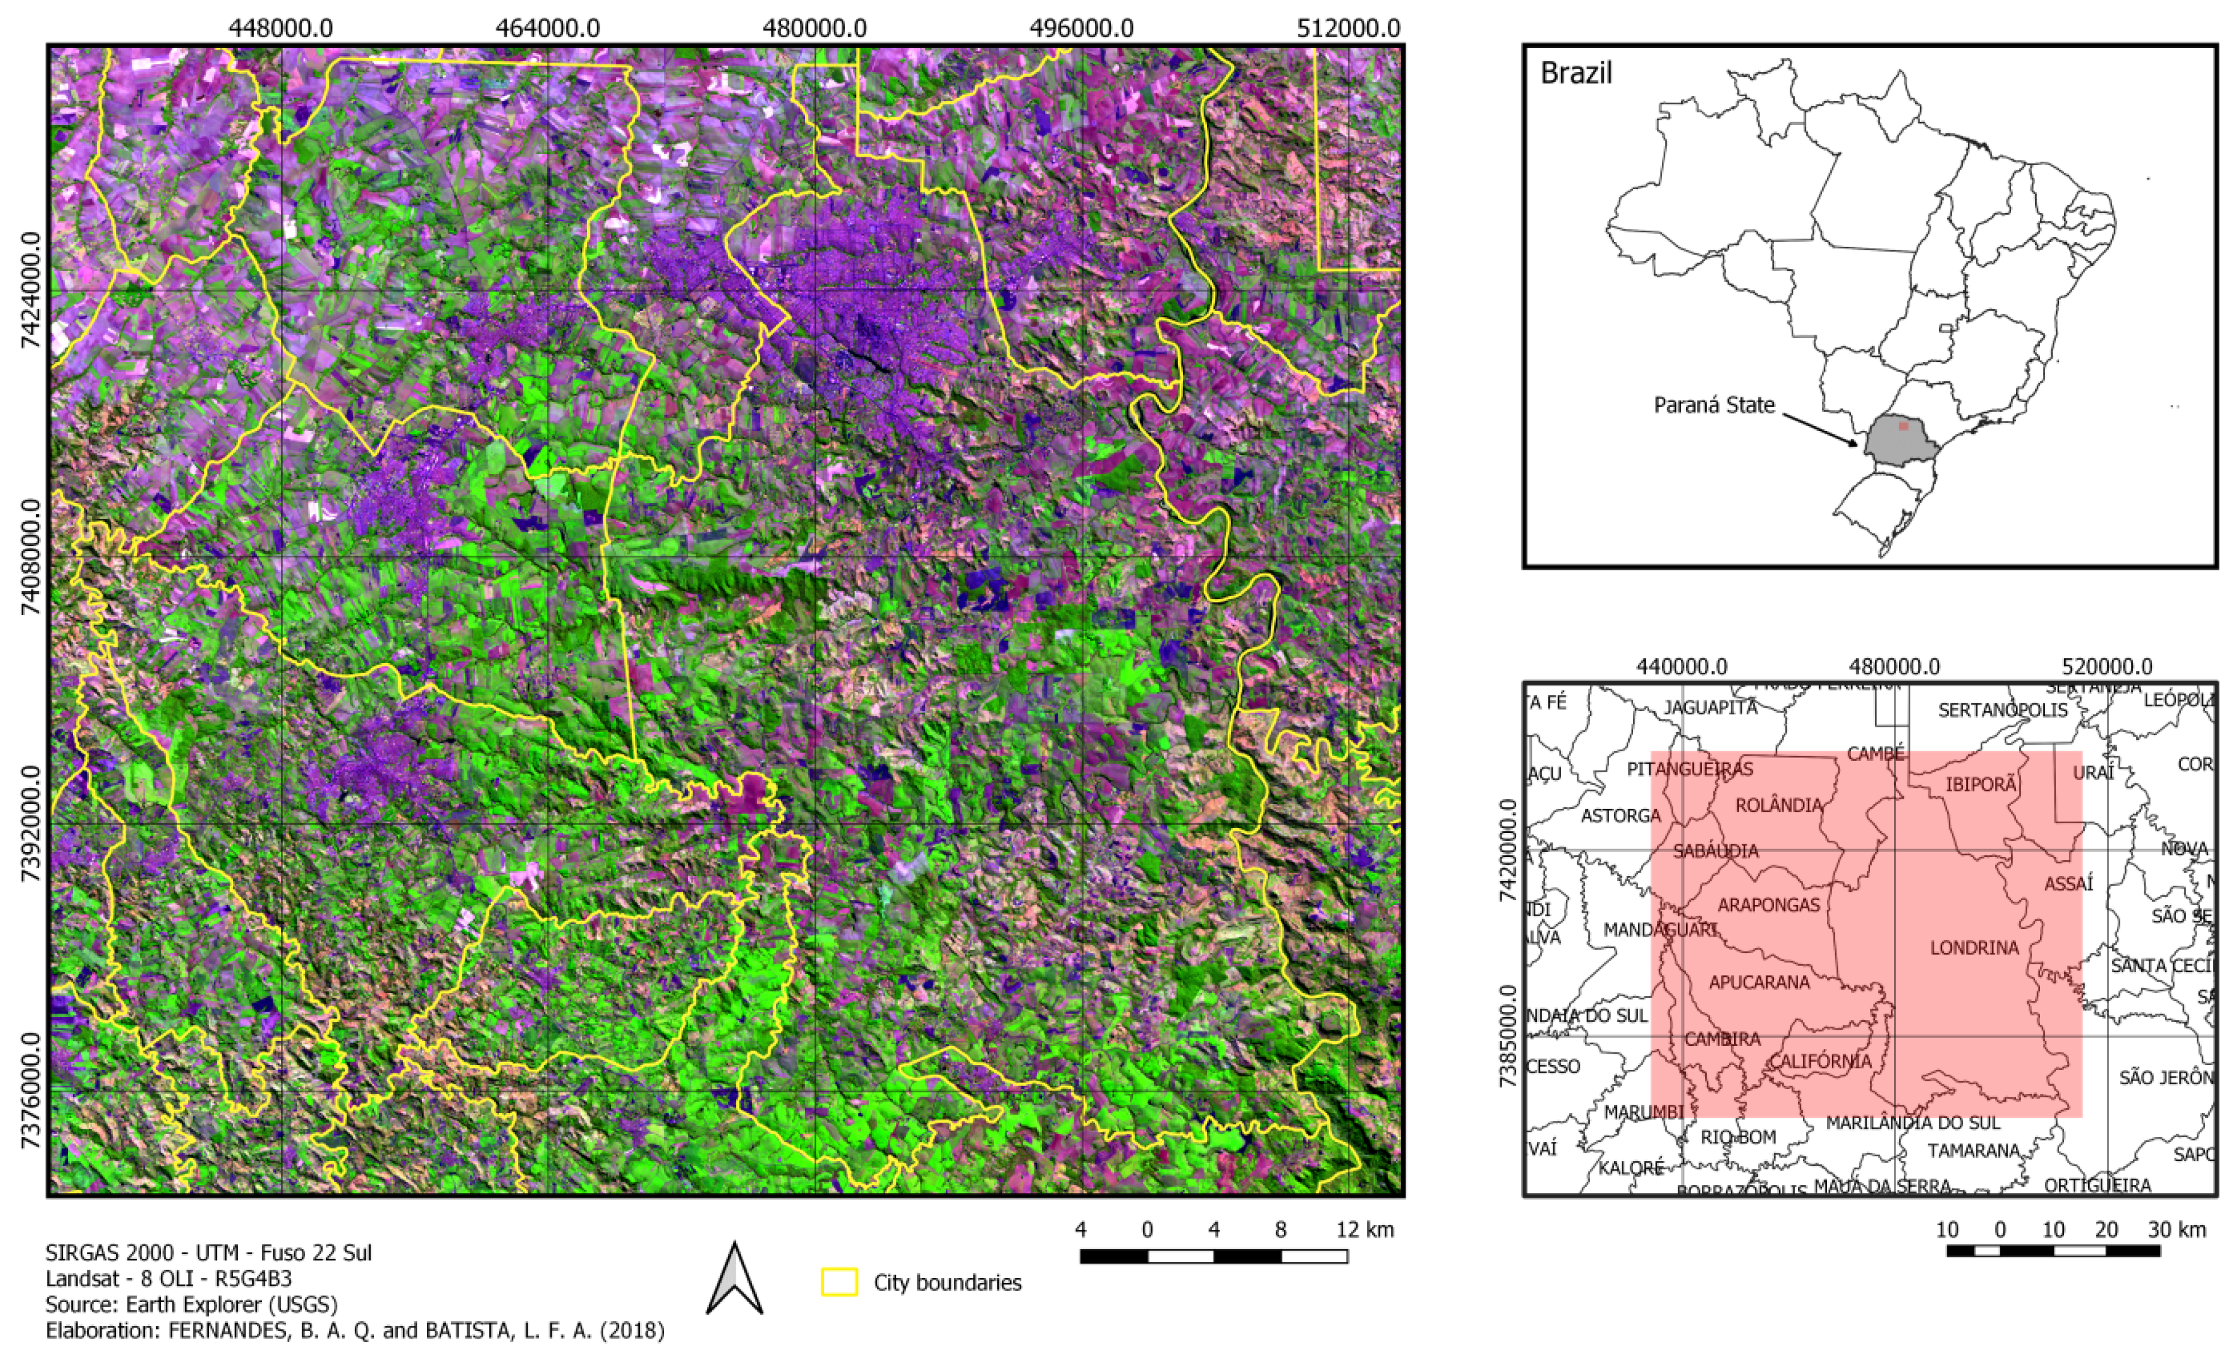
Figure 1. Study area.
Environsciproc 03 00048 g001
Figure 2. Areas of each class by year.
Environsciproc 03 00048 g002
Figure 3. Details of color composition of images of years (a) 1998, (b) 2008, and (c) 2018.
Environsciproc 03 00048 g003
Figure 4. Detail of fragmentation reduction of years (a) 1998, (b) 2008, and (c) 2018.
Environsciproc 03 00048 g004
Figure 5. Change vegetation map from 1998 to 2018.
Environsciproc 03 00048 g005
Table 1. Landscape ecology metrics used in this work.
NameDefinitionUnits
Mean patch size (Area_MN)Mean area of the patchesha
Total class area (CA)Sum of the area of all patchesha
Total Core Area (TCA)Sum of total core area of patchesha
Edge Density (ED)Sum of edge lengths in relation to total aream/ha
Distance (ENN_MN)Average of euclidean distance to the nearest patchm
Percentage of landscape (PLAND)Percentage of the vegetation in landscapePercent
Shape Index (SHAPE_MN)Mean shape index of patchesdimensionless
Number of Patches (NP)Number of vegetation patchesdimensionless
Patch density (PD)Number of patches by 100 hadimensionless
Table 2. Accuracy classification methods. OA = Overall accuracy.
Method199820082018
OAKappaOAKappaOAKappa
Maximum likelihood98.76%0.9895.51%0.93100.00%1
Minimum distance97.19%0.9696.88%0.95100.00%1
Spectral Angle Mapping95.93%0.9496.25%0.9495.06%0.92
Table 3. Results of calculated metrics by year.
Metrics199820082018
CA (ha)91,016.73105,298.02106,384.14
PLAND (%)16.1618.7018.89
AREA_MN (ha)9.9912.7415.39
ED (m/ha)34.138.4535.96
TCA (ha)54,460.7163,160.6566,908.34
SHAPE_MN1.761.831.86
NP917082676913
PD (nº/100 ha)161714681228
ENN_MN (m)155.41144.61149.72
Publisher’s Note: MDPI stays neutral with regard to jurisdictional claims in published maps and institutional affiliations.