Abstract
Over the past few years, the effects of global warming have become more pronounced, particularly with the melting of the polar ice caps. This has led to an increase in sea levels, which poses a threat of flooding to coastal cities and islands. Furthermore, monitoring and analyzing changes in water levels has proven effective for predicting natural disasters caused by the rising sea levels. One vital factor in understanding the impact of global warming is the sea surface height (SSH). Measuring the SSH can provide valuable information about changes in ocean levels. This study used data from the Jason 2 altimetry radar satellite, which provided 36 cycle periods per year, to investigate the water heights around the Hawaiian Islands in 2019. To accurately evaluate the water height variations, a specific area near the Pacific Ocean close to the Hawaiian Islands was selected. By analyzing the collected satellite data, a chart of water heights was generated, which showed an overall increase in the height over one year. This analysis provided evidence of changing ocean levels in the region, highlighting the urgency of addressing the potential threats faced by coastal communities. This study also explored several factors that contribute to water height variations, such as the sea surface temperature, precipitation, and sea surface pressure in the Google Earth Engine cloud-based platform. Algorithms, including MLP and XGBOOST, were used to model the water height within the specified range. The results showed that the XGBOOST algorithm was superior in accurately predicting the water height, with an impressive R-squared value of 0.95. In comparison, the MLP algorithm achieved an R-squared value of 0.92. This study shows that advanced machine learning techniques are effective in understanding and modeling the complex changes in the water height due to climate change. This information can help policymakers and local authorities make informed decisions and create strategies to protect coastal cities and islands from the growing threats of rising sea levels. Taking proactive measures is crucial in reducing the risks posed by more frequent and severe natural disasters caused by global warming.
1. Introduction
Anthropogenic climate change has a significant impact on the planet, particularly through rising sea levels. However, the rate of sea level rise (SLR) is not consistent across oceans and varies over time due to a complex interplay of ocean dynamics, heat absorption, and surface forcing [1]. Radar satellite altimetry is a crucial technique for collecting precise global data on the sea level and monitoring various geophysical characteristics of water bodies. Over the past four decades, satellite altimetry has revolutionized geosciences, particularly oceanography, geophysics, and geodesy. This method has been instrumental in Earth shape modeling, studying gravity acceleration, seabed relief mapping, monitoring coastal vertical displacements, and observing climate phenomena and long-term changes [2]. Human activities are impacting Earth’s climate and shaping the planet. Global warming, caused by humans, is making the oceans warmer and causing ice to melt, resulting in rising sea levels. This is changing the physical shape of our planet. Satellites like TOPEX-Poseidon, Jason-1, Jason-2, and Jason-3 have been crucial in tracking these changes since the 1990s. These satellites measure sea-level changes and have improved our understanding of how heat is stored and distributed in the oceans. They show us how fast our climate is changing [3]. Using satellite altimetry data to track changes in the average sea level is an important way to monitor climate change [4]. Currently, the assessments show a clear rise in the sea level, increasing by around 3.1 ± 0.4 mm per year [5]. Using remote sensing data [6] is crucial for (CC), natural hazards (NHs) [7,8], and environmental science [9], On the other side, the GEE cloud-based platform [10] has had an important role in monitoring Earth. Satellite data [11,12] and machine learning algorithms [13,14] are employed to predict and model every NH and CC. In recent years, precipitation has affected the water level [15], the sea surface temperature can change the amount of precipitation [16], and additionally, the sea surface pressure can be examined for indicating the water level [17]. Water level forecasting is crucial for flood prevention and disaster readiness. Over the years, there have been advancements in water level prediction models [18]. Xin et al. conducted research on the water height in Indonesia. They focused on the Indonesian Throughflow (ITF), which connects the tropical Pacific and Indian Oceans and plays a critical role in both regional and global climate systems. Through the use of a CNN model, they were able to improve the accuracy of the predictions and found that the model could validly predict ITF transport with a lead time of 7 months. This discovery suggests that deep-learning approaches using SSH data can effectively predict ITF transport [19].
2. Material and Methods
In Table 1, the missions used in this paper are indicated.

Table 1.
The following table displays the materials that were used in this paper.
This table was created to present the data used in this study.
2.1. Case Study
The Hawaiian archipelago is located in the central Pacific Ocean and is the southeast- ern part of the Hawaiian–Emperor chain (Figure 1). These islands were formed by a stationary hotspot that created volcanic islands on the Pacific plate, which moves toward the north- west [20]. The Big Island, Hawaii (21° N, 156° W), is the youngest and most southeast island in the Hawaiian archipelago. Over millions of years, the archipelago has sunk due to the weight of volcanic activity associated with this hotspot [21].
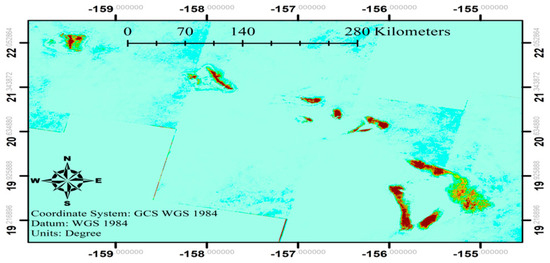
Figure 1.
Location of the study area.
2.2. Methods
The sea surface height (SSH) data obtained from Jason-2 were sourced from the Ar- chiving Validation and Interpolation of the Satellite Oceanographic Data Center (AVISO). The along-track SSH data have a spatial resolution of approximately 6–7 km, with the satellite ground track repeating every 10 days [22]. Using BRAT software 4.2.1 [23], the 36 J-2 data in 2019 were processed. Also, the SSH for a region near the Hawaiian island was extracted and showed a rising trend. We utilized the sea surface temperature (SST), sea surface moisture (SSM), and sea surface precipitation (SSP), which were created by using the GEE cloud-based platform as an input, while the target variable for prediction was the sea surface height (SSH). Inverse Distance Weighting (IDW) [24] in the ArcMap software interpolation was used to estimate the SSH values between the available data points. We employed the XGBOOST [25] and MLP [26] algorithms to model and predict the SSH. In Figure 2, you can find more information regarding the methodology of this search. Furthermore, both Figure 3 and Figure 4 illustrated the architectural of MLP and XGBOOST models.
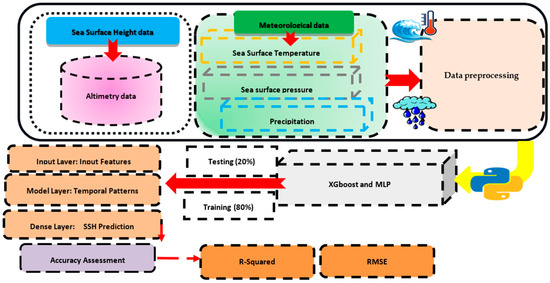
Figure 2.
The process of study.
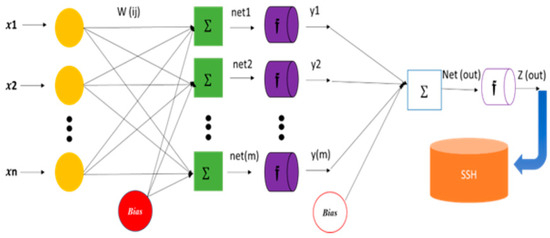
Figure 3.
The architecture of the multi-layer perceptron (MLP) model.
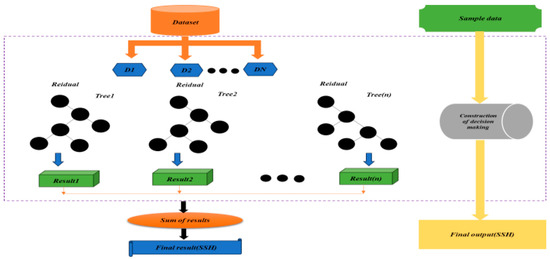
Figure 4.
The architecture of the Extreme Gradient Boosting (XGBOOST) model.
Here is the architecture of the algorithm used to emphasize its performance in this study.
3. Results
Utilizing the algorithms, a prediction map was generated. To assess the accuracy of the models, comparisons were made between the performances on the test, train, and overall datasets for both the XGBOOST and MLP algorithms. Additionally, a chart was created to visualize the water level based on the SSH (sea surface height) data points. After using XGBOOST and MLP, Figure 5 and Figure 6 show compatibility between the predicted and real data. Based on this comparison, it is clear that the model performed well.
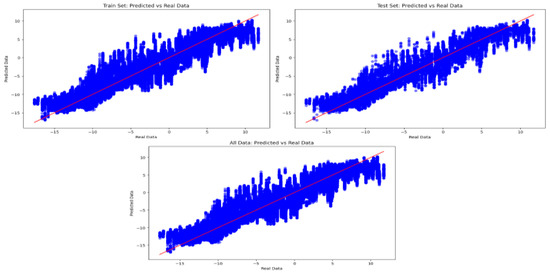
Figure 5.
Compatibility between testing and training in MLP.
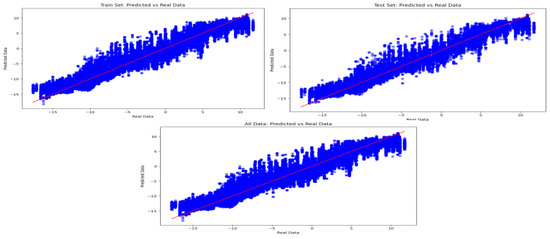
Figure 6.
Compatibility between testing and training in XGBOOST.
This chart (Figure 7) shows the amount of water raised during 36 cycles in 2019 for the mentioned case study.
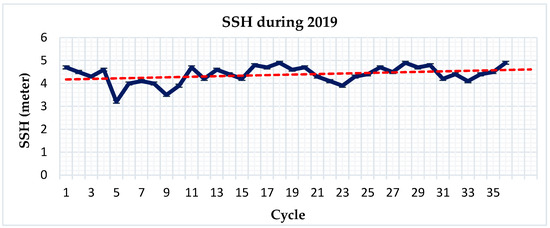
Figure 7.
The trend of SSH (Y) during 36 cycles (X).
4. Validation
In evaluating the efficacy of our models, we employed R-squared and the RMSE. R- squared offers an estimation of the correlation between the movements of a dependent variable and those of an independent variable. While it signifies potential biases in the data and predictions, it does not conclusively determine the quality of the selected model. A higher R-squared value suggests a more optimal fit, indicating a stronger correlation between the variables [27]. Additionally the Table 2 presented the accuracy assessments.

Table 2.
Validation.
Lower values indicate better fit for the model [28].
We used 36 Jason-2 datasets corrected and processed with the BRAT software. We assigned 20% for training and 80% for testing. Our goal was to see if the different algorithms could help predict future outcomes.
5. Discussion
It is unfortunate, but the impact of global warming on places like the Hawaiian Islands is significant regarding the habitants. This study used algorithms such as XGBOOST and MLP to forecast the rising sea levels (SSH) in the region. This research emphasizes the urgency of addressing climate change and indicates the important role of data in protecting coastal communities from the risk of higher sea levels. Moreover this study opted two XGBOOST and MLP algorithms due to their efficacy in decoding complex patterns within the rising sea level data. XGBOOST is particularly skilled at capturing simple relationships, while MLP, functioning as a sophisticated neural network, proves adept at handling complex connections.
6. Conclusions
Global warming has hurt the planet, causing climate change and rising sea levels. To study the sea surface height (SSH) over a period of a year, we analyzed Jason-2 radar altimetry data from 2019 in the North Pacific Ocean around the Hawaiian Islands. The findings indicate that the water levels in this area increased by approximately 20 cm in 2019. Two algorithms, Extreme Gradient Boosting and multi-layer perceptron, were employed to model and predict the SSH. The results revealed that the XGBOOST algorithm outperformed the MLP algorithms, with an R-squared value of 0.9520 compared to 0.9255. The SSH trend chart clearly showed evidence of increasing water levels near the Hawaiian Islands, where a considerable number of people live. It is crucial to monitor these areas to protect them from the threat of rising water levels.
Author Contributions
N.M.: conceptualization, methodology, software data curation, writing—original draft preparation, software, validation. K.V.K. and S.K.: visualization, investigation, writing—reviewing and editing. All authors have read and agreed to the published version of the manuscript.
Funding
This research received no external funding.
Institutional Review Board Statement
Not applicable.
Informed Consent Statement
Not applicable.
Data Availability Statement
The dataset used in this work is available based on the request.
Acknowledgments
The authors thank the reviewers for their thorough reading and helpful comments.
Conflicts of Interest
The authors declare no conflicts of interest.
References
- Lehmann, N.; Bamber, J.; Zhu, X. Global Decadal Sea Surface Height Forecast with Conformal Prediction. In Proceedings of the EGU23, the 25th EGU General Assembl, Vienna, Austria, 23–28 April 2023. [Google Scholar] [CrossRef]
- Bašić, T. Introductory Chapter: Satellite Altimetry—Overview [Internet]. In Satellite Altimetry—Theory, Applications, and Recent Advances; IntechOpen: London, UK, 2023. [Google Scholar] [CrossRef]
- Vaze, P.; Fournier, S.; Willis, J.K. Reshaping Earth: How the TOPEX and Jason satellites revolutionized oceanography and redefined climate science. In Proceedings of the 2023 IEEE Aerospace Conference, Big Sky, MT, USA, 4–11 March 2023; pp. 1–7. [Google Scholar] [CrossRef]
- Feizizadeh, B.; Lakes, T.; Omarzadeh, D.; Sharifi, A.; Blaschke, T.; Karimzadeh, S. Scenario-based analysis of the impacts of lake drying on food production in the Lake Urmia Basin of Northern Iran. Sci. Rep. 2022, 12, 6237. [Google Scholar] [CrossRef]
- Andersen, O.; Knudsen, P.; Kenyon, S.; Factor, J.; Holmes, S. Global gravity field from recent satellites (DTU15)—Arctic improvements. First Break 2017, 35, 37–40. [Google Scholar] [CrossRef]
- Vazini Ahghar, E.; Shah-Hosseini, R.; Nazari, B.; Dodangeh, P.; Mousavi, S. Assessment of drought in agricultural areas by combining meteorological data and remote sensing data. Proceedings 2023, 87, 28. [Google Scholar] [CrossRef]
- Eghrari, Z.; Delavar, M.R.; Zare, M.; Beitollahi, A.; Nazari, B. Land subsidence susceptibility mapping using machine learning algorithms. ISPRS Ann. Photogramm. Remote Sens. Spat. Inf. Sci. 2023, X-4/W1-2022, 129–136. [Google Scholar] [CrossRef]
- Eghrari, Z.; Delavar, M.; Zare, M.; Mousavi, M.; Nazari, B.; Ghaffarian, S. Groundwater level prediction using deep recurrent neural networks and uncertainty assessment. ISPRS Ann. Photogramm. Remote Sens. Spat. Inf. Sci. 2023, X-1/W1-2023, 493–500. [Google Scholar] [CrossRef]
- Ranjgar, B.; Razavi-Termeh, S.V.; Sadeghi-Niaraki, A.; Choi, S.M. Natural Hazard Susceptibility Mapping Using Ubiquitous Geospatial Artificial Intelligence (Ubiquitous GeoAI) Concept: A Case Study on Forest Fire Susceptibility Mapping. In Current Overview on Science and Technology Research; B P International: London, UK, 2022; Volume 7, pp. 100–119. [Google Scholar] [CrossRef]
- Seyed Mousavi, S.M.; Akhoondzadeh, M. A quick seasonal detection and assessment of international shadegan wetland water body extent using google earth engine cloud platform. ISPRS Ann. Photogramm. Remote Sens. Spat. Inf. Sci. 2023, X-4/W1-2022, 699–706. [Google Scholar] [CrossRef]
- Mohammadi, A.; Karimzadeh, S.; Jalal, S.J.; Kamran, K.V.; Shahabi, H.; Homayouni, S.; Al-Ansari, N. A Multi-Sensor Comparative Analysis on the Suitability of Generated DEM from Sentinel-1 SAR Interferometry Using Statistical and Hydrological Models. Sensors 2020, 20, 7214. [Google Scholar] [CrossRef]
- Kamran, K.V.; Makky, N.; Charandabi, N.K. Investigating the Flooded Area of Bangladesh by Sentinel_1 and CHIRPS Images in the GEE System; IntercontinentalGeoinformation Days (IGD): Baku, Azerbaijan, 2023; Volume 6, pp. 83–88. [Google Scholar]
- Izanlou, S.; Amerian, Y.; Seyed Mousavi, S.M. GNSS-derived precipitable water vapor modeling using machine learning methods. ISPRS Ann. Photogramm. Remote Sens. Spat. Inf. Sci. 2023, X-4/W1-2022, 307–313. [Google Scholar] [CrossRef]
- Schmitt, M.; Ahmadi, S.A.; Xu, Y.; Taşkın, G.; Verma, U.; Sica, F.; Hänsch, R. There Are No Data Like More Data: Datasets for deep learning in Earth observation. IEEE Geosci. Remote Sens. Mag. 2022, 11, 63–97. [Google Scholar] [CrossRef]
- Li, X.; Zhang, T.; Yang, D.; Wang, G.; He, Z.; Li, L. Research on lake water level and its response to watershed climate change in Qinghai Lake from 1961 to 2019. Front. Environ. Sci. 2023, 11, 1130443. [Google Scholar] [CrossRef]
- Tochimoto, E.; Iizuka, S. Impact of warm sea surface temperature over a Kuroshio large meander on extreme heavy rainfall caused by an extratropical cyclone. Atmos. Sci. Lett. 2023, 24, e1135. [Google Scholar] [CrossRef]
- Qi, Z.; Shi, Z.; Rasmussen, T.C. Time- and frequency-domain determination of aquifer hydraulic properties using water- level responses to natural perturbations: A case study of the Rongchang Well, Chongqing, southwestern China. J. Hydrol. 2023, 617, 128820, ISSN 0022-1694. [Google Scholar] [CrossRef]
- Ruma, J.; Adnan, M.D.; Dewan, A.; Rahman, R. Particle swarm optimization based LSTM networks for water level forecasting: A case study on Bangladesh river network. Results Eng. 2023, 17, 100951, ISSN 2590-1230. [Google Scholar] [CrossRef]
- Xin, L.; Hu, S.; Wang, F.; Xie, W.; Hu, D.; Dong, C. Using a deep-learning approach to infer and forecast the Indonesian Throughflow transport from sea surface height. Front. Mar. Sci. 2023, 10, 1079286. [Google Scholar] [CrossRef]
- Saller, A.; Winterbottom, C. Deep marine diagenesis, offshore Hawaii and Enewetak, with implications for older carbonates. Depos. Rec. 2023, 9, 526–572. [Google Scholar] [CrossRef]
- Moore, J.G.; Campbell, J.F. Age of tilted reefs, Hawaii. J. Geophys. Res. Solid Earth 1987, 92, 2641–2648. [Google Scholar] [CrossRef]
- Roblou, L.; Lyard, F.; Le Henaff, M.; Maraldi, C. X-track, a new processing tool for altimetry in coastal oceans. In Proceedings of the 2007 IEEE International Geoscience and Remote Sensing Symposium, Barcelona, Spain, 23–28 July 2007; pp. 5129–5133. [Google Scholar] [CrossRef]
- Dastranj, H.; Tavakoli, F.; Soltanpour, A. Investigating the Water Level and Volume Variations of Lake Urmia Using Satellite Images and Satellite Altimetry; Research Paper; Department of Surveying Engineering, Shahrood Branch, Islamic Azad University: Shahrood, Iran, 2018; pp. 149–163. [Google Scholar] [CrossRef]
- Elsahebi, M.; Hossen, H. Performance Evaluation of GIS Interpolation Techniques to Generate 3D Bed Surfaces Profiles of Lake Nubia. Aswan Univ. J. Environ. Stud. 2023, 4, 139–152. [Google Scholar] [CrossRef]
- Mo, T.; Li, S.; Li, G. An interpretable machine learning model for predicting cavity water depth and cavity length based on XGBoost–SHAP. J. Hydroinform. 2023, 25, 1488–1500. [Google Scholar] [CrossRef]
- Li, Z.; Li, C.; Guan, T.; Shang, S. Underwater Object Detection Based on Improved Transformer and Attentional Supervised Fusion. Inf. Technol. Control 2023, 52, 397–415. [Google Scholar] [CrossRef]
- Cameron, A.C.; Windmeijer, F.A. An R-squared measure of goodness of fit for some common nonlinear regression models. J. Econom. 1997, 77, 329–342. [Google Scholar] [CrossRef]
- Barnston Anthony, G.; Van den Dool, H.M. A degeneracy in cross-validated skill in regression-based forecasts. J. Clim. 1993, 6, 963–977. [Google Scholar] [CrossRef][Green Version]
Disclaimer/Publisher’s Note: The statements, opinions and data contained in all publications are solely those of the individual author(s) and contributor(s) and not of MDPI and/or the editor(s). MDPI and/or the editor(s) disclaim responsibility for any injury to people or property resulting from any ideas, methods, instructions or products referred to in the content. |
© 2024 by the authors. Licensee MDPI, Basel, Switzerland. This article is an open access article distributed under the terms and conditions of the Creative Commons Attribution (CC BY) license (https://creativecommons.org/licenses/by/4.0/).