Next Article in Journal
Enhancing Corn Yield Prediction in Iowa: A Concatenate-Based 2D-CNN-BILSTM Model with Integration of Sentinel-1/2 and SoilGRIDs Data
Previous Article in Journal
Normalized Burn Ratio and Land Surface Temperature Pre- and Post-Mediterranean Forest Fires
 
 
Please note that, as of 4 December 2024, Environmental Sciences Proceedings has been renamed to Environmental and Earth Sciences Proceedings and is now published here.
Proceeding Paper

An Integrated Modeling Framework to Estimate Time Series of Evapotranspiration on a Regional Scale Using MODIS Data and a Two-Source Energy Balance Model †

by
Mahsa Bozorgi
1,2 and
Jordi Cristóbal
1,2,*
1
Efficient Use of Water in Agriculture Program, Institute of Agrifood Research and Technology, Fruitcentre, Parc Científic i Tecnològic Agroalimentari de Lleida 23, 25003 Lleida, Spain
2
Department of Geography, Autonomous University of Barcelona, 08193 Bellaterra, Spain
*
Author to whom correspondence should be addressed.
Presented at the 5th International Electronic Conference on Remote Sensing, 7–21 November 2023; Available online: https://ecrs2023.sciforum.net/.
Environ. Sci. Proc. 2024, 29(1), 5; https://doi.org/10.3390/ECRS2023-15845
Published: 1 December 2023
(This article belongs to the Proceedings of ECRS 2023)

Abstract

:
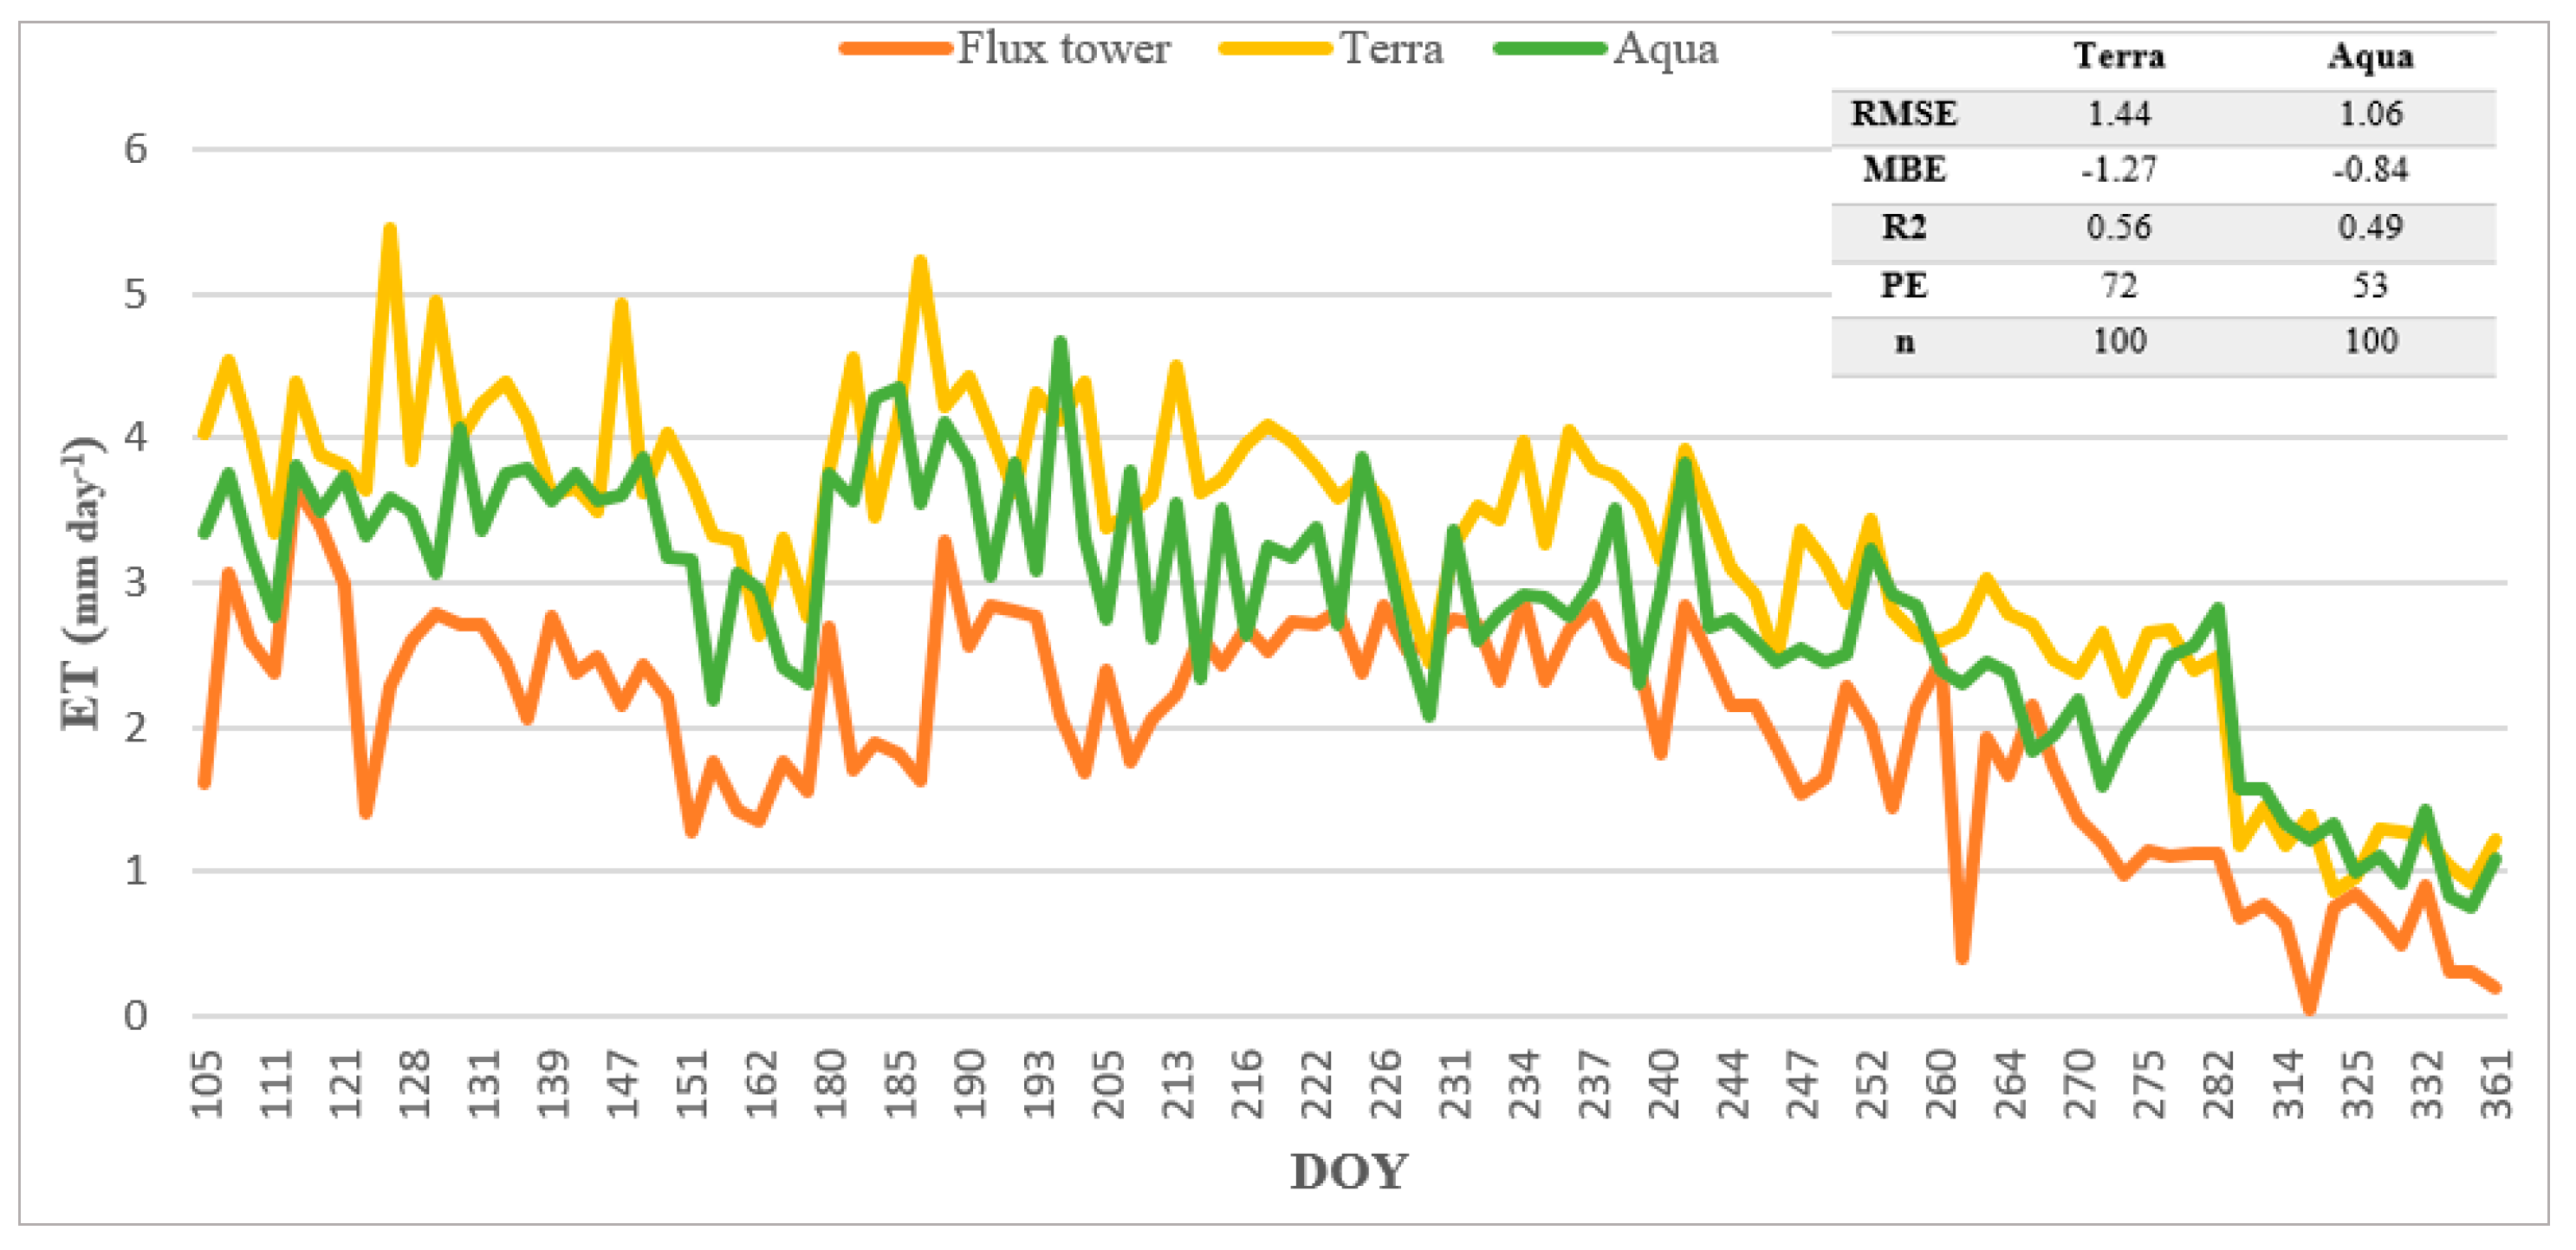
Satellite remote sensing has become an important tool for monitoring and evaluating the impacts of drought. In this study, a modeling framework aimed at estimating the time series of evapotranspiration (ET), a key variable for drought monitoring, at a regional scale is presented. A two-source energy balance (TSEB) model was used concurrently with Terra/Aqua MODIS data and the ERA5 atmospheric reanalysis dataset. The modeling framework is based on the SEN-ET scheme to calculate the surface energy balance of the soil-canopy-atmosphere continuum and estimate ET at 1 km spatial resolution. The model was applied for the whole Iberian Peninsula, and it was evaluated with a pistachio orchard flux tower data in Lleida (NE Iberian Peninsula). Preliminary daily ET evaluation results for the Terra dataset showed an RMSE, MBE, and R2 of around 1.43 W·m−2, −1.27 W·m−2, and 0.56, respectively, and for the Aqua dataset were 1.05 W·m−2, −0.84 W·m−2 and 0.48, respectively within 100 days in 2022. Ongoing evaluation is being carried out on two forested watersheds as well as mountain meadows and semi-arid vegetation flux towers.

1. Introduction

Drought is a devastating, recurring, and globally natural hazard that causes extreme damage to natural ecosystems, agriculture, economy, society, and health [1]. Drought is characterized as a creeping phenomenon, gradually emerging over time. This gradual manifestation makes drought prediction onsets and ends difficult and challenging [2]. However, drought impacts are apparent in vegetation greenness and crop water requirements over time [3].
Evapotranspiration (ET) is a key variable of the hydrologic cycle that leads to water loss from the processes of transpiration and evaporation through plant canopy and soil, respectively [4]. ET plays a critical role in the climate system as a nexus of the water, energy, and carbon cycles and sequentially affects plant growth and yield [5,6]. Accurate evaluation of ET is critical for estimating crop water requirements, planning irrigation, enhancing efficient use of water resources, and monitoring and predicting drought [7,8]. Mediterranean areas, characterized by water-limited crop production, face accelerant climate change impacts associated with increasing extreme temperatures and decreasing precipitation [9]. The Iberian Peninsula is among the most vulnerable areas of southern Europe due to its Mediterranean climate and agricultural predominance [10]. Thus, ET estimates can be an indicator for monitoring agricultural drought and assessing water use efficiency in these areas. Quantitative ET methods can be classified into ground observations and model-based estimation. Calculating ET with ground observation methods on regional scales is difficult due to spatial heterogeneity [11]. Thermal-based surface energy balance models are widely used to estimate ET through reflected and emitted energy from the sun to the land surface [12]. Surface energy balance models can be categorized as single-source and dual-source models. Single-source models assume the land surface as a single system, but dual-source models differentiate soil and vegetation energy fluxes separately [13]. The two-source energy balance (TSEB) model is a dual-source model that shows better performance on vegetation-soilmixed surfaces [11,12].
Remote sensing data have revolutionized water resource management studies as they address the limitations of ground observations by providing parameters at different spatiotemporal resolutions. Remote sensing data have been widely used as input data to estimate ET through surface energy balance models by providing numerous key parameters such as land surface temperature, surface albedo, emissivity, and vegetation indices. Thus, the integration of remote sensing data and thermal-based surface energy models enhances our ability to understand and manage water resources effectively.
The moderate resolution imaging spectroradiometer (MODIS) onboard the Terra and Aqua satellites is a critical instrument used in Earth observation and global-change research that provides essential environmental parameters, including land surface temperature, ocean color, vegetation cover, and atmospheric conditions. With a freely available long-term dataset spanning more than 22 years for researchers and scientists worldwide, MODIS plays a crucial role in monitoring climate change, ecosystem dynamics, and natural disasters. MODIS cloud contamination and other gaps can lead to missing data and reducing data quality. However, MODIS quality assessment (QA) data with gap-filling algorithms can be applied to maximize the high-quality data effects and reduce and replace poor quality and missing data.
The present study aims (1) to calculate smoothed and gap-filled MODIS biophysical products as input for ET estimation; (2) to estimate the daily time series of remote sensing-based ET using an integrated modeling framework on a regional scale with Terra/Aqua MODIS images, the ERA5 atmospheric reanalysis dataset, and the TSEB model; and (3) to evaluate the model performance over heterogeneous surfaces in the Mediterranean region.

2. Materials and Methods

2.1. Study Area

The Iberian Peninsula, located in southwestern Europe, is recognized as a climate change “hotspot” within the Mediterranean region and it was selected for the model application. As an ongoing model evaluation, the pistachio orchard flux tower (NE Iberian Peninsula) was selected to evaluate the performance of the TSEB model (Figure 1).

2.2. Brief Overview of the ET Modeling Framework

The model framework based on the SEN-ET was used, with some modifications for the study areas, to estimate ET on a regional scale (model description can be found at https://www.esa-sen4et.org/ accessed on 19 March 2023). The processing flow for estimating energy heat flux using MODIS data and the TSEB model modifications are shown in Figure 2.

2.3. Remote Sensing and Meteorological TSEB Input Variables

Both optical and thermal data were extracted from Terra/Aqua MODIS sensors. Also, meteorological data including air temperature, atmospheric vapor pressure, wind speed above the canopy, atmospheric pressure, and total column water vapor were extracted from the ERA5 reanalysis dataset. Instantaneous and daily incoming shortwave radiation were computed using a DEM [14], water vapor, and aerosols from MODIS’ combined AOD product (MCD19A2). Sun zenith angle was computed using the acquisition time in the LST MODIS product.

2.4. Time Series of Vegetation Properties and Biophysical Data

TIMESAT was used to both temporally smooth and spatially complete biophysical variables. This process transformed noisy signals (due to clouds and other atmospheric and image acquisition artifacts) of remotely sensed vegetation indices including LAI, NDVI, and FPAR into smooth seasonal curves by using MODIS QA data, providing a weighting mechanism to reduce the influence of clouds and atmospheric noise on satellite data. TIMESAT has three different smoothing functions to fit the time series data: double logistic, asymmetric Gaussian, and Savitzky–Golay filtering [15].

3. Results

Time series of LAI, NDVI, and FPAR data were analyzed by TIMESAT (Figure 3). High weights were assigned for higher quality retrievals and low weights for lower quality retrievals; also, the double logistic smoothing method was selected since it showed a better fit to the data. After the initial fit from TIMESAT, it failed to fit a curve to the time series of LAI and FPAR products; therefore, a second run of TIMESAT was applied to LAI and FPAR time series data, as Gao et al. suggested [16].
TSEB evaluation for 2022 yielded an RMSE, MBE, proportion of error (PE), and R2 of around 1.43 W·m−2, −1.27 W·m−2, and 0.56, respectively, for the Terra dataset and 1.05 W·m−2, −0.84 W·m−2 and 0.48, respectively, for the Aqua dataset, in 100 days when compared with daily ET measured by the pistachio flux tower Preliminary daily ET evaluation results for the Terra dataset showed an RMSE, MBE, and R2 of around 1.43 W·m−2, −1.27 W·m−2, and 0.56, respectively, and for the Aqua dataset were 1.05 W·m−2, −0.84 W·m−2 and 0.48, respectively within 100 days in 2022. (Figure 4 and Figure 5).

4. Discussion

In this study, TIMESAT software was applied to smooth and fill the gaps in MODIS time series data. The result showed that TIMESAT failed to fit a curve into LAI and FPAR time series products after the initial process since there were many gaps or low-quality data. Therefore, a second TIMESAT process was applied to LAI and FPAR images. The results showed that the algorithm successfully smoothed and fitted data temporally and spatially. A two-source energy balance model based on the SEN-ET modeling framework was successfully applied using Terra/Aqua MODIS data and the ERA5 atmospheric reanalysis dataset. The results showed that ET overestimated by the TSEB model, however, remote sensing-based ET agreed well with the flux tower observations, capturing temporal dynamics of daily ET over the study period. Hence, the modeling framework can be applied both regionally and temporally to estimate spatiotemporal ET dynamics.

5. Conclusions

Drought is a complex environmental phenomenon with dynamic impacts that manifest over time. Hence, to comprehensively understand its effects, it is essential to monitor it using time series data of ET. In this study, an optimized modeling framework to estimate a long time series of daily ET on a regional scale in the Iberian Peninsula was presented. The modeling framework is based on the SEN-ET scheme and synergistically uses Terra/Aqua MODIS data and the ERA5 atmospheric reanalysis dataset to estimate ET at 1 km spatial resolution. Model evaluation with the pistachio orchard flux tower data in Lleida (NE Iberian Peninsula) showed good performance of the modeling framework. The proposed modeling framework provided a pathway to construct a daily time series of remote sensing-based ET maps. Ongoing modeling framework evaluation is also being carried out on two forested watersheds as well as mountain meadows and semi-arid vegetation flux towers.

Author Contributions

Conceptualization, M.B.; methodology, M.B. and J.C.; programming, M.B. and J.C.; validation, all; format analysis, all; writing, M.B. and J.C.; supervision, J.C. All authors have read and agreed to the published version of the manuscript.

Funding

Funds for M.B. and J.C. to conduct this research came from the project “Enhanced remote sensing ET estimates for agricultural drought monitoring through improvements in ET partitioning and heterogeneous crop biophysical parameters retrieval” [PID2021-127345OR-C31] and “Evaluation of the digital twin paradigm applied to precision irrigation (DigiSPAC)” [TED2021- 131237B-C21] funded by the Spanish Ministry of Science and Innovation.

Data Availability Statement

Terra and Aqua datasets were provided by USGS and downloaded through Google Earth Engine. The reanalysis meteorological dataset were provided by Copernicus at https://cds.climate.copernicus.eu/cdsapp#!/home, accessed on 22 January 2023).

Conflicts of Interest

The authors declare no conflicts of interest.

References

  1. Mehdipour, S.; Nakhaee, N.; Khankeh, H.; Haghdoost, A.A. Impacts of Drought on Health: A Qualitative Case Study from Iran. Int. J. Disaster Risk Reduct. 2022, 76, 103007. [Google Scholar] [CrossRef]
  2. Wilhite, D.A.; Glantz, M.H. Understanding: The Drought Phenomenon: The Role of Definitions. Water Int. 1985, 10, 111–120. [Google Scholar] [CrossRef]
  3. Ha, T.V.; Uereyen, S.; Kuenzer, C. Agricultural Drought Conditions over Mainland Southeast Asia: Spatiotemporal Characteristics Revealed from MODIS-Based Vegetation Time-Series. Int. J. Appl. Earth Obs. Geoinf. 2023, 121, 103378. [Google Scholar] [CrossRef]
  4. Wilm, H.G.; Thornthwaite, C.W.; Colman, E.A.; Cummings, N.W.; Croft, A.R.; Gisborne, H.T.; Harding, S.T.; Hendrickson, A.H.; Houk, I.E.; Kittredge, J.; et al. Report of the Committee on Transpiration and Evaporation, 1942–1943. Eos Trans. Am. Geophys. Union 1943, 24, 401–403. [Google Scholar] [CrossRef]
  5. Wang, K.; Dickinson, R.E. A Review of Global Terrestrial Evapotranspiration: Observation, Modeling, Climatology, and Climatic Variability. Rev. Geophys. 2012, 50. [Google Scholar] [CrossRef]
  6. Jung, M.; Reichstein, M.; Ciais, P.; Seneviratne, S.I.; Sheffield, J.; Goulden, M.L.; Bonan, G.; Cescatti, A.; Chen, J.; de Jeu, R.; et al. Recent Decline in the Global Land Evapotranspiration Trend Due to Limited Moisture Supply. Nature 2010, 467, 951–954. [Google Scholar] [CrossRef] [PubMed]
  7. Irmak, S. Evapotranspiration. In Encyclopedia of Ecology; Jørgensen, S.E., Fath, B.D., Eds.; Academic Press: Oxford, UK, 2008; pp. 1432–1438. ISBN 978-0-08-045405-4. [Google Scholar]
  8. Babaeian, E.; Tuller, M. Proximal Sensing of Evapotranspiration. In Encyclopedia of Soils in the Environment, 2nd ed.; Goss, M.J., Oliver, M., Eds.; Academic Press: Oxford, UK, 2023; pp. 610–617. ISBN 978-0-323-95133-3. [Google Scholar]
  9. Noto, L.V.; Cipolla, G.; Pumo, D.; Francipane, A. Climate Change in the Mediterranean Basin (Part II): A Review of Challenges and Uncertainties in Climate Change Modeling and Impact Analyses. Water Resour. Manag. 2023, 37, 2307–2323. [Google Scholar] [CrossRef]
  10. Almendra-Martín, L.; Martínez-Fernández, J.; González-Zamora, Á.; Benito-Verdugo, P.; Herrero-Jiménez, C.M. Agricultural Drought Trends on the Iberian Peninsula: An Analysis Using Modeled and Reanalysis Soil Moisture Products. Atmosphere 2021, 12, 236. [Google Scholar] [CrossRef]
  11. Feng, J.; Wang, W.; Che, T.; Xu, F. Performance of the Improved Two-Source Energy Balance Model for Estimating Evapotranspiration over the Heterogeneous Surface. Agric. Water Manag. 2023, 278, 108159. [Google Scholar] [CrossRef]
  12. Song, L.; Kustas, W.P.; Liu, S.; Colaizzi, P.D.; Nieto, H.; Xu, Z.; Ma, Y.; Li, M.; Xu, T.; Agam, N.; et al. Applications of a Thermal-Based Two-Source Energy Balance Model Using Priestley-Taylor Approach for Surface Temperature Partitioning under Advective Conditions. J. Hydrol. 2016, 540, 574–587. [Google Scholar] [CrossRef]
  13. Kustas, W.P.; Norman, J.M. Evaluation of Soil and Vegetation Heat Flux Predictions Using a Simple Two-Source Model with Radiometric Temperatures for Partial Canopy Cover. Agric. For. Meteorol. 1999, 94, 13–29. [Google Scholar] [CrossRef]
  14. Aguilar, C.; Herrero, J.; Polo, M.J. Topographic Effects on Solar Radiation Distribution in Mountainous Watersheds and Their Influence on Reference Evapotranspiration Estimates at Watershed Scale. Hydrol. Earth Syst. Sci. 2010, 14, 2479–2494. [Google Scholar] [CrossRef]
  15. Eklundh, L.; Jönsson, P. TIMESAT 3.3 with Seasonal Trend Decomposition and Parallel Processing Software Manual; Lund and Malmo University: Lund, Sweden, 2017. [Google Scholar]
  16. Gao, F.; Morisette, J.T.; Wolfe, R.E.; Ederer, G.; Pedelty, J.; Masuoka, E.; Myneni, R.; Tan, B.; Nightingale, J. An Algorithm to Produce Temporally and Spatially Continuous MODIS-LAI Time Series. IEEE Geosci. Remote Sens. Lett. 2008, 5, 60–64. [Google Scholar] [CrossRef]
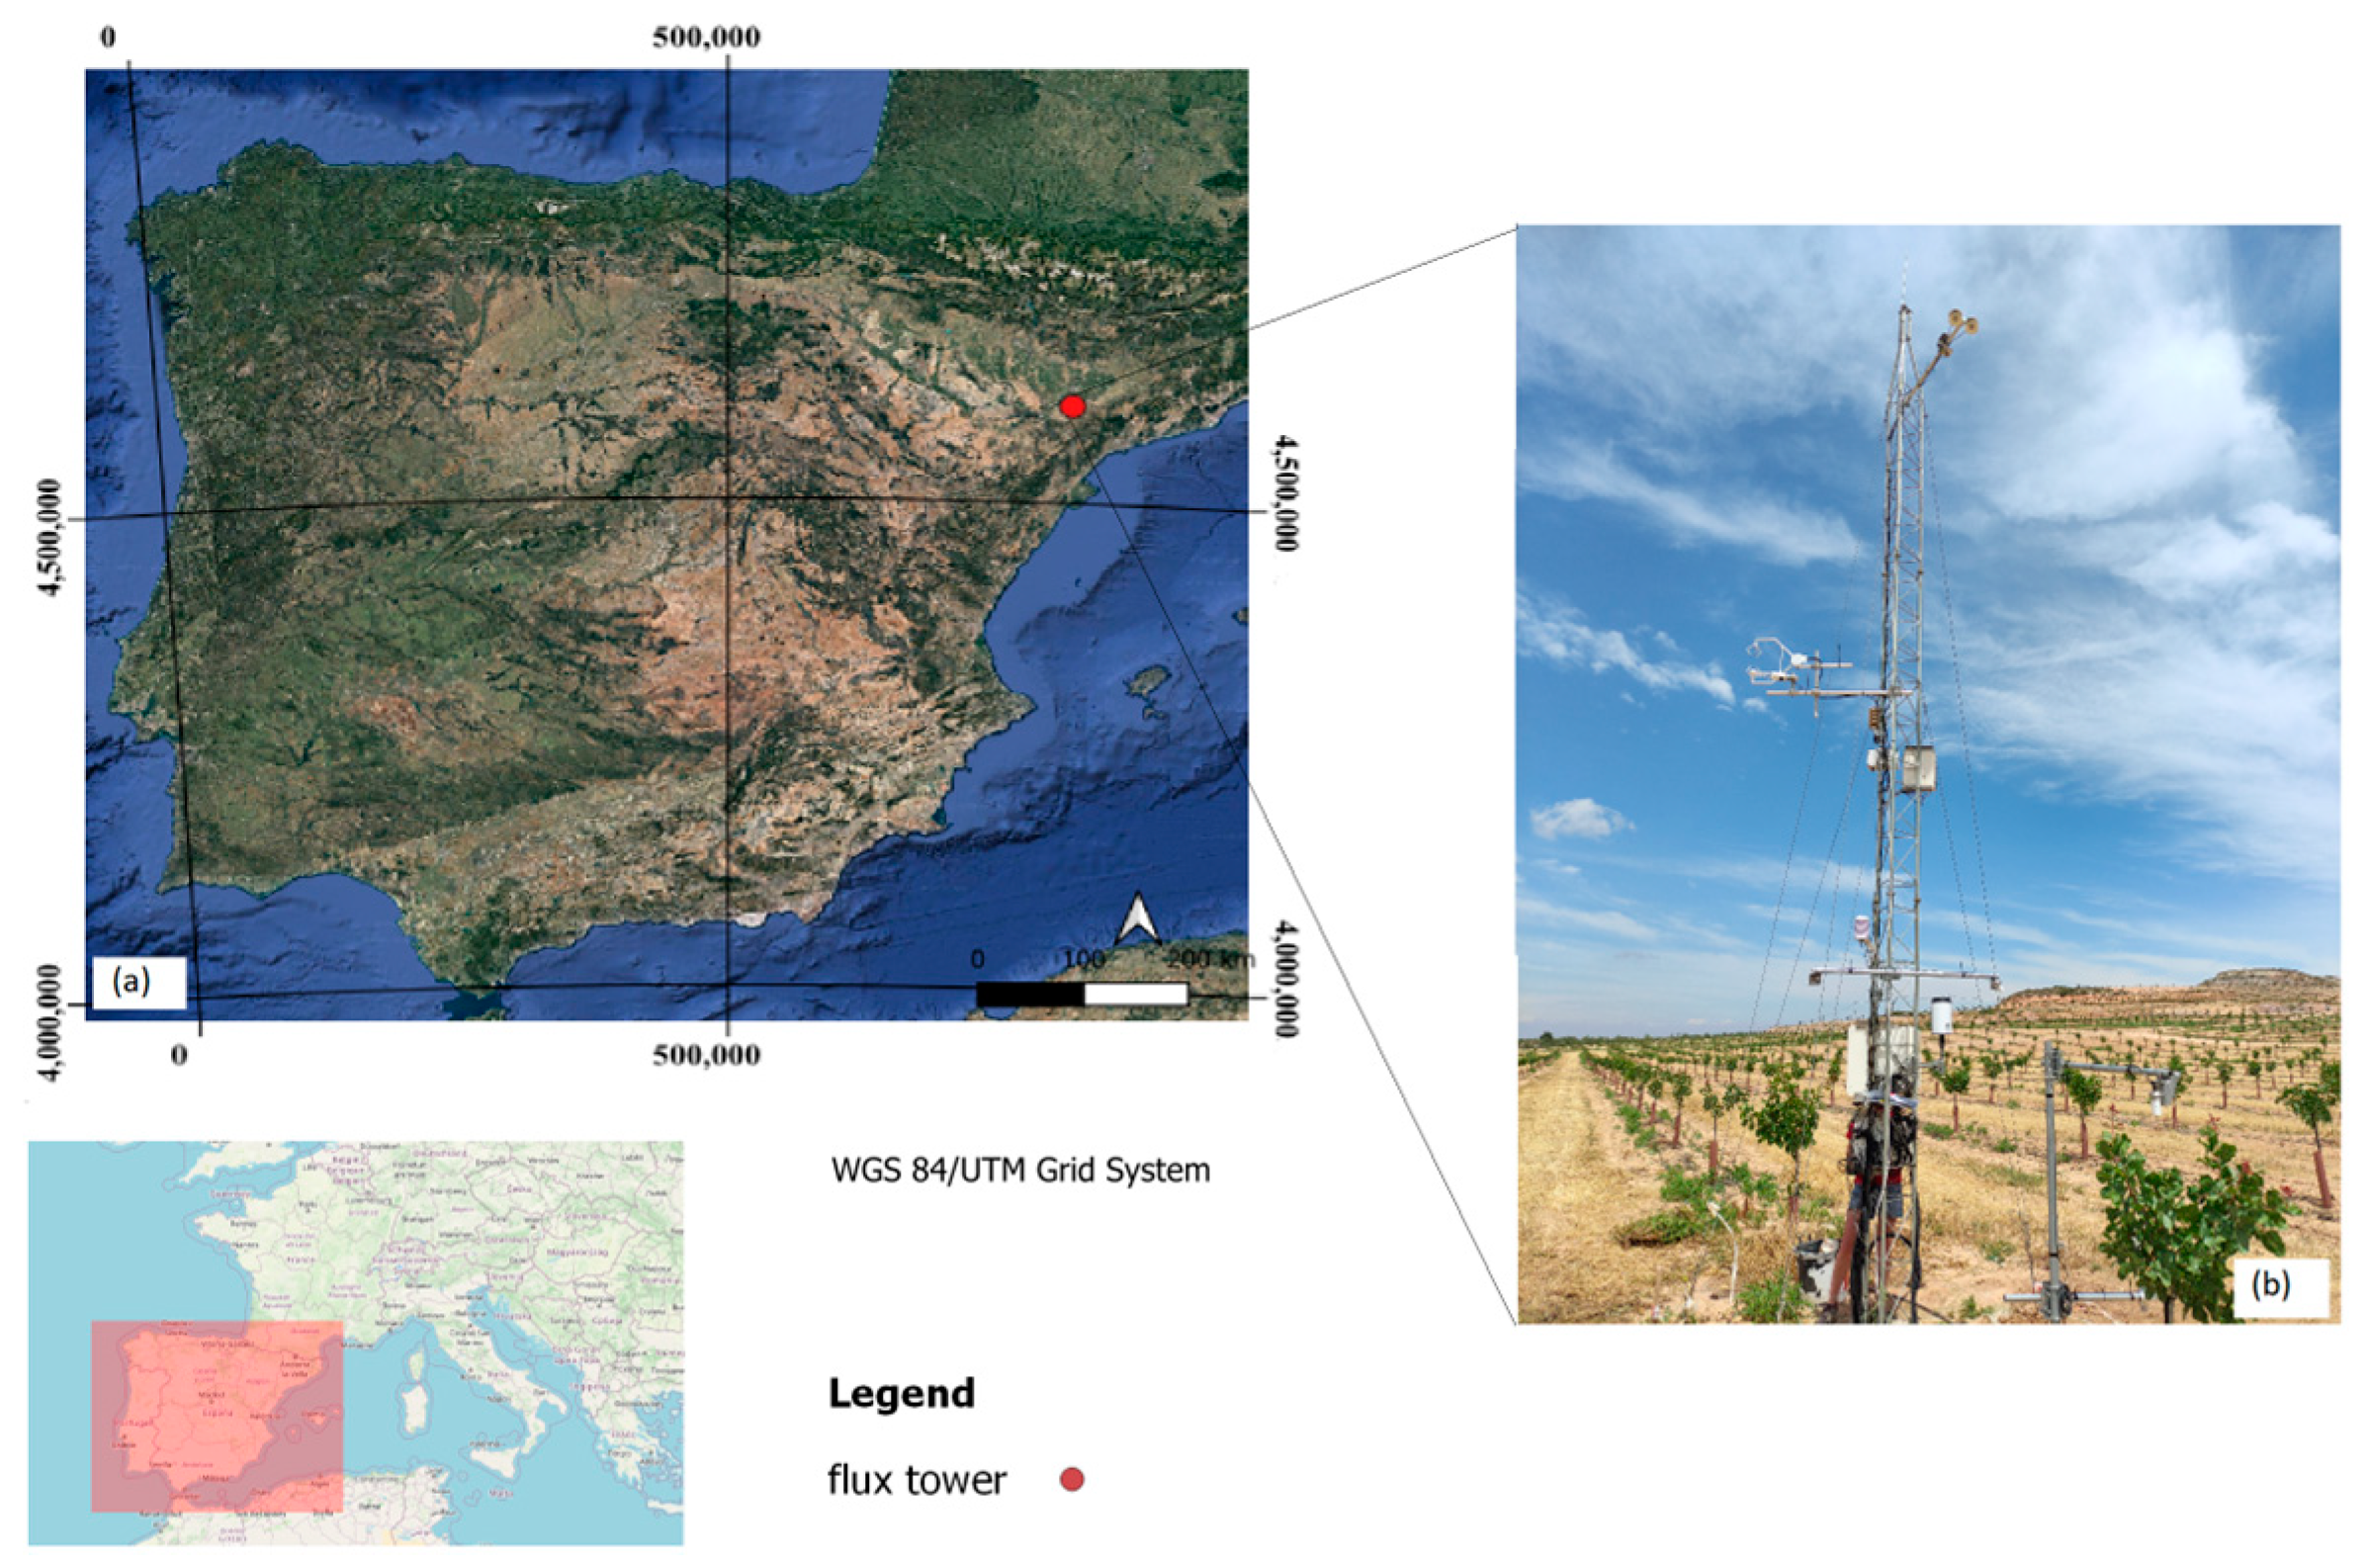
Figure 1. (a) Study area with the location of the eddy covariance tower; (b) general view of the pistachio orchard flux tower. Coordinates in UTM-30N WGS84.
Environsciproc 29 00005 g001
Figure 2. Processing flow diagram for surface energy flux estimation on instantaneous and daily scales. Blue indicates model modifications for MODIS data.
Environsciproc 29 00005 g002
Figure 3. LAI observations from 2002 to 2022 for a sample point (latitude: 39°35.81′ N, longitude: 2°24.63′ E).
Environsciproc 29 00005 g003
Figure 4. Comparison of daily ET from the TSEB model and the flux tower for 2022. RMSE, MBE in W·m−2 and PE in %.
Environsciproc 29 00005 g004
Figure 5. Daily ET estimation using the modeling framework for DOY 206-2022.
Environsciproc 29 00005 g005
Disclaimer/Publisher’s Note: The statements, opinions and data contained in all publications are solely those of the individual author(s) and contributor(s) and not of MDPI and/or the editor(s). MDPI and/or the editor(s) disclaim responsibility for any injury to people or property resulting from any ideas, methods, instructions or products referred to in the content.