Next Article in Journal
Drone-Based Spatio-Temporal Assessment of a Seagras Meadow: Insights into Anthropogenic Pressure
Previous Article in Journal
Towards Modeling of the Landscape Evolution of Los Naranjos Archaeological Site, Honduras
 
 
Please note that, as of 4 December 2024, Environmental Sciences Proceedings has been renamed to Environmental and Earth Sciences Proceedings and is now published here.
Proceeding Paper

Time Series Analysis of Sea Ice Production in Polynyas in the Amery Ice Shelf in Antarctica †

College of Surveying and Geo-Informatics, Tongji University, Shanghai 200092, China
Presented at the 5th International Electronic Conference on Remote Sensing, 7–21 November 2023; Available online: https://ecrs2023.sciforum.net/.
Environ. Sci. Proc. 2024, 29(1), 42; https://doi.org/10.3390/ECRS2023-16368
Published: 28 November 2023
(This article belongs to the Proceedings of ECRS 2023)

Abstract

:
The Amery Ice Shelf is a major source of sea ice, whose production is linked to the global climate. In 2019, a collapse event occurred in the Amery Ice Shelf; sea ice production before and during this collapse needs to be studied. In this study, polynyas in the Amery Ice Shelf were identified according to ice thickness, and sea ice production was obtained by calculating the heat flux during winter (March–October) in 2013–2020. It was found that the sea ice production in the polynyas fluctuated greatly, and the maximum annual ice production occurred in 2018, which reached 225.4 km3. As for the collapse event in 2019, it is assumed that it may have exacerbated the volatility and instability of sea ice production.

1. Introduction

Antarctic coastal polynyas are open-water or thin-ice regions formed by a divergent ice motion because of offshore winds or oceanic currents; they usually appear regularly in the same locations in winter [1]. Due to the poor heat insulation of thin ice in winter, intensive heat loss in the atmosphere occurs in Antarctic coastal polynya areas and leads to the formation of sea ice [2]. Antarctic coastal polynyas are important producers of sea ice, and about 10% of sea ice in the Southern Ocean is produced from Antarctic coastal polynyas [3]. When a large amount of sea ice is produced in the Antarctic coastal polynyas, salt, originally in the seawater that later froze into sea ice, precipitates and then dissolves in the surrounding seawater to form a very dense brine, which is a major source of the world’s densest water whose name is Antarctic bottom water (AABW) [4,5]. Therefore, studying the variability of the time series of sea ice production (SIP) in Antarctic coastal polynyas helps to better estimate the associated AABW production. Recent studies found that polynyas in the Amery Ice Shelf, which is located on the East Antarctic coast, are major areas of SIP and AABW production in the Antarctica [6,7]. In addition, between 20 and 25 September 2019, the Amery Ice Shelf collapsed, which caused the disintegration of an area of 1636 km2, which is roughly twice the size of New York City. As a result of the collapse, the large iceberg D28 broke away from the Antarctic continent and slid into the ocean. There is a great need to study SIP in the Amery Ice Shelf during the collapse event and in the years preceding it.
For SIP calculation, the most widely used method is based on the heat flux. Assuming that all heat flux from the surface of a polynya is used for ice production, the heat loss from the surface of the polynya is calculated based on a reanalysis of the meteorological data, and SIP can subsequently be calculated from the heat loss as a function of the ice production. In order to implement the heat flux-based calculation of SIP from polynyas, two key steps are required: polynya extraction and heat loss calculation. As for polynya extraction, passive microwave radiometer is widely used to retrieve sea ice thickness (SIT), and then polynyas are extracted according to the threshold of SIT [6,8,9]. Regarding heat loss calculations, it was found that heat loss has four components, i.e., shortwave radiative heat flux, net longwave radiative heat flux, latent heat flux and sensible heat flux [3,6]. Methods for calculating these heat fluxes in the Antarctic coastal sea ice and open-water regions were summarized [10].
In this paper, the time-series variation of SIP in polynyas in the Amery Ice Shelf from 2013 to 2020 was analyzed, considering the impact of the ice shelf collapse event on SIP.

2. Methods

2.1. Extraction of Polynya Areas

The key to the extraction of a polynya extent is retrieving SIT. Thin ice (SIT ≤ 0.2 m), thick ice and seawater have large differences in passive microwave brightness temperatures (TBs) due to differences in their physical properties (e.g., surface salinity, surface temperature, dielectric properties) [11,12]. In this paper, Advanced Microwave Scanning Radiometer 2 (AMSR2) Level3 monthly TB data with grid size of 10 km × 10 km, provided by the Japan Aerospace Exploration Agency (JAXA), were used for retrieving SIT. TBs at 36.5 GHz and 89 GHz were used because they can provide information about the salinity of sea ice surface, which is highly correlated with the SIT of thin ice. It was found that there was a negative correlation between the polarization ratio (PR) of TBs and the SIT of thin ice [6,8]. The PR can be calculated by Equation (1). Based on this relationship, the SIT of thin ice can be calculated with Equations (2) and (3) [8]
PR = (TBs(V) − TBs(H))/(TBs(V) + TBs(H))
h(89) = exp (1/(104 PR(89) − 0.07)) − 1.07
h(36) = exp (1/(72 PR(36))) − 1.08
where PR(89) and PR(36) represent the PR at 89 GHz and 36.5 GHz, respectively, and H and V represent horizontal polarization and vertical polarization, respectively. If PR(89) ≥ 0.062 for a particular pixel, the corresponding SIT is considered to be 0–0.1 m and is calculated using Equation (2). If PR(36) of a certain pixel satisfies the relation 0.057 < PR(36) ≤ 0.083, the SIT of the pixel is regarded as 0.1–0.2 m and is calculated using Equation (3). Sea ice with SIT less than 0.2 m is identified as polynya.
After identifying polynyas, fast ice needs to be extracted, as fast ice and thin ice in polynyas have similar physical properties, and fast ice is often misclassified as polynya [6]. In this paper, gridded weakly data of Antarctic fast ice extent from 2013 to 2020, with a grid size of 10 km × 10 km, provided by the National Snow and Ice Data Center (NSIDC), were used.

2.2. Calculation of Sea Ice Production

It is assumed that all the heat lost from a polynya into the atmosphere is used for sea water freezing [8]. The key to calculating SIP is to calculate the heat loss Q, including shortwave radiative heat flux S, net longwave radiative heat flux L, latent heat flux Fe and sensible heat flux Fs
Q = S + L + Fs + Fe
The four types of heat flux can be obtained from the fifth-generation atmospheric reanalysis of the global climate (ERA5) data released by the European Center for Medium-Range Weather Forecasts (ECMWF) [13].
SIP can then be calculated pixel by pixel according to the following equation:
SIP = Q/(ρi Lf)
where ρi is the sea ice density, which is considered to be 920 kg·m−3, Lf is the latent heat of melting of sea ice, and Lf is considered to be 0.334 MJ·kg−1 according to a previous study [8].
Using the above procedure, the SIP for each pixel in the corresponding period could be obtained, and its spatial accumulation was used to obtain the total SIP in the polynya.

3. Results and Discussion

Two polynyas in the Amery Ice Shelf were identified: the Cape Darnley polynya (CDP) and the Mackenzie Bay polynya (MBP). Subsequently, the area and SIP of the CDP and the MBP were calculated separately, and the time series of the polynyas’ areas and SIP were analyzed.

3.1. Analysis of Polynya Areas

3.1.1. Accuracy Assessment of Polynya Areas

In order to verify the accuracy of polynya identification, the polynyas’ extension was extracted by means of multiscale segmentation from high-resolution Sentinel-1 images and was used as a reference for comparison. Taking the data from 20 September 2015 as an example, the extent of the polynyas extracted based on Sentinel-1 images and AMSR2 images is shown in Figure 1. The two high-backscatter areas marked by the red line in Figure 1a correspond to the studied polynyas; the larger polynya extending in the northern part of the imaged area is the CDP, and the other is the MBP. The low-backscatter areas in the middle of the two polynyas and along the shoreline on the western side of the CDP correspond to fast ice. A comparison of the two figures showed that the locations and ranges of the polynyas detected by the two data sources were basically consistent. Then, a quantitative comparison determined that AMSR2 detected the polynyas with a certain degree of accuracy, as shown in Table 1.

3.1.2. Time Series Analysis of Polynya Areas

The annual mean polynya area was calculated by averaging monthly data, and then the interannual change in the annual mean polynya area from 2013 to 2020 was analyzed. The corresponding graph is shown in Figure 2.
Overall, the trends showed that both polynya areas tended to decrease, with small fluctuations, and that the CDP and MBP variations were relatively consistent over the 2013–2020 period, with the exception of the 2014–2015 period, when the CDP extension tended to decrease, whereas the MBP extension showed the opposite trend. All other years showed relatively consistent increasing and decreasing trends. Both CDP and MBP showed large fluctuations. The year with the largest annual mean area of the CDP was 2018, with an annual mean area of 13,588 km2, while the smallest annual mean area of the CDP was detected in 2019 and was about 9850 km2; the year with the largest annual mean area of the MBP was 2016, with an area of 8150 km2, while the smallest annual mean area of the MBP was reported in 2017 and was about 4075 km2.

3.2. Analysis of Sea Ice Production in the Polynyas

3.2.1. Accuracy Assessment of Sea Ice Production in the Polynyas

The key to the calculation of SIP is the extraction of the polynya area. For the calculation of heat loss, efficient products are available (such as ERA5, etc.); so, the error in the calculation of SIP in this paper is mainly related to the extraction of the polynya areas. According to the comparison of the SAR images in Figure 1, the identification of the polynyas based on AMSR2 data in this paper had a certain accuracy. In addition, the ERA5 reanalysis of the meteorological data used in this paper was also relatively reliable; so, the calculation of SIP in this paper has a certain accuracy.

3.2.2. Spatial Distribution of SIP in the Polynyas

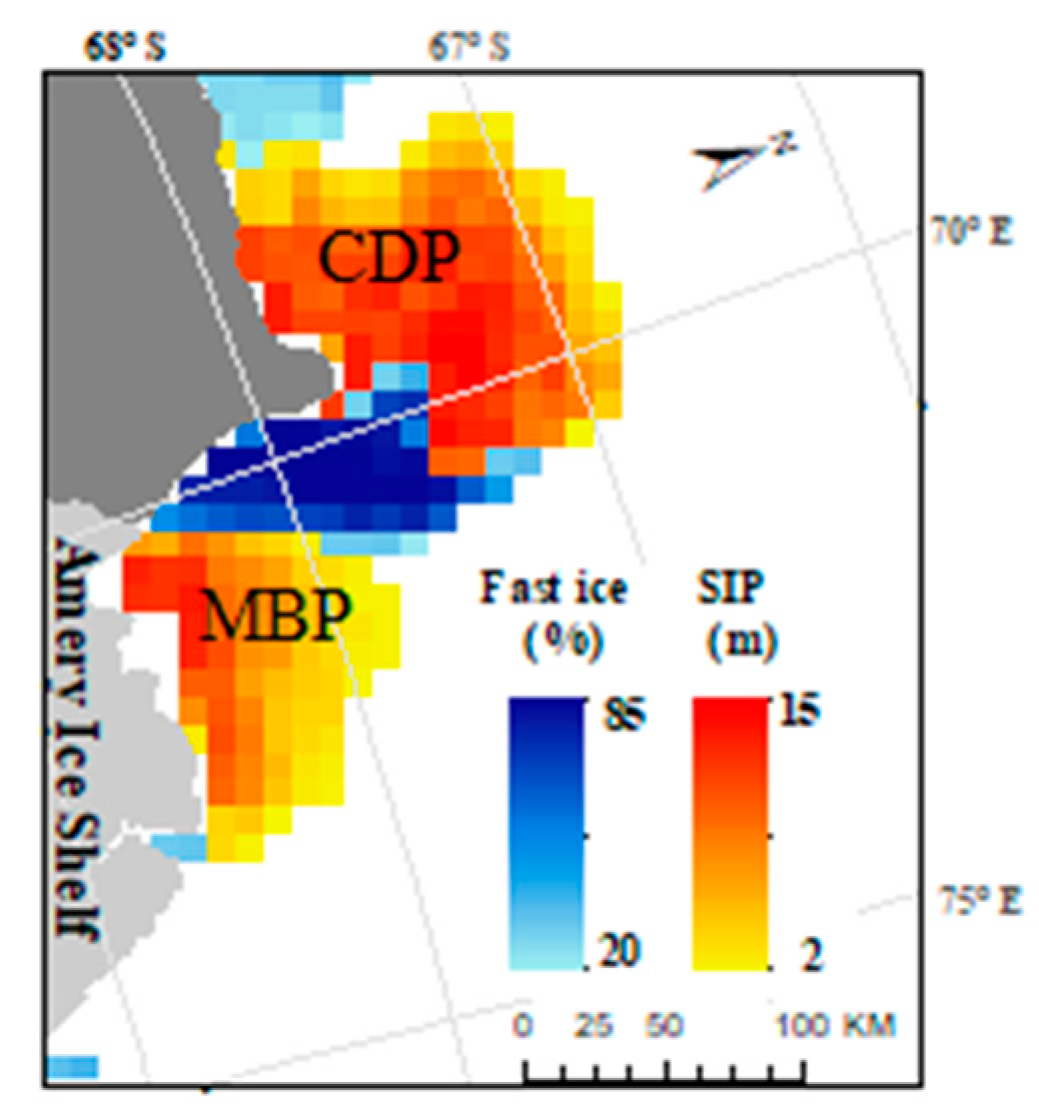
The annual mean SIP in the Amery Ice Shelf was calculated, and the spatial distribution of SIP was mapped, as shown in Figure 3. In the CDP region, SIP was higher in the area near the eastern fast ice and shelf and in the central area, while it was lower in the relatively outlying areas to the west and north. In the MBP region, SIP was higher in areas close to the Amery Ice Shelf and lower in areas to the north and east.

3.2.3. Time Series Analysis of Sea Ice Production in the Polynyas

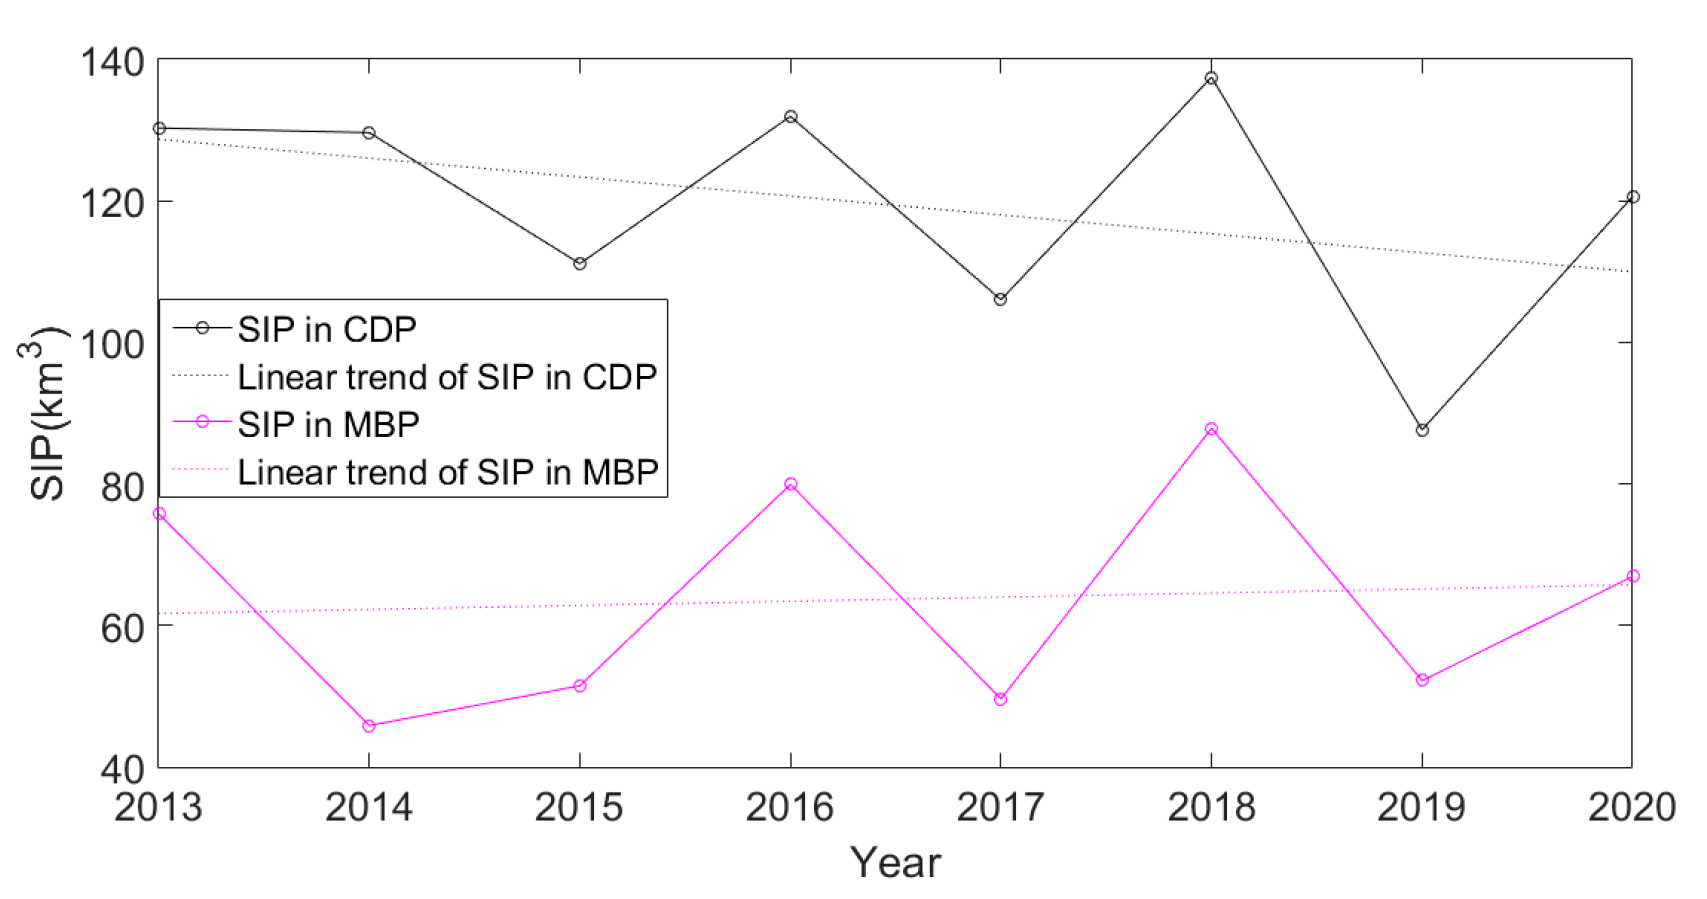
The annual SIP in the CDP and MBP showed a relatively consistent trend, in high agreement with the general trend in the area, as shown in Figure 4. Overall, the annual SIP in the two polynyas fluctuated widely, with the overall trend of SIP fluctuating downward for the CDP and upward for the MBP. SIP in the CDP was generally larger than in the MBP, with the highest SIP occurring in 2018, when it was up to 137.5 km3, and the lowest SIP occurring in 2019, when it was about 87.6 km3. MBP’s highest SIP was about 87.9 km3 in 2018, and its lowest SIP was 45.9 km3 in 2014. Both CDP and MBP reached a maximum SIP in 2018.
The multi-year average SIP in each month in the CDP and MBP are shown in Figure 5. Both CDP and MBP showed their intra-year maximum production in March, and variances in their SIP were the largest in March. The CDP showed a slowly decreasing general trend of SIP, with the highest ice production in March, a slow increase in April–June, a decrease in July, a secondary peak in August, and then a slow decrease again in August–October. The MBP, on the other hand, showed a continuous downward trend of SIP, with a larger decline in March–May and a smaller decline in June–October.

3.3. Impact of the Collapse Event on Sea Ice Production

Considering the collapse event in the Amery Ice Shelf on 20–25 September 2019, the daily SIP from 1 September to 10 October 2019 was calculated and analyzed. Time series of the daily SIP are shown in Figure 6. The daily SIP in both polynyas before and after the collapse showed a fluctuating downward trend. Before the collapse event, the SIP in the CDP was fluctuating downward with a large amplitude, while that in the MBP was firstly increasing and then decreasing. After the collapse, the daily SIP in the CDP decreased to 0.10 km3 and then increased quickly, while the daily SIP in the MBP experienced a ‘down–up–down’ trend. It can be assumed that the collapse event may have exacerbated the volatility of the SIP.

4. Conclusions

In this paper, polynyas in the Amery Ice Shelf were identified, and their SIP was calculated for 2013–2020. It was found that both polynyas in the Amery Ice Shelf showed large fluctuations in the time series of area and SIP, with the maximum intra-annual SIP occurring frequently in March. In addition, based on the analysis of SIP before and after the collapse event, it is assumed that the collapse event may have increased the volatility of SIP.

Funding

This research received no external funding.

Institutional Review Board Statement

Not applicable.

Informed Consent Statement

Not applicable.

Data Availability Statement

The original data presented in the study are openly available in ECMWF at http://doi.org/10.24381/cds.adbb2d47 and in JAXA at ftp.gportal.jaxa.jp (accessed on 28 November 2023).

Conflicts of Interest

The authors declare no conflict of interest.

References

  1. Morales Maqueda, M.A.; Willmott, A.J.; Biggs, N.R.T. Polynya Dynamics: A Review of Observations and Modeling. Rev. Geophys. 2004, 42, RG1004. [Google Scholar] [CrossRef]
  2. Maykut, G.A. Energy exchange over young sea ice in the central Arctic. J. Geophys. Res. Ocean 1978, 83, 3646–3658. [Google Scholar] [CrossRef]
  3. Tamura, T.; Ohshima, K.I.; Nihashi, S. Mapping of sea ice production for Antarctic coastal polynyas. Geophys. Res. Lett. 2008, 35, 284–298. [Google Scholar] [CrossRef]
  4. Gordon, A.L.; Orsi, A.H.; Muench, R.; Huber, B.A.; Zambianchi, E.; Visbeck, M. Western Ross Sea continental slope gravity currents. Deep. Sea Res. Part II Top. Stud. Oceanogr. 2009, 56, 796–817. [Google Scholar] [CrossRef]
  5. Mensah, V.; Nakayama, Y.; Fujii, M.; Nogi, Y.; Ohshima, K.I. Dense water downslope flow and AABW production in a numerical model: Sensitivity to horizontal and vertical resolution in the region off Cape Darnley polynya. Ocean. Model. 2021, 165, 101843. [Google Scholar] [CrossRef]
  6. Nihashi, S.; Ohshima, K.I. Circumpolar Mapping of Antarctic Coastal Polynyas and Landfast Sea Ice: Relationship and Variability. J. Clim. 2015, 28, 3650–3670. [Google Scholar] [CrossRef]
  7. Ohshima, K.I.; Fukamachi, Y.; Williams, G.D.; Nihashi, S.; Roquet, F.; Kitade, Y.; Tamura, T.; Hirano, D.; Herraiz-Borreguero, L.; Field, I.; et al. Antarctic Bottom Water production by intense sea-ice formation in the Cape Darnley polynya. Nat. Geosci. 2013, 6, 235–240. [Google Scholar] [CrossRef]
  8. Nihashi, S.; Ohshima, K.I.; Tamura, T. Sea-Ice Production in Antarctic Coastal Polynyas Estimated From AMSR2 Data and Its Validation Using AMSR-E and SSM/I-SSMIS Data. IEEE J. Sel. Top. Appl. Earth Obs. Remote Sens. 2017, 10, 3912–3922. [Google Scholar] [CrossRef]
  9. Ohshima, K.I.; Nihashi, S.; Iwamoto, K. Global view of sea-ice production in polynyas and its linkage to dense/bottom water formation. Geosci. Lett. 2016, 3, 13. [Google Scholar] [CrossRef]
  10. Nihashi, S.; Ohshima, K.I. Relationship between ice decay and solar heating through open water in the Antarctic sea ice zone. J. Geophys. Res. Ocean. 2001, 106, 16767–16782. [Google Scholar] [CrossRef]
  11. Cox, G.F.N.; Weeks, W.F. Salinity variations in sea ice. J. Glaciol. 1974, 13, 109–120. [Google Scholar] [CrossRef]
  12. Kalnay, E.; Kanamitsu, M.; Kistler, R.; Collins, W.; Deaven, D.; Gandin, L.; Iredell, M.; Saha, S.; White, G.; Woollen, J.; et al. The NCEP/NCAR 40-year reanalysis project. Bull. Am. Meteorol. Soc. 1996, 77, 437–472. [Google Scholar] [CrossRef]
  13. Hersbach, H.; Bell, B.; Berrisford, P.; Biavati, G.; Horányi, A.; Muñoz Sabater, J.; Nicolas, J.; Peubey, C.; Radu, R.; Rozum, I.; et al. ERA5 Hourly Data on Single Levels from 1940 to Present [Dataset]. Copernicus Climate Change Service (C3S) Climate Data Store (CDS). 2018. Available online: https://cds.climate.copernicus.eu/cdsapp#!/dataset/10.24381/cds.adbb2d47?tab=overview (accessed on 28 November 2023).
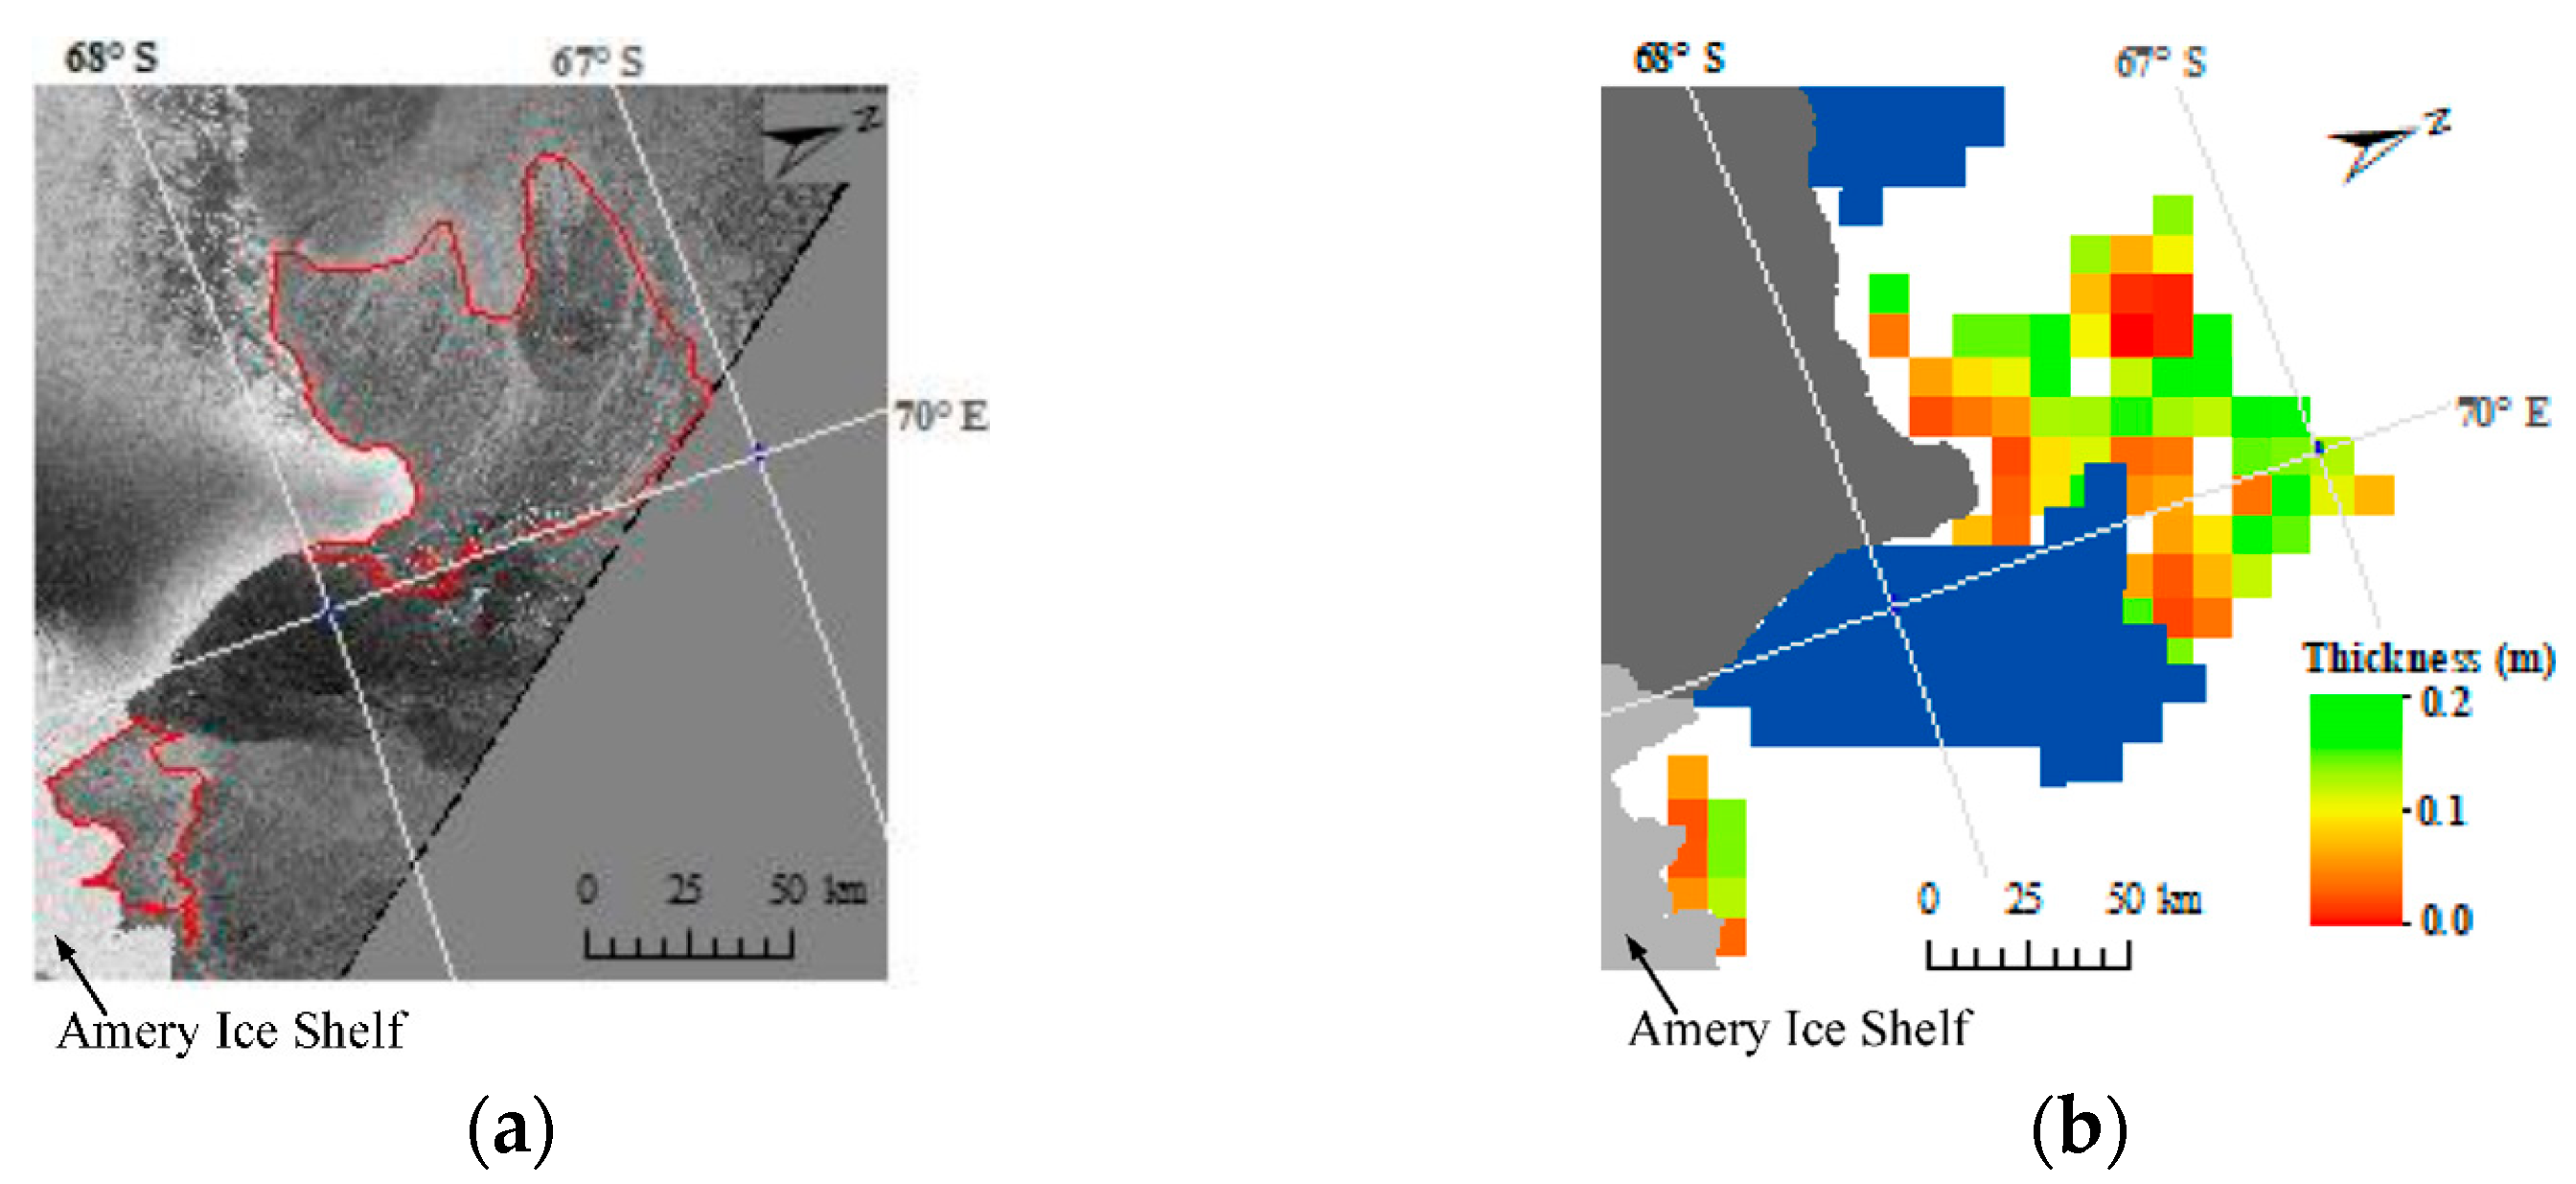
Figure 1. Comparison of the polynyas identified on 20 September 2015 based on (a) Sentinel 1 and (b) AMSR2 data. The areas within the red line are polynya areas extracted based on SAR in this paper.
Environsciproc 29 00042 g001
Figure 2. Interannual variability of the annual mean areas of the studied polynyas in the Amery Ice Shelf.
Environsciproc 29 00042 g002
Figure 3. Spatial distribution of the mean annual ice production in the polynyas in the Amery Ice Shelf.
Environsciproc 29 00042 g003
Figure 4. Interannual variability of annual SIP in the studied polynyas in the Amery Ice Shelf.
Environsciproc 29 00042 g004
Figure 5. Multi-year average SIP in each month in the (a) CDP and (b) MBP.
Environsciproc 29 00042 g005
Figure 6. Figure of the daily SIP from 1 September to 10 October 2019 in the (a) CDP and (b) MBP.
Environsciproc 29 00042 g006
Table 1. Comparison of the results of extracted polynya areas based on Sentinel 1 and AMSR2 dat.
Area of CDP (km2)Area of MBP (km2)
Based on Sentinel 16203979
Based on AMSR26400900
Difference19779
Proportion of the Difference3.2%8.1%
Disclaimer/Publisher’s Note: The statements, opinions and data contained in all publications are solely those of the individual author(s) and contributor(s) and not of MDPI and/or the editor(s). MDPI and/or the editor(s) disclaim responsibility for any injury to people or property resulting from any ideas, methods, instructions or products referred to in the content.