Abstract
Plant growth and health are affected by 0.06–0.09% of crustal fluoride. A semi-empirical model estimated wet soil fluoride using Sentinel-1 5.405 GHz data as dependent on dielectric components and loss angles. Mineral surface charges and electrical potential limited clay soil ion mobility via moisture and permeability. Real and imaginary dielectric components approximated a 3° to 4° loss angle in lab soil samples with high and low fluoride electrical conductivity. An estimated percentage of dielectric component loss over wide areas could have implied fluoride. Finally, linear regression between field fluoride value and conductance loss was used to estimate fluoride. The statistical differences (R2 = 0.86, RMSE = 1.90, and Bias = 0.35) between predicted and simulated fluoride levels over clay soil and soil with different vegetation development suggest that C-band SAR data may detect fluoride.
1. Introduction
The Earth’s crust contains 0.1% fluoride, together with its constituents. Among this, 85 million tonnes of fluoride deposits are in the earth’s crust worldwide, and from this, 12 million tonnes are found in India [1]. In India, >62 million people in almost twenty states face problems due to fluoride ion (F−) [2]. In soil-related studies (moisture, texture, temperature, and roughness), research is initially carried out in a laboratory by taking field samples. In the next stage, based on the initial work, laboratory instruments are modified according to the field conditions to collect real-time data [3,4,5]. However, for large-scale studies, laboratory tests are limited to the varying soil conditions from region to region, and the results obtained cannot apply to other field conditions. Hence, as an alternative, remote sensing technology was adopted to overcome the limitation of the problem above.
Researchers used optical remote sensing to map soil characteristics using sensitivity-based indices. The empirical models or indices used were as follows: the perpendicular drought index (PDI), temperature vegetation dryness index (TVDI), Noah land surface model (LSM), normalized difference turbidity index (NDTI), Palmer drought severity index (PDSI), modified perpendicular drought index (MPDI), normalized multi-band drought index (NMDI), and a systematic scientific theorem [6,7,8]. For the past 30 years, geologic remote sensing has employed Landsat TM pictures to map lithology and lineaments—specifically, mineralogy and the iron oxide ratio. The Landsat TM band 7 to band 5 ratio was utilised to distinguish argillic and non-argillic materials because it demonstrates hydroxyl absorption band sensitivity. The band-based methods were accurate for very salty soils, whereas less salty soils were drawn with intermediate accuracy and improved with fuzzy boundaries. Recently, automated image classification on learning selection, using soil imagery and salinity index values, was used to create salinity maps. One of the main limitations of optical remote sensing is that it introduces more climatic uncertainty and also poorly penetrates the soil’s subsurface.
Thus, microwave remote sensing is used in soil research since it is unaffected by environmental conditions and provides extensive information due to its penetration. The small perturbation model (SPM), integral equation model (IEM), advanced integral equation model (AIEM), semi-empirical water cloud model, and Michigan Microwave Canopy Scattering model (MIMICS) all measure soil moisture, but they are limited to flat terrain soil, surfaces covered in different materials, and more field parameters [9,10,11]. Instead, [Lievens and Verhoest] and [Zhou] added vegetation characteristics to the water cloud model to eliminate vegetation and improve accuracy.
Thus, numerous techniques have been created to illustrate the fact that the soil dielectric constant (DC) depends on volumetric moisture content and textural composition [12]. Dobson’s model initially proposed a soil moisture–dielectric constant relationship; however, it failed to separate bound and bulk water. The Mirnov model proposed transition moisture to circumvent this limitation, but it was susceptible to excessive sand content [13]. To circumvent the limitations of both approaches, the density space dielectric model (DSDM) was created to distinguish saline soil from non-saline soil by considering soil texture as a function of moisture and polarisation [14]. Limited to individual salt elements, a well-established relationship between the dielectric constant and total salt levels in the imaginary section can be used to estimate soil water system dielectric loss [15]. The study’s model [16] derived fluoride components from dielectric tangent loss by connecting the real and imaginary (ϵi) components of the dielectric constant [17].
The objective of this study is as follows: (i) to evaluate the performance of ISVI in soil moisture evaluation; (ii) to evaluate the performance of the Soil Textural Index considering ISVI-based soil moisture; and (iii) to propose a modified approach to estimate fluoride in soil.
2. Material and Methods
2.1. Study Area and Data Feasibility
The Perambalur district is in southern India, in the centre of Tamilnadu, between 10° 54’ and 11° 30’ N and 78° 40’ and 79° 30’ E. The southern plateau district has semi-arid weather, moderate moisture levels, and geological conditions that are similar to those of black granite worldwide. Agriculture accounts for nearly half of the district’s 93,581 Ha, and the cultivated area is used to mobilise fluoride. The district’s soil is loamy red and black with substantial clay concentration, covering 943.83 square kilometres or 53% of the total area. According to the 2019–20 report, fertiliser application comprises 16,627 metric tons, soil fertility is extremely poor, and organic carbon is moderate to high in alkaline.
This study collected synthetic aperture radar of Interferometric Wide-Swath Mode (IW) C-band data from Sentinel-1, with dual polarisation on 4 March 2022, matching field observations. This study used Sentinel-1 data with a 12-day return interval and a Level-1 ground range (GRD) format with a spatial resolution of 10 m. [18] details how the processes of radiometric calibration, speckle filtering, and Range-Doppler terrain correction are carried out.
Salinity and fluoride in the soil are harmful to crops, especially mid-stage. Therefore, field surveys were conducted during cropping. To maintain field conditions, soil and water samples from 165 sites were kept in zip-lock bags, and 30 percent of the samples were considered for validation. A soil moisture kit measured volume percentage at a 5 cm depth. Laboratory tests assessed electrochemical parameters, such as electrical conductivity (EC), pH, and fluoride content, after site sample collection [19,20]. A conical flask shaker mixed the soil samples at room temperature of 24 ± 2 °C, with a 1:5 soil–field water ratio for over 30 min. Finally, a conductivity probe was coupled to a pH/EC Metre network and analysed at 4 to 6 GHz frequency, and a spectrophotometer measured EC, pH, dielectric components, [14] and fluoride. Laboratory research showed that water bodies in Perambalur lost more fictitious water to agricultural patches, which was analysed from the water obtained from varied soil and mineral sources. The study area map of the Perambalur District in India is illustrated in Figure 1.
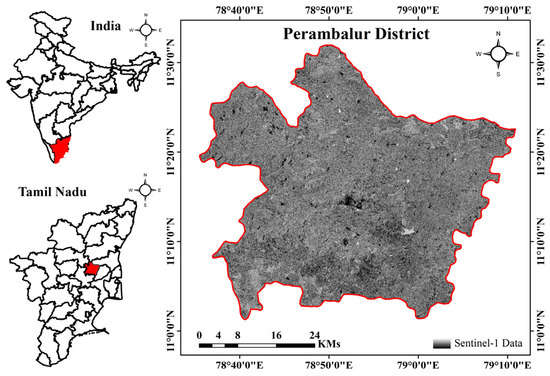
Figure 1.
Study area map of the Perambalur district, India.
2.2. Spatial Model for Soil Metrics
The moisture content obtained from SAR data consists of both soil moisture and vegetation moisture, as shown in Equation (1). ISVI is the empirical model that accounts for the estimation of vegetation in soil moisture by multiplying the ISVI index with the total moisture shown in Equation (2) [21]. Subtracting vegetation moisture from total moisture yields soil moisture, as shown in Equation (3). By using an empirical simulation, titled “Soil Textural Index (STI)”, based on the surface under study, soil in a semi-saturated condition with constant roughness can be found, as shown in Equation (4) [14]. A density space dielectric model is used to estimate soil salinity. According to the database, the real part (ϵ’) of field saline soil from total salt is higher than the imagined part (ϵ”), while the imaginary part from fluoride soil is less than the total salinity. This shows that fluoride dielectric loss is smaller than the soil salts. The distinction between fluoride and other components helps us distinguish them.
The absence of free water makes estimating the imaginary part of dielectric loss difficult. Thus, high saline conditions are used to calculate fluoride content. High saline/high fluoride and high saline/low fluoride soil sample data were measured in the lab. High saline/low fluoride soil is considered non-fluoride saline, with fluoride having a minor influence, while high saline/high fluoride has a greater effect and helps define a dielectric constant. A 2D plot between the real and imaginary parts of fluoride helps estimate conductance losses due to fluoride and can be quantified. The imaginary part of soil fluoride is estimated as a function of real and imaginary parts of the dielectric constant and the tangent loss, as shown in Equation (5). A linear relationship between in situ soil fluoride and the imaginary part of fluoride shows fluoride values in mg/kg. The relationship between the real and imaginary parts of the dielectric constant is visualized in Figure 2, specifically through the tangent loss.
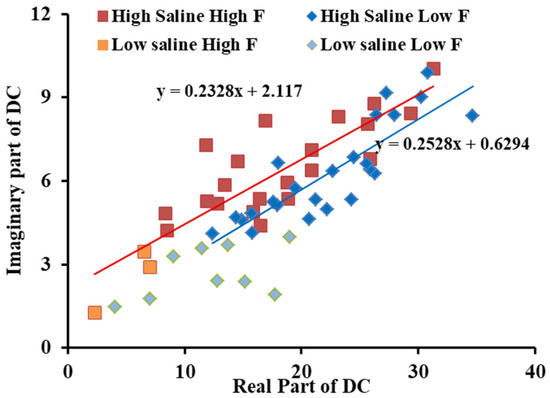
Figure 2.
Tangent loss between the real and imaginary part of the dielectric constant.
3. Result and Discussion
3.1. Soil Moisture and Textural Index
This study solely considers polarisation and ignores temperature in soil moisture evaluation. Polarisation is difficult to estimate in dry soil with moisture below 10%, resulting in overestimation. However, co-polarisation works well for soil moisture increases of 10–50%. A statistical examination for validation demonstrated that the SAR data product corresponds to an R2 of 0.83. In the upper 30%, soil and field moisture matched. Due to confined water, the bottom region ranging from 0 to 10% was difficult to anticipate. The soil textural index (STI) showed sand and clay percentages by moisture content and grain-size-related porosity. The range of STI was 0.1 to 0.5, indicating that the research area had 50% to 75% clay soil and 34% to 50% sand. Clay soil badly affected soil texture, and sandy soil was not gathered. An STI score of 0 to 0.18 indicates high levels of clay (40%) and sand (60%), whereas a range of 0.19 to 0.6 indicates low levels of clay (30%) and high levels of sand (70%). A number greater than 0.6 indicates more sand and less clay and was not considered in this study. Texture is an important soil study feature that affects bound and free water in salt mobilisation when considering grain size [22].
This study examined the significance of the soil texture index (STI) as a metric that is influenced by both precipitation rate and soil grain-specific surface area. The STI plays a crucial role in enhancing the interactions between electrical charges and fluid particles. A soil texture range of 0–0.4 has a higher clay content and comparatively lower levels of silt and sand. The phenomenon of cavitation has an impact on the velocity and elevation of water, which is contingent upon the size of soil particles [23]. Hence, the soil texture index (STI) demonstrates a reliable capacity to appropriately depict soil type and dielectric constant; however, its ability to accurately assess clay and sand fraction is limited. This study demonstrates that the real component exhibits a positive correlation with soil moisture, rising from 20 to 50. Similarly, the imaginary component also displays a positive relationship, increasing from 0 to 10. These findings contribute to our comprehension of the characteristics of bound and free water. Figure 3a presents the Validation and analysis performed on the Soil moisture, considering the field-observed values. Furthermore, Figure 3b proposed soil textural index is also subjected to classification.
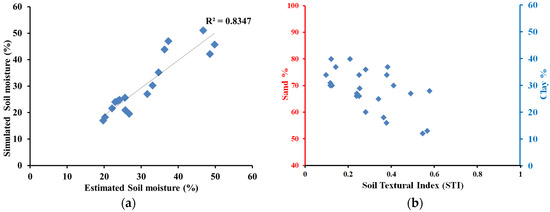
Figure 3.
Validation and analysis of (a) soil moisture with field-observed values; (b) proposed soil textural index.
3.2. Fluoride
Depending on ionic conductivity, soil pH is acidic or alkaline. A hypothetical chunk of fluoride-affected soil was segregated from tangent loss to distinguish it from non-fluoride soil. The dielectric constant of soil with total salts and fluoride was 0.81 and 0.86, respectively. The fluoride present in the soil ranged between 42 to 573 with an RMSE of 1.90 and positive bias of 0.35, as well as a significance level of 0.005. The model’s accuracy was affected by over-estimating total salt and fluoride salt in the lower real and imaginary portions. Outliers were removed to determine the model’s accurate range, and it performed well in real and imaginary part ranges above 2. Fluoride ranged from 0 to 200 mg/kg, a model with an R2 of 0.81 performed well, and STI values less than 0.2 were exaggerated in large amounts. An STI of 0.2 to 0.4 was significantly exaggerated, and fluoride was between 201 and 400 mg/kg. The plot showed good agreement; the STI results were between 0.4 and 0.7, the range of fluoride was 401 mg/kg to 600 mg/kg, and the STI values above 0.7 were underestimated; the value was larger than 601 mg/kg. From this, it was possible to conclude that soil texture played a major role in fluoride contamination due to the amount of sand and clay. Figure 4 illustrates the validation of the simulated fluoride levels compared to the estimated fluoride levels obtained through conventional methods.
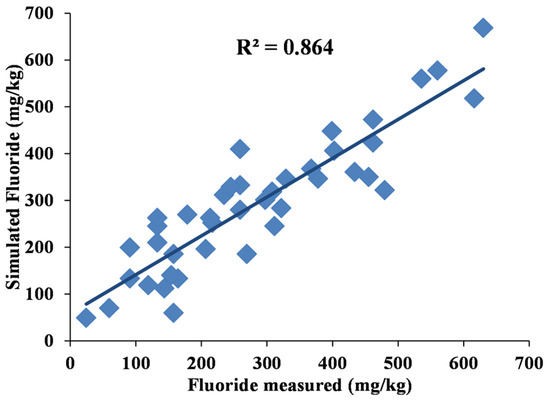
Figure 4.
Validation of the simulated fluoride content with estimated fluoride content from conventional methods.
Additionally, the presence of clay increased fluoride content and vice versa, which might aid the F-estimate. The results showed that the imaginary part of the dielectric constant simulated, owing to fluoride content with soil moisture content, was identical to the DSDM model and exactly proportionate to soil salt concentration. The salinity caused by fluoride could be accurate and useful in determining its concentration. Fluoride in low-moisture soil or soil with bound water cannot dissolve entirely. The more water in the soil, the more free ions migrate, increasing salinity and dielectric components. Counter ions travel mostly due to moisture. The link between electrical potential and mineral surface charges restricts clay soil mobility, confirming fluoride and C band frequency. Polarisation alone limits conductivity due to clay surface ionic concentration fluctuations.
Dry soil has a high dielectric constant because its volumetric water is minimal and its bound and free water influences are negligible. pH is crucial to soil salinity. An acidic soil pH range of 5 to 7 increases fluoride ion sorption and matches an anticipated imaginary part of the dielectric constant R2 of 0.75. The soil fields collected lacked an acidic soil pH range of 0 to 5; hence, no investigations were carried out. Alkaline soil in the sample ranged from 7 to 9. Clay soil is alkaline; thus, positively charged ions sorb on its surface and reduce fluoride ion accumulation. Alkaline soils had an R2 of 0.90 that matched the fictitious component. In clay soil, pH-dependent charges form uncompensated bonds controlled by inter-ions [24]. Quantifying mineral electrical characteristics requires soil pH. This part simulates the fluoride model to compare pH and evaluate dependability. Soluble fluoride components diminish soil sorption at a lower pH [25]. Adding water to soil affects OH mobilisation, which controls pH levels from acidic to alkaline. Leaching solid fluoride components from soil to water-soluble F-rises. At a high pH, pH-dependent negative charges on variably charged clay surfaces diminish soil F retention and raise F concentration. Thus, F sorption greatly depends on pH, and the most dominant soil for F-ion mobilisation is pH 4–6. Based on previous studies, acidic soil causes more ionic movement; therefore, this study correlates geographically measured permittivity value with measured soil using straight-line fitting. Prototypical soils with varied silt and low sand content increase uncertainty. Figure 5 displays the estimated fluoride response to both soil moisture and soil pH.
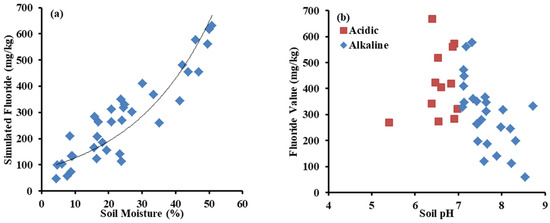
Figure 5.
Response of the estimated fluoride to (a) soil moisture and (b) soil pH.
4. Conclusions
Fluoride increases clay soil dielectric loss due to dry unsaturated soil moisture. This showed that soil moisture affected the dielectric constant and could be used to forecast it over broad areas of time. Tangent loss increases with the moisture level in clay soil, indicating that tangent loss (θ) can identify F-salt content. Soil with low tanδ and high ϵi moisture has dielectric characteristics similar to pure water. Future aspects should include modifying the soil moisture model to confront the problem in dry situations with polarisation. Second, login polarisation and conductivity loss cause dielectric losses. The login polarisation must be considered in the world, and conductivity loss affects salinity.
Author Contributions
V.K. created the fundamental concept and methodology; conducted the field and laboratory tests; and statistically analysed, visualised, and prepared the manuscript. M.A. validated, evaluated, supervised, and edited the manuscript. All authors have read and agreed to the published version of the manuscript.
Funding
This research received no external funding.
Institutional Review Board Statement
Not applicable.
Informed Consent Statement
Not applicable.
Data Availability Statement
Data will be shared on request.
Acknowledgments
The authors express their gratitude to the Department of Civil Engineering, Faculty of Engineering and Technology, SRM Institute of Science and Technology, Kattankulathur, for their assistance and exceptional laboratory resources in facilitating this study. The provision of complimentary data dissemination by the European Space Agency is highly valued.
Conflicts of Interest
The authors do not have any conflicts of interest.
References
- Unde, M.P.; Patil, R.U.; Dastoor, P.P. The untold story of fluoridation: Revisiting the changing perspectives. Indian J. Occup. Environ. Med. 2018, 22, 121. [Google Scholar] [PubMed]
- Singh, G.; Kumari, B.; Sinam, G.; Kumar, N.; Mallick, S. Fluoride distribution and contamination in the water, soil and plants continuum and its remedial technologies, an Indian perspective—A review. Environ. Pollut. 2018, 239, 95–108. [Google Scholar] [CrossRef] [PubMed]
- Yardımcı, B.; Uzer, A.; Apak, R. Spectrophotometric fluoride determination using St. John’s wort extract as a green chromogenic complexant for Al (III). ACS Omega 2022, 7, 45432–45442. [Google Scholar] [CrossRef] [PubMed]
- Zhu, L.; Zhang, H.H.; Xia, B.; Xu, D.R. Total fluoride in Guangdong soil profiles, China: Spatial distribution and vertical variation. Environ. Int. 2007, 33, 302–308. [Google Scholar] [CrossRef] [PubMed]
- Singh, G.; Sinam, G.; Kriti Pandey, M.; Kumari, B.; Kulsoom, M. Soil pollution by fluoride in India: Distribution, chemistry and analytical methods. In Environmental Concerns and Sustainable Development: Volume 2: Biodiversity, Soil and Waste Management; Springer: Berlin/Heidelberg, Germany, 2020; pp. 307–324. [Google Scholar]
- Shahabfar, A.; Ghulam, A.; Eitzinger, J. Drought monitoring in Iran using the perpendicular drought indices. Int. J. Appl. Earth Obs. Geoinf. 2012, 18, 119–127. [Google Scholar] [CrossRef]
- Hazaymeh, K.; Hassan, Q.K. A remote sensing-based agricultural drought indicator and its implementation over a semi-arid region, Jordan. J. Arid. Land 2017, 9, 319–330. [Google Scholar] [CrossRef]
- Chandrasekar, K.; Sesha Sai, M.V.R.; Roy, P.S.; Dwevedi, R.S. Land Surface Water Index (LSWI) response to rainfall and NDVI using the MODIS Vegetation Index product. Int. J. Remote Sens. 2010, 31, 3987–4005. [Google Scholar] [CrossRef]
- Zhang, X.; Zhang, H.; Wang, C.; Tang, Y.; Zhang, B.; Wu, F.; Wang, J.; Zhang, Z. Soil moisture estimation based on the distributed scatterers adaptive filter over the QTP permafrost region using sentinel-1 and high-resolution TerraSAR-X data. Int. J. Remote Sens. 2021, 42, 902–928. [Google Scholar] [CrossRef]
- Kornelsen, K.C.; Coulibaly, P. Advances in soil moisture retrieval from synthetic aperture radar and hydrological applications. J. Hydrol. 2013, 476, 460–489. [Google Scholar] [CrossRef]
- Yu, F.; Zhao, Y. A new semi-empirical model for soil moisture content retrieval by ASAR and TM data in vegetation-covered areas. Sci. China Earth Sci. 2011, 54, 1955–1964. [Google Scholar] [CrossRef]
- Wang, Y.-L.; Liu, Y.-G.; Schmitt, R.A. (Appendix 1) Element Concentrations in Sediment and Basalt Samples from DSDP Holes 75-530A and 75-530B. PANGAEA. 1986. Available online: https://doi.pangaea.de/10.1594/PANGAEA.707253 (accessed on 17 November 2023).
- Mialon, A.; Richaume, P.; Leroux, D.; Bircher, S.; Al Bitar, A.; Pellarin, T.; Wigneron, J.P.; Kerr, Y.H. Comparison of Dobson and Mironov dielectric models in the SMOS soil moisture retrieval algorithm. IEEE Trans. Geosci. Remote Sens. 2015, 53, 3084–3094. [Google Scholar] [CrossRef]
- Ravi, K.P.; Periasamy, S. Integrated SAR simulation to categorize the stressed and salt-tolerant crops using Sentinel-1 data. Geocarto Int. 2022, 37, 3659–3678. [Google Scholar] [CrossRef]
- Sreenivas, K.; Venkataratnam, L.; Rao, P.N. Dielectric properties of salt-affected soils. Int. J. Remote Sens. 1995, 16, 641–649. [Google Scholar] [CrossRef]
- Jacob, M.V.; Hartnett, J.G.; Mazierska, J.; Krupka, J.; Tobar, M.E. Dielectric characterisation of Barium Fluoride at cryogenic temperatures using TE011 and quasi TE0mn mode dielectric resonators. Cryogenics 2006, 46, 730–735. [Google Scholar] [CrossRef]
- Jacob, M.V. Low temperature microwave characterisation of lithium fluoride at different frequencies. Sci. Technol. Adv. Mater. 2005, 6, 944–949. [Google Scholar] [CrossRef][Green Version]
- Filipponi, F. Sentinel-1 GRD preprocessing workflow. In Proceedings of the 3rd International Electronic Conference on Remote Sensing, Online, 22 May–5 June 2019; p. 11. [Google Scholar]
- Singh, B.; Dolk, M.M.; Shen, Q.; Camps-Arbestain, M. Biochar pH, electrical conductivity and liming potential. In Biochar a Guide to Analytical Methods; CSIRO Publishing: Clayton, Australia, 2017; Volume 23. [Google Scholar]
- Pagliano, E.; Meija, J.; Ding, J.; Sturgeon, R.E.; D’Ulivo, A.; Mester, Z. Novel ethyl-derivatization approach for the determination of fluoride by headspace gas chromatography/mass spectrometry. Anal. Chem. 2013, 85, 877–881. [Google Scholar] [CrossRef] [PubMed]
- Krishnan, V.; Periasamy, S.; Ravi, K.P. Integrated SAR Vegetation Index for Rabi And Kharif Crops. In Proceedings of the IGARSS 2022—2022 IEEE International Geoscience and Remote Sensing Symposium, Kuala Lumpur, Malaysia, 17–22 July 2022; pp. 6406–6409. [Google Scholar]
- Újvári, G.; Kok, J.F.; Varga, G.; Kovács, J. The physics of wind-blown loess: Implications for grain size proxy interpretations in Quaternary paleoclimate studies. Earth-Sci. Rev. 2016, 154, 247–278. [Google Scholar] [CrossRef]
- Sun, J.; Ge, X.; Chu, D.; Zhang, L.; Meng, H.; Zheng, Y. Effects of sediment diameter and concentration on cavitation characteristics and mechanism. Tribol. Int. 2022, 171, 107543. [Google Scholar] [CrossRef]
- Li, X. Developing Highly Efficient Oxygen Evolution Reaction Electrocatalysts by Electronic Structure Regulation on Transition Metal Oxides. Ph.D Thesis, University of Wollongong, Wollongong NSW, Australia, 2020. [Google Scholar]
- Onipe, T.; Edokpayi, J.N.; Odiyo, J.O. Geochemical characterization and assessment of fluoride sources in groundwater of Siloam area, Limpopo Province, South Africa. Sci. Rep. 2021, 11, 14000. [Google Scholar] [CrossRef] [PubMed]
Disclaimer/Publisher’s Note: The statements, opinions and data contained in all publications are solely those of the individual author(s) and contributor(s) and not of MDPI and/or the editor(s). MDPI and/or the editor(s) disclaim responsibility for any injury to people or property resulting from any ideas, methods, instructions or products referred to in the content. |
© 2023 by the authors. Licensee MDPI, Basel, Switzerland. This article is an open access article distributed under the terms and conditions of the Creative Commons Attribution (CC BY) license (https://creativecommons.org/licenses/by/4.0/).