Abstract
As urban areas expand, the focus on improving outdoor thermal comfort intensifies. This study generated Summer Discomfort Index (SDI) maps for Seville and Barcelona (Spain), as well as Tetuan (Morocco). SDI integrates temperature and humidity for an accurate comfort assessment. Calculations involved substituting air temperature with land surface data from MODIS and incorporating humidity from weather stations, then comparing it to Thermal Sensation Votes (TSV) gathered through surveys. The objective was to assess thermal comfort levels and explore the relationship between remotely sensed SDI and residents’ reported perception. These detailed SDI maps offer crucial insights into summer thermal conditions, advancing urban climate studies and influencing urban planning, design, and well-being strategies.
1. Introduction
In recent decades, urbanization has been a pivotal force, signifying the concentration of populations in cities and the consequential expansion of urban areas. This shift has emerged as a central topic in contemporary urban policy discussions, underlining its paramount importance [1]. Against the backdrop of global climate change and the swift pace of urban development, urban residents are confronted with progressively severe environmental challenges [2,3,4]. These challenges necessitate an urgent focus on enhancing outdoor thermal comfort to ensure the well-being of city dwellers.
Various thermal comfort indices are employed to assess the subjective perception of thermal comfort [5,6,7,8]. The Summer Discomfort Index (SDI) [9] is a modified version of Thom’s Thermal Discomfort Index [10]; it introduces a more visual approach to evaluating thermal comfort during warm seasons. Through user-friendly maps, it combines temperature and humidity factors, providing a clear measure of outdoor comfort levels. These maps can provide a valuable tool in urban planning and design.
2. Materials and Methods
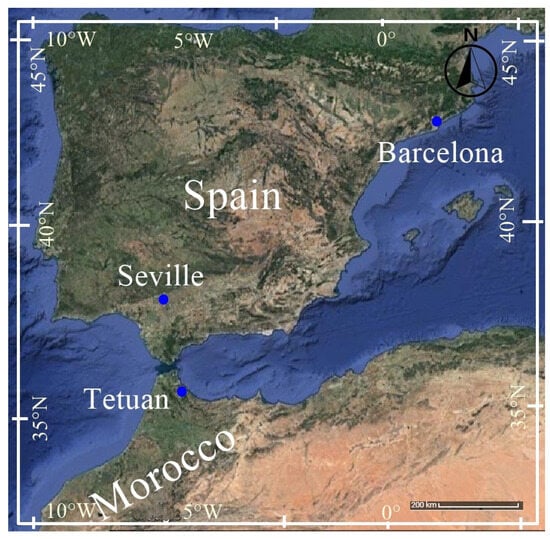
Questionnaires were administered over various days in June 2022 in Tetuan, Morocco (35.5889° N, 5.3626° W), and on specific days in June 2023 in Seville (37.3891° N, 5.9845° W) and Barcelona (41.3874° N, 2.1686° E), Spain (Figure 1).

Figure 1.
Study areas: Tetuan, Morocco, and Seville, Barcelona, Spain.
All questionnaires included various personal and environmental questions. For the sensation vote, ASHRAE’S [11,12] seven-point scale was employed for evaluating thermal comfort. Consequently, Thermal Sensation Votes (TSVs) were calculated based on the following rating: −3 for feeling cold, −2 for feeling cool, −1 for feeling slightly cool, 0 for feeling comfortable, 1 for feeling slightly warm, 2 for feeling warm, and 3 for feeling hot.
The Summer Discomfort Index (SDI) in this study was derived by leveraging the observed correlation between air temperature and land surface temperature. This correlation enabled the establishment of a precise linear regression equation, which is pivotal in calculating SDI values. This equation was then seamlessly integrated into the SDI maps, ensuring a dependable and accurate portrayal of thermal discomfort across our selected locations. This process was underpinned by meticulous data acquisition over a comprehensive period of three decades, drawing from four distinct outdoor thermal comfort databases covering ten cities with diverse geographical and climatic profiles. In instances where air temperature data were not directly accessible, we relied on trustworthy weather stations to supplement our dataset. Additionally, land surface temperature data for each location were sourced from the Moderate Resolution Imaging Spectroradiometer (MODIS), further enhancing the robustness and comprehensiveness of our thermal environment representation. The main daily humidity data, derived from reputable weather stations, were used as the second component in the calculation of SDI.
3. Results
In Tetuan, Morocco, we observed the lowest temperatures coupled with the highest levels of humidity. In stark contrast, Seville exhibited the highest temperatures but experienced the lowest humidity levels. Barcelona fell in between, ranking second for both temperature and humidity (Table 1).

Table 1.
Average Thermal Sensation Vote (TSV), temperature, and humidity in the studied cities.
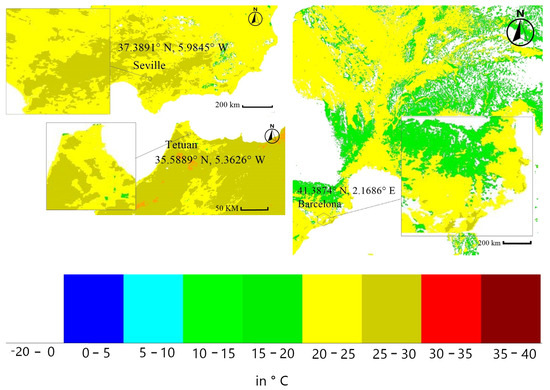
Furthermore, our analysis using Summer Discomfort Index (SDI) maps (Figure 2) on the same date revealed insightful patterns. The high temperatures in Seville, coupled with the elevated humidity levels in Tetuan, rendered both cities slightly warmer than Barcelona. Interestingly, Barcelona’s SDI map indicated localized spots that offered a marginally more comfortable thermal experience compared to the other cities.

Figure 2.
Summer Discomfort Index map (SDI) of the three different cities on 15 June 2023.
4. Discussion
The comparative analysis of Tetuan, Seville, and Barcelona provides valuable insights into the diverse thermal environments within cities classified under the same Köppen climate type (Csa). Notably, Tetuan, Morocco, exhibited the lowest temperatures in the studied period along with the highest humidity levels, while Seville, Spain, experienced elevated temperatures and lower humidity levels, and Barcelona fell in between, ranking second for both temperature and humidity. These findings emphasize the nuanced microclimatic differences that significantly influence the thermal experiences of residents and visitors.
The observed variations in thermal conditions align with the geographic and climatic characteristics of each city. Tetuan, located in northern Morocco, experiences the moderating influence of the Mediterranean Sea, leading to milder temperatures but higher humidity levels. Seville, situated inland in southern Spain, is characterized by hot, dry summers typical of continental climates. Barcelona, also along the Mediterranean coast, benefits from a maritime influence, resulting in relatively moderate temperatures and humidity levels.
The Summer Discomfort Index (SDI) further corroborates our findings. Both Tetuan and Seville, with their combination of high temperatures and humidity levels, exhibited slightly higher discomfort levels compared to Barcelona. Interestingly, Barcelona’s SDI map revealed localized areas that offered a slightly more comfortable thermal experience. This suggests the presence of microclimatic variations within the city, influencing the perceived thermal comfort of its inhabitants.
5. Conclusions
The characteristics of the environment, an individual’s capacity for adaptation, and the insulation of one’s clothing are among the variables that affect thermal sensation variations. Research and planning are made easier by the objective depiction of thermal conditions provided by visual maps. The Summer Discomfort Index (SDI) brings attention to the differences in thermal perception among cities and emphasizes the value of using both objective measurements and subjective assessments.
Additionally, in this study, the cities exhibited distinct temperature and humidity profiles. In Tetuan, Morocco, the lowest temperatures were observed with high humidity, while Seville experienced high temperatures with low humidity. Barcelona ranked in-between. Despite sharing a Köppen climate classification (Csa), significant microclimatic differences were observed, underlining their impact on residents’ experiences.
In summary, our findings demonstrate the intricate interplay between temperature, humidity, and thermal comfort in these Mediterranean cities. These nuanced differences should be carefully considered in urban planning and design to create spaces that prioritize the well-being and comfort of inhabitants.
Author Contributions
Conceptualization, methodology, and writing—original draft preparation, S.A.; supervision, review and editing C.P.O. and N.R. All authors have read and agreed to the published version of the manuscript.
Funding
This research received no external funding.
Institutional Review Board Statement
Not applicable.
Informed Consent Statement
Participants were provided with a detailed explanation that the questionnaires used in the study do not request any private information and are designed to ensure their total anonymity. After this explanation, participants verbally provided their consent to participate in the study.
Data Availability Statement
Data available upon request.
Conflicts of Interest
The authors declare no conflicts of interest.
References
- Almulhim, A.I.; Cobbinah, P.B. Can rapid urbanization be sustainable? The case of Saudi Arabian cities. Habitat Int. 2023, 139, 102884. [Google Scholar] [CrossRef]
- Ward, K.; Lauf, S.; Kleinschmit, B.; Endlicher, W. Heat waves and urban heat islands in Europe: A review of relevant drivers. Sci. Total Environ. 2016, 569–570, 527–539. [Google Scholar] [CrossRef] [PubMed]
- Deng, X.; Nie, W.; Li, X.; Wu, J.; Yin, Z.; Han, J.; Lam, C.K.C. Influence of built environment on outdoor thermal comfort: A comparative study of new and old urban blocks in Guangzhou. Build. Environ. 2023, 234, 110133. [Google Scholar] [CrossRef]
- Ren, Z.; Fu, Y.; Dong, Y.; Zhang, P.; He, X. Rapid urbanization and climate change significantly contribute to worsening urban human thermal comfort: A national 183-city, 26-year study in China. Urban Clim. 2022, 43, 101154. [Google Scholar] [CrossRef]
- He, X.; Shao, L.; Tang, Y.; Wu, S. Improving children’s outdoor thermal comfort: A field study in China’s severely cold regions. Urban Clim. 2023, 51, 101620. [Google Scholar] [CrossRef]
- Miao, C.; He, X.; Gao, Z.; Chen, W.; He, B.J. Assessing the vertical synergies between outdoor thermal comfort and air quality in an urban street canyon based on field measurements. Build. Environ. 2023, 227, 109810. [Google Scholar] [CrossRef]
- Lam, C.K.C.; Weng, J.; Liu, K.; Hang, J. The effects of shading devices on outdoor thermal and visual comfort in Southern China during summer. Build. Environ. 2023, 228, 109743. [Google Scholar] [CrossRef]
- Yuan, T.; Hong, B.; Qu, H.; Liu, A.; Zheng, Y. Outdoor thermal comfort in urban and rural open spaces: A comparative study in China’s cold region. Urban Clim. 2023, 49, 101501. [Google Scholar] [CrossRef]
- Ahsissene, S.; Rhziel, F.Z.; Raissouni, N. Assessment and synergy analysis of outdoor thermal comfort and thermal infrared remote sensing for urban heat island studies. MATEC Web Conf. 2022, 371, 02004. [Google Scholar] [CrossRef]
- Thom, E.C. The Discomfort Index. Weatherwise 1959, 12, 57–61. [Google Scholar] [CrossRef]
- Baquero, M.T.; Forcada, N. Thermal comfort of older people during summer in the continental Mediterranean climate. J. Build. Eng. 2022, 54, 104680. [Google Scholar] [CrossRef]
- ASHRAE Standard 55-2004; Thermal Environmental Conditions for Human Occupancy 55-2004. American Society of Heating, Refrigerating and Air-Conditioning Engineers Inc.: Peachtree Corners, Georgia, 2004; Volume 2004, pp. 1–34.
Disclaimer/Publisher’s Note: The statements, opinions and data contained in all publications are solely those of the individual author(s) and contributor(s) and not of MDPI and/or the editor(s). MDPI and/or the editor(s) disclaim responsibility for any injury to people or property resulting from any ideas, methods, instructions or products referred to in the content. |
© 2024 by the authors. Licensee MDPI, Basel, Switzerland. This article is an open access article distributed under the terms and conditions of the Creative Commons Attribution (CC BY) license (https://creativecommons.org/licenses/by/4.0/).