
The Improvement of Methane Plume Detection with High-Resolution Satellite-Based Imaging Spectrometers †

 ,
,  , , and
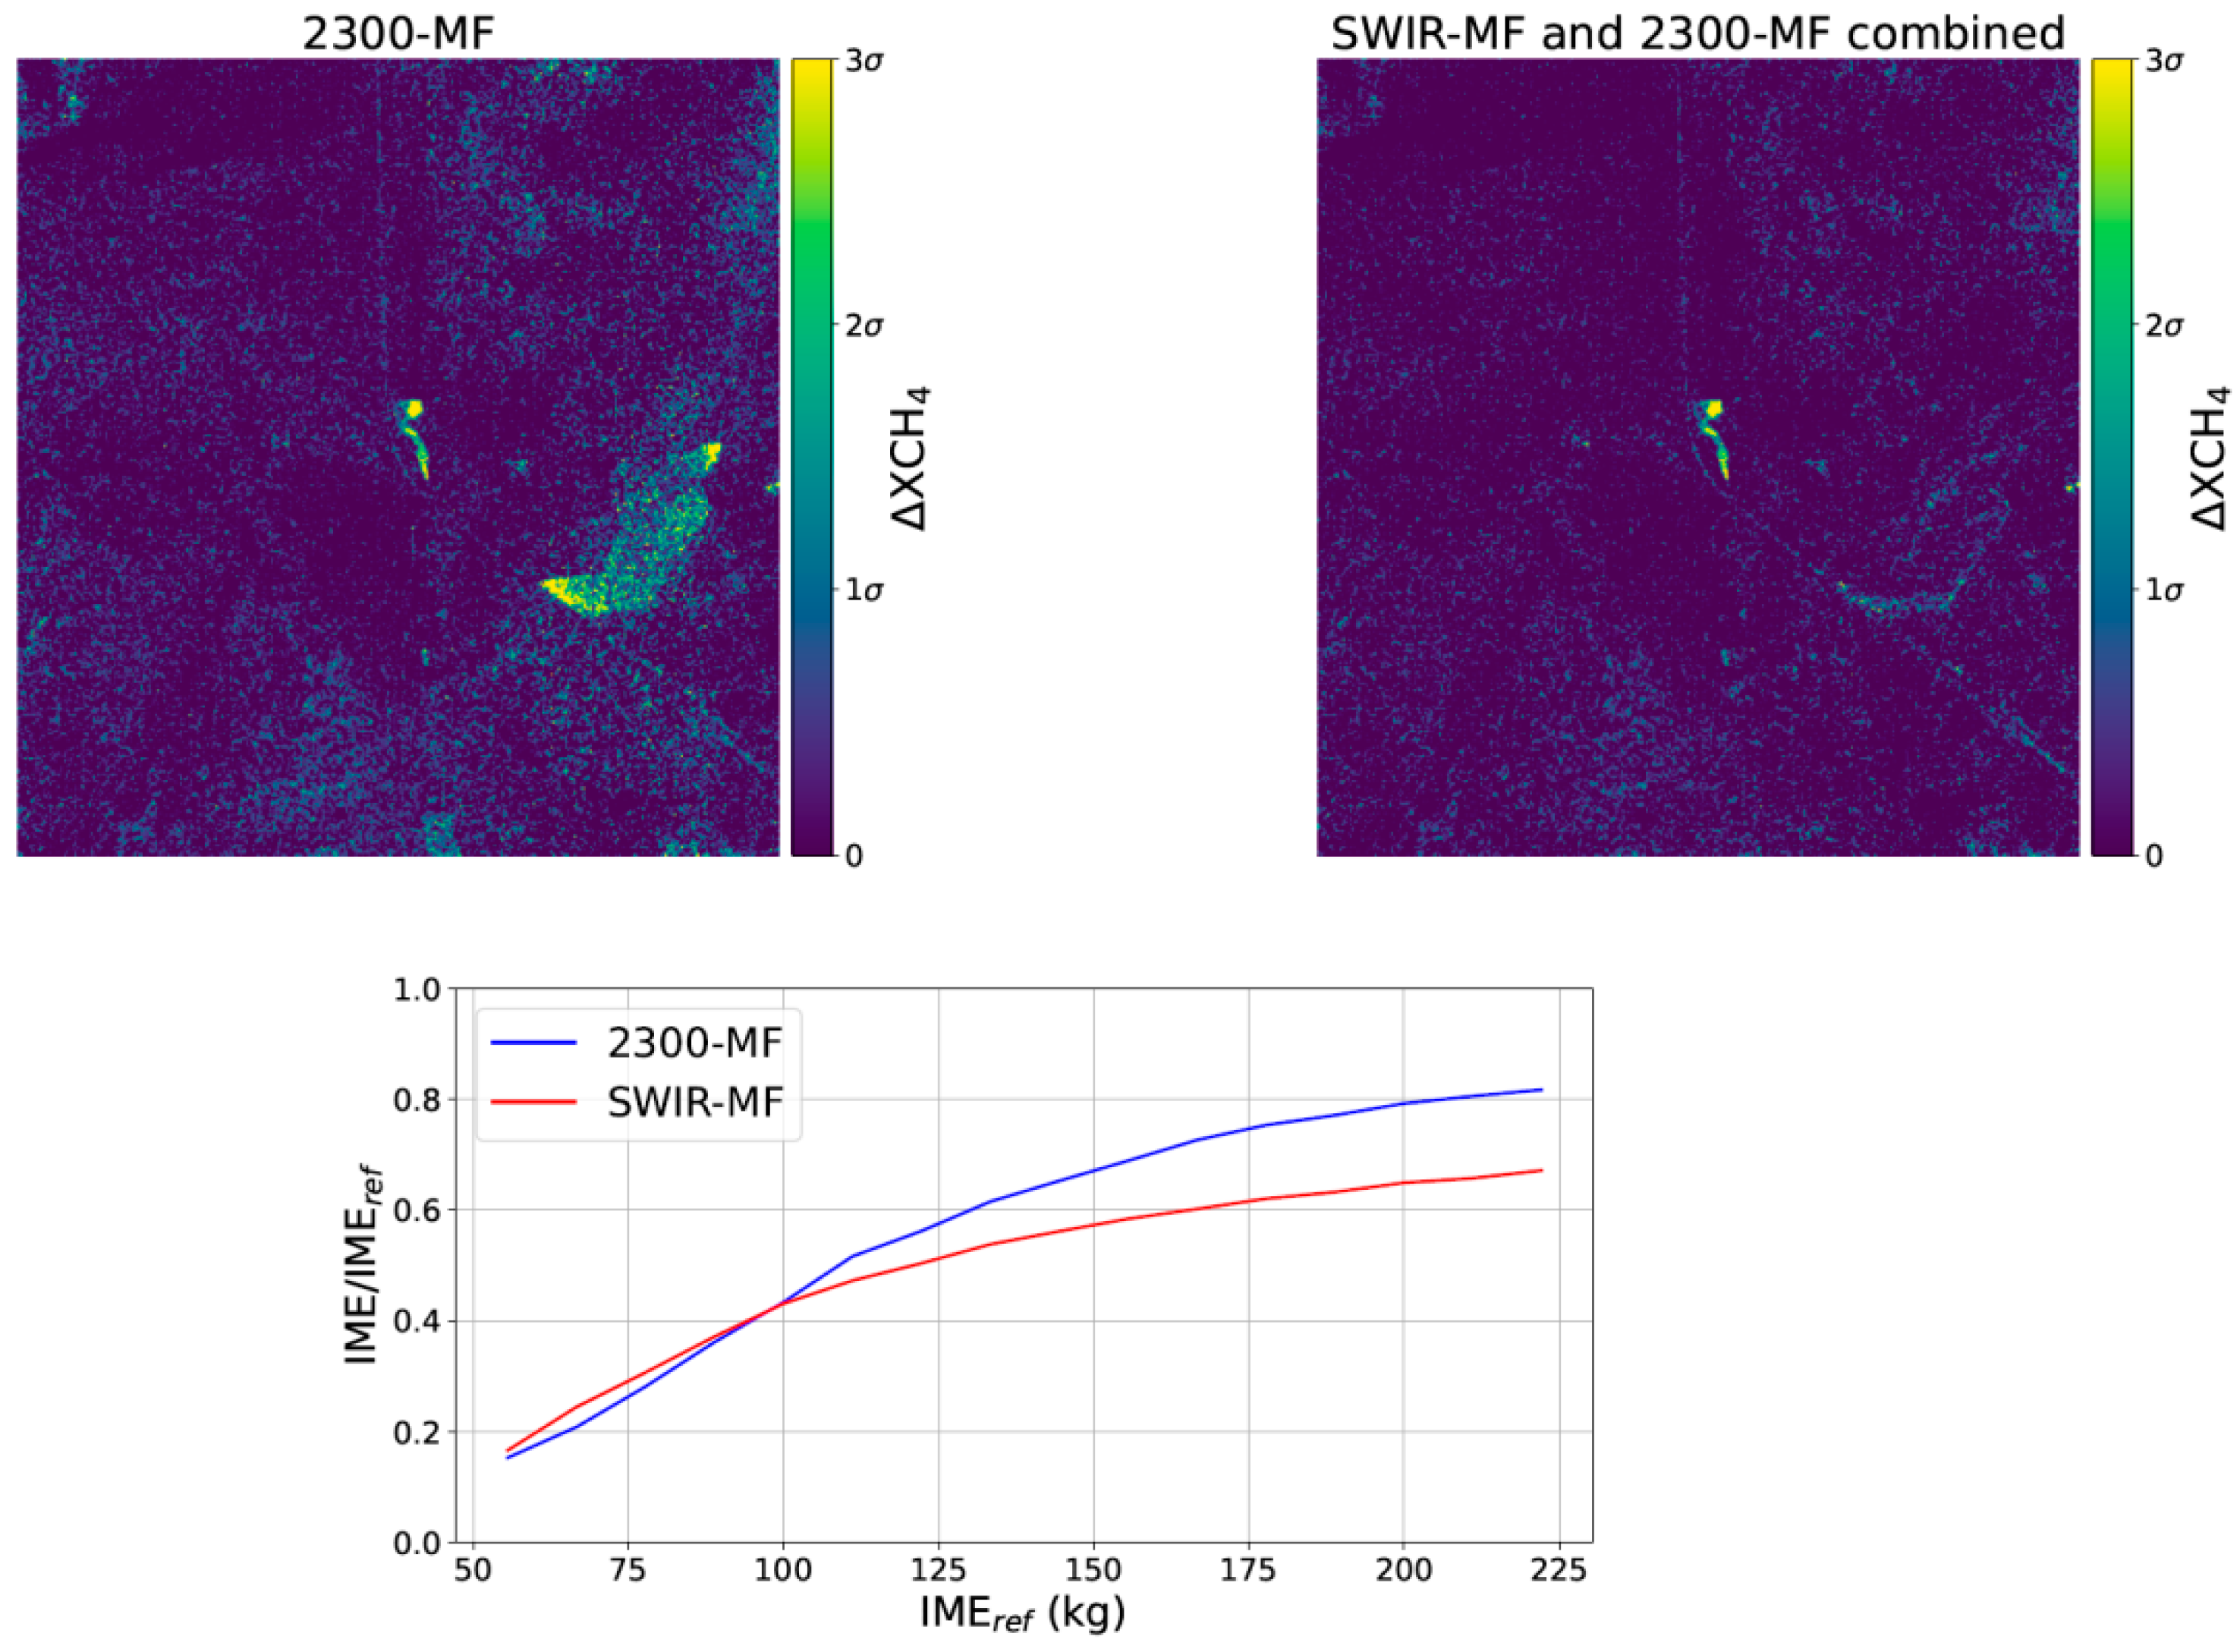
Abstract
1. Introduction
2. Materials and Methods
2.1. Materials
2.2. Matched-Filter Method
2.3. Quantification and Detection of Methane Emissions
3. Results
3.1. End-to-End Simulation Analysis
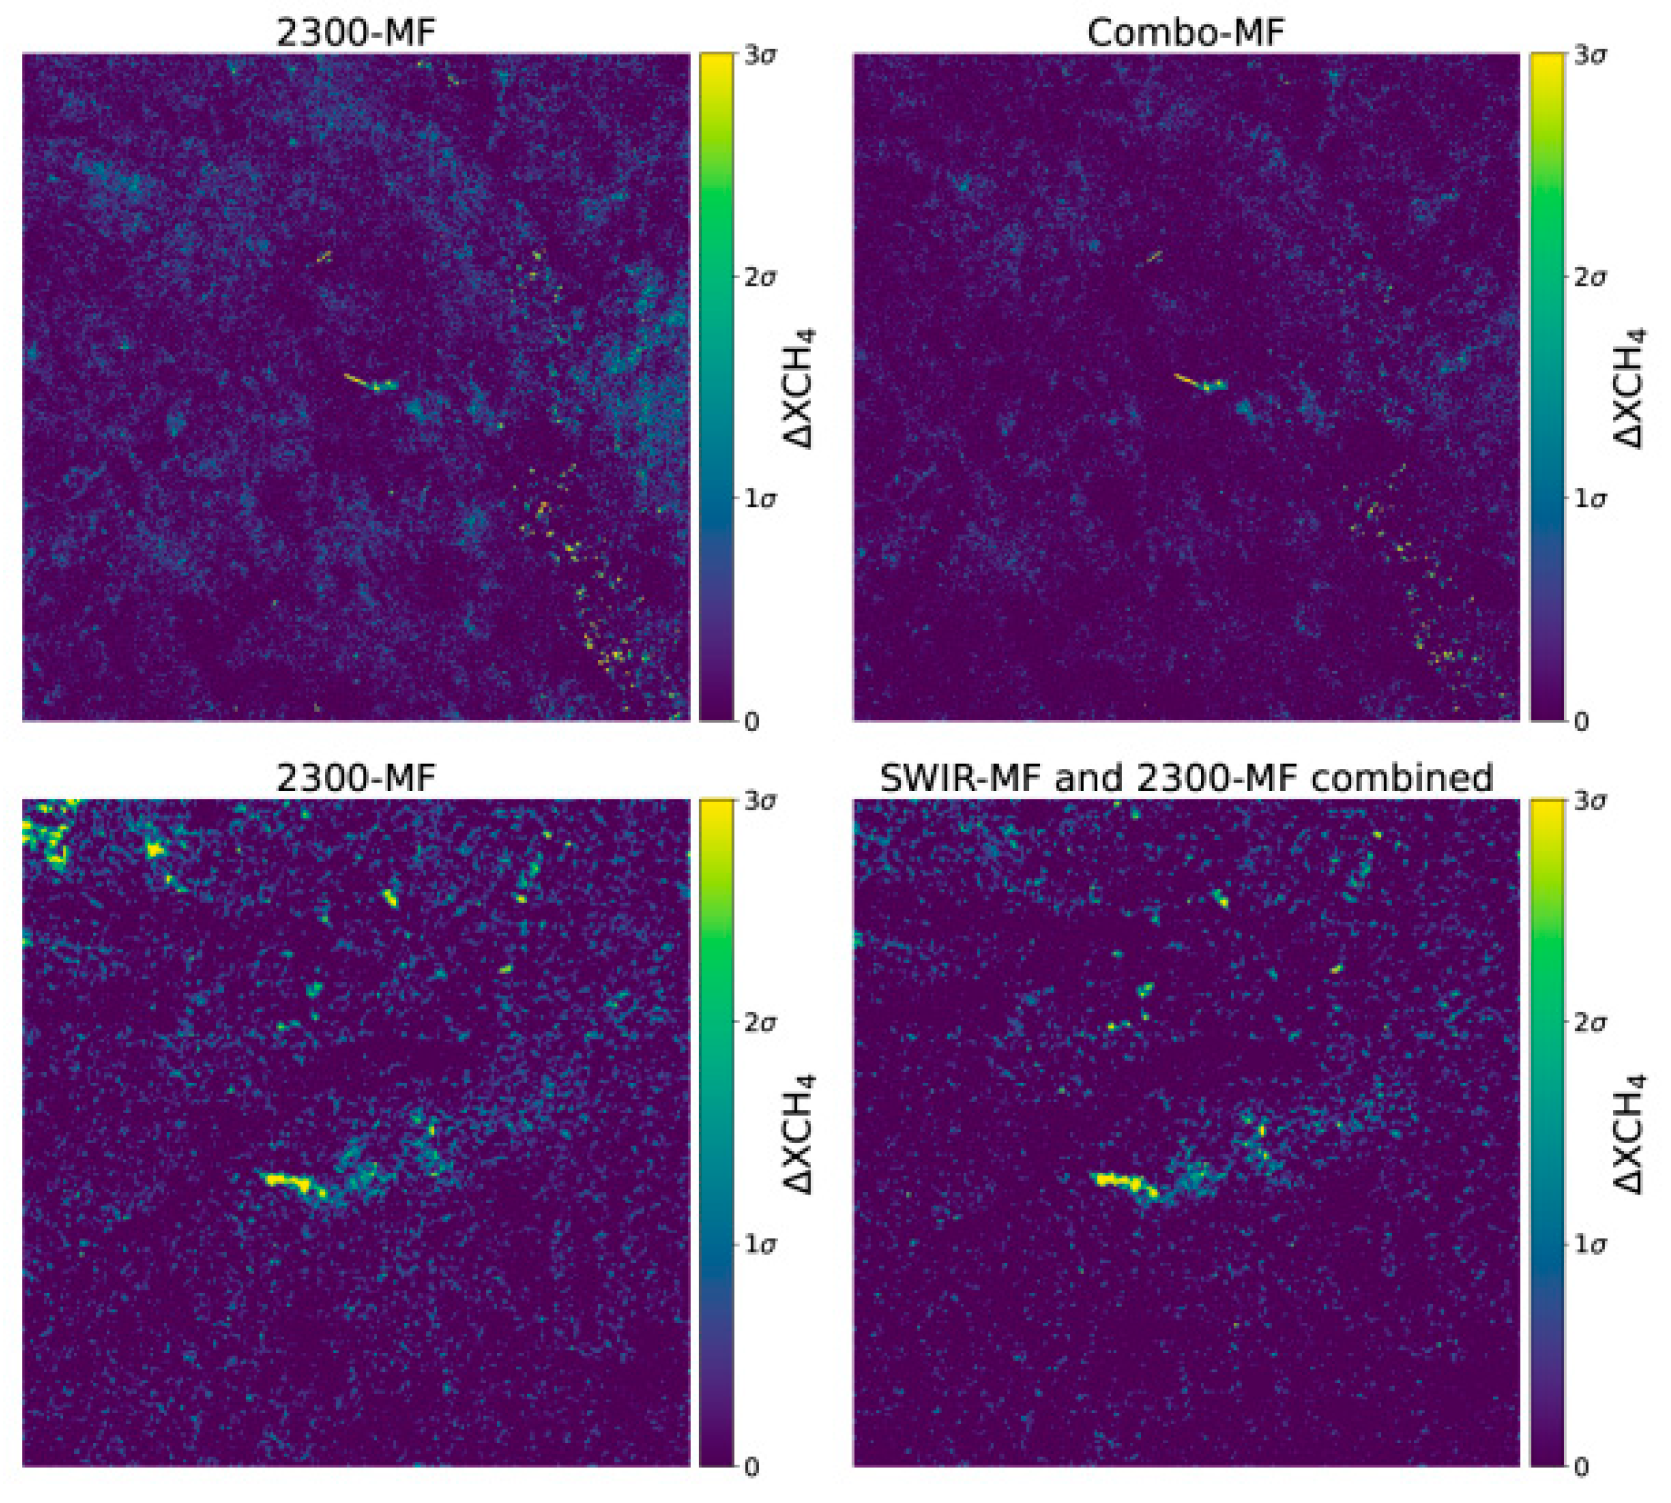
3.2. Real Cases
4. Conclusions
Author Contributions
Funding
Acknowledgments
Conflicts of Interest
References
- IPCC. Climate Change 2013: The Physical Science Basis. Contribution of Working Group I to the Fifth Assessment Report of the Intergovernmental Panel on Climate Change; Stocker, T.F., Qin, D., Plattner, G.-K., Tignor, M., Allen, S.K., Boschung, J., Nauels, A., Xia, Y., Bex, V., Midgley, P.M., Eds.; Cambridge University Press: Cambridge, UK, 2013. [Google Scholar]
- Irakulis-Loitxate, I.; Guanter, L.; Liu, Y.-N.; Varon, D.J.; Maasakkers, J.D.; Zhang, Y.; Chulakadabba, A.; Wofsy, S.C.; Thorpe, A.K.; Duren, R.M.; et al. Satellite-based survey of extreme methane emissions in the Permian basin. Sci. Adv. 2021, 7, eabf4507. [Google Scholar] [CrossRef] [PubMed]
- Foote, M.D.; Dennison, P.E.; Thorpe, A.K.; Thompson, D.R.; Jongaramrungruang, S.; Frankenberg, C.; Joshi, S.C. Fast and Accurate Retrieval of Methane Concentration from Imaging Spectrometer Data Using Sparsity Prior. IEEE Trans. Geosci. Remote. Sens. 2020, 58, 6480–6492. [Google Scholar] [CrossRef]
- Thompson, D.R.; Leifer, I.; Bovensmann, H.; Eastwood, M.; Fladeland, M.; Frankenberg, C.; Gerilowski, K.; Green, R.O.; Kratwurst, S.; Krings, T.; et al. Real-time remote detection and measurement for airborne imaging spectroscopy: A case study with methane. Atmospheric Meas. Tech. 2015, 8, 4383–4397. [Google Scholar] [CrossRef]
- Varon, D.J.; Jacob, D.J.; McKeever, J.; Jervis, D.; Durak, B.O.A.; Xia, Y.; Huang, Y. Quantifying methane point sources from fine-scale satellite observations of atmospheric methane plumes. Atmos. Meas. Tech. 2018, 11, 5673–5686. [Google Scholar] [CrossRef]
- Frankenberg, C.; Thorpe, A.K.; Thompson, D.R.; Hulley, G.; Kort, E.A.; Vance, N.; Borchardt, J.; Krings, T.; Gerilowski, K.; Sweeney, C.; et al. Airborne methane remote measurements reveal heavy-tail flux distribution in Four Corners region. Proc. Natl. Acad. Sci. USA 2016, 113, 9734–9739. [Google Scholar] [CrossRef] [PubMed]
- Molod, A.; Takacs, L.; Suarez, M.; Bacmeister, J.; Song, I.-S.; Eichmann, A. The GEOS-5 Atmospheric General Circulation Model: Mean Climate and Development from MERRA to Fortuna. Technical Memorandum (TM); NASA Technical Report Series on Global Modeling and Data Assimilation; NASA: Greenbelt, MD, USA, 2012; NASA TM—2012-104606. [Google Scholar]


Disclaimer/Publisher’s Note: The statements, opinions and data contained in all publications are solely those of the individual author(s) and contributor(s) and not of MDPI and/or the editor(s). MDPI and/or the editor(s) disclaim responsibility for any injury to people or property resulting from any ideas, methods, instructions or products referred to in the content. |
© 2024 by the authors. Licensee MDPI, Basel, Switzerland. This article is an open access article distributed under the terms and conditions of the Creative Commons Attribution (CC BY) license (https://creativecommons.org/licenses/by/4.0/).
Share and Cite
Roger, J.; Irakulis-Loitxate, I.; Gorroño, J.; Valverde, A.; Guanter, L. The Improvement of Methane Plume Detection with High-Resolution Satellite-Based Imaging Spectrometers. Environ. Sci. Proc. 2023, 28, 20. https://doi.org/10.3390/environsciproc2023028020
Roger J, Irakulis-Loitxate I, Gorroño J, Valverde A, Guanter L. The Improvement of Methane Plume Detection with High-Resolution Satellite-Based Imaging Spectrometers. Environmental Sciences Proceedings. 2023; 28(1):20. https://doi.org/10.3390/environsciproc2023028020
Chicago/Turabian StyleRoger, Javier, Itziar Irakulis-Loitxate, Javier Gorroño, Adriana Valverde, and Luis Guanter. 2023. "The Improvement of Methane Plume Detection with High-Resolution Satellite-Based Imaging Spectrometers" Environmental Sciences Proceedings 28, no. 1: 20. https://doi.org/10.3390/environsciproc2023028020
APA StyleRoger, J., Irakulis-Loitxate, I., Gorroño, J., Valverde, A., & Guanter, L. (2023). The Improvement of Methane Plume Detection with High-Resolution Satellite-Based Imaging Spectrometers. Environmental Sciences Proceedings, 28(1), 20. https://doi.org/10.3390/environsciproc2023028020