Proceeding Paper

Extreme Wind Speed Long-Term Trends Evaluation in the Russian Arctic Based on the COSMO-CLM 36-Year Hindcast †

Department of Meteorology and Climatology, Faculty of Geography, Lomonosov Moscow State University, 119991 Moscow, Russia
*
Author to whom correspondence should be addressed.
Presented at the 6th International Electronic Conference on Atmospheric Sciences, 15–30 October 2023; Available online: https://ecas2023.sciforum.net/.
Environ. Sci. Proc. 2023, 27(1), 6; https://doi.org/10.3390/ecas2023-15126
Published: 14 October 2023
(This article belongs to the Proceedings of The 6th International Electronic Conference on Atmospheric Sciences)

Abstract

:
The high-resolution long-term hydrometeorological “COSMO-CLM Russian Arctic hindcast” based on nonhydrostatic regional atmospheric model COSMO-CLM v.5.06 for the 1980–2016 period covering the North Atlantic, Barents, and Kara and Laptev Seas with ~12 km grid size was utilized to estimate climatological trends of extreme wind speed. In this study, we used the 10 m wind speed data from 95 Russian weather stations inside the hindcast domain. Trends in mean, maximal, 0.90, 0.95, 0.99 quantiles wind speed values, and occurrences of wind speed above 20, 25, 30, and 33 m/s were calculated for all stations and corresponding nearest model grids for yearly data and data from four months of the calendar year (January, April, July, and October). Yearly mean wind speed and quantiles values were observed to increase over the northern Kara Sea, while decreases were observed over the western Barents Sea and northern Atlantic. Extreme wind speeds were observed to increase in January in the eastern Evenkia and northern Yakutia, while declining was observed over north-eastern European Russia. The 0.99 quantile values increased in July near the Gyda peninsula coastline, but decreased over polar regions, the Pechora Sea, and the White Sea coastline. Maximal wind speed declined in October over north-western European Russia, eastern Taymyr, and the Norway Sea, but grew over the Eastern Siberian Sea.

1. Introduction

The Arctic region is characterized by rapid climate changes. The warming rate in the Arctic regions is two to four times larger than the rate across the entire globe [1,2,3]. The cause of this phenomenon lies in a whole complex of physical processes, including intense meridional heat transport in the atmosphere and ocean from Atlantic [4], and is closely related to a dramatic decrease in sea ice cover [5,6,7]. However, regional features of the Arctic warming are significantly different and challenges remain in clarifying and detailing these differences [8].
The observed sea ice retreat and extending of open sea areas in the Arctic Ocean contribute to an increase in the occurrence of extreme winds [9,10]. Drastic declines in summer Arctic sea ice cover are induced by the earlier onset of surface melting [11], later freezing, and consequently longer period of sea ice retreat and open water [12,13]. This is conducive to increasing the extreme winds caused by the enhancement of the baroclinic instability over the water–ice borders. This is also manifested in the increase in the frequency of severe weather events (e.g., polar lows) [14,15,16,17]. Arctic warming and the corresponding sea ice decline has significant impacts on synoptic-scale processes, leading to new regions of polar low formation (e.g., more frequent storm tracks from the Pacific Ocean to the Laptev, East Siberian Sea, and Kara Sea due to meridional circulation processes intensification) [18,19]. These areas are now exposed to the development of polar lows, due to less sea ice [20]. Another notable synoptical feature is the westward shift of wintertime Arctic anticyclone, Atlantic cyclones blocking, and, consequently, storm tracks shifting poleward [21].
Coastal regions in the Arctic are characterized by severe events caused by a compounding of large-scale circulations and surface properties (e.g., tip jets, channel winds, barrier effects, downslope windstorms, etc. [22,23]), but are often an essential part of synoptic-scale systems [24,25]. Striking examples of interactions of hydrodynamic flow with mountain ranges are downslope windstorms; in the Russian Arctic, there are Novaya Zemlya bora, Pevek yuzhak, and foehn in Svalbard and Tiksi [26]. Large polynya areas, puddles and hummocks, and moving cracks form heat fluxes significantly higher in comparison with concentrated ice fields [27]. Additionally, the growth of the open water area leads to an increase in the probability of the formation of wind waves and significant wave height growth at sea [23,28,29].
Thus, a significant aspect of severe wind speed features is closely related to and/or caused by different mesoscale phenomena. Therefore, a detailed description of these processes requires appropriate spatial horizontal and vertical (especially, within surface and boundary layers) resolution. The available datasets in the Arctic region are either fragmentary (stations and expeditions data), have too coarse spatial resolution (climatic datasets, reanalyses, climate models tend to have grid size of dozens of kilometers), or have restricted time spans (satellite data), which does not allow many severe weather events or processes responsible for heat exchange in a surface layer to be accurately resolved. Therefore, the underestimation of the role of mesoscale processes affects many aspects and regional features related to the study of Arctic climate changes.
The high-resolution COSMO-CLM Russian Arctic hindcast covering the period 1980–2016 with ~12 km grid size [30] provides wide opportunities to study features related to regional Arctic climate changes in more detail, including surface wind speed patterns. Primary assessments of the hindcast have demonstrated that it presents an appropriate reproduction of the main climatological patterns of the surface wind speeds; moreover, the details are manifested in many regions which were not reflected in the parental ERA-Interim global dataset. The frequency of high wind speeds has been observed to have increased significantly over the Barents Sea, Arctic islands, and some seacoasts and mainland areas, especially at well-known sites with high frequency of strong winds (Novaya Zemlya, Svalbard, Tiksi, etc.) [30]. The detailed COSMO-CLM Russian Arctic hindcast application provides an opportunity to obtain more justified estimates of observed Arctic climate changes, specifically in regard to regional features of surface wind speed trends in the Russian Arctic.

2. Materials and Methods

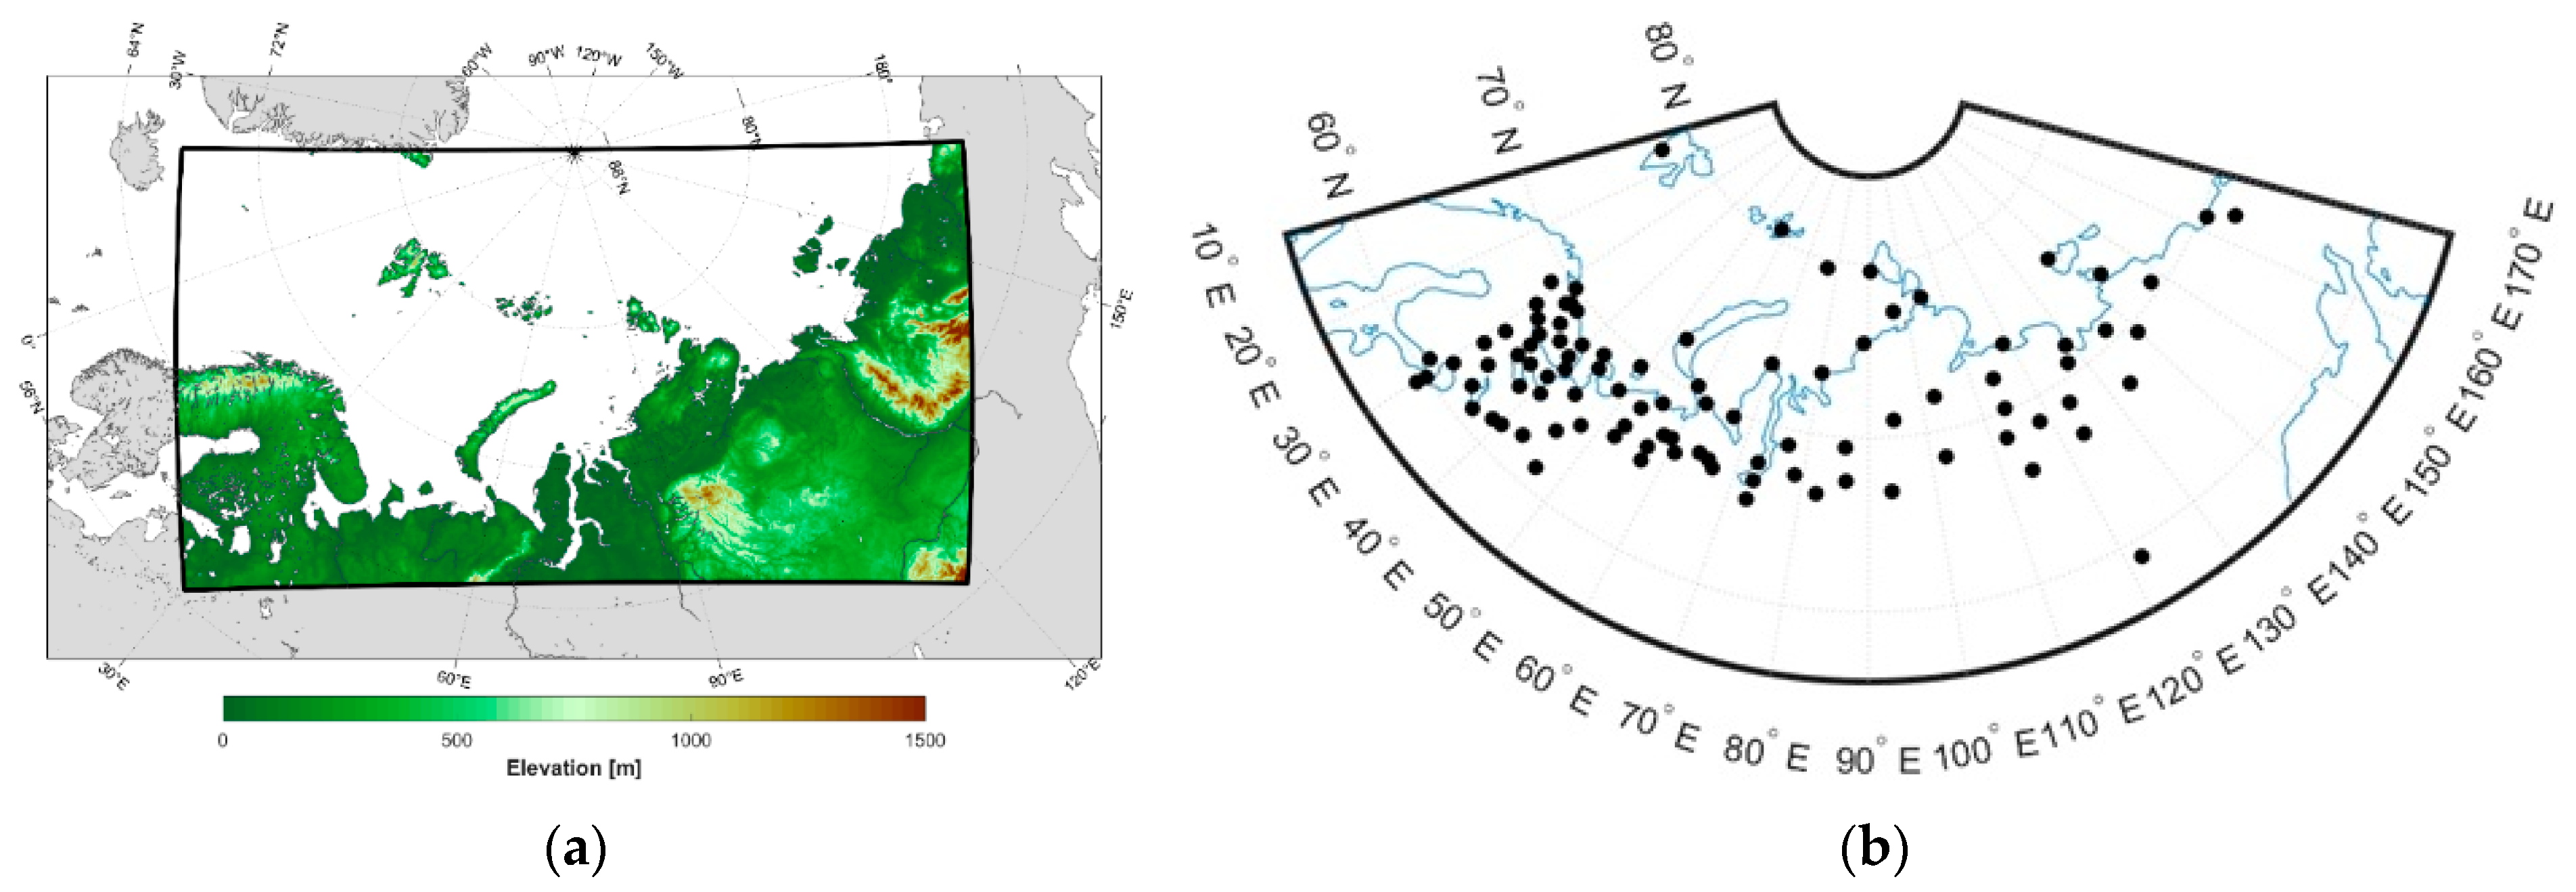
2.1. COSMO-CLM Russian Arctic Hindcast

The COSMO-CLM Russian Arctic hindcast, which includes a hundred different hydrometeorological parameters on the surface and 50 model levels, was created using the long-term COSMO-CLM v.5.06 regional atmospheric hydrodynamic modeling and spanned the Barents, Kara Sea, and Laptev Sea, with a grid size of 0.108° (~12 km) (Figure 1a). The final long-term experiments were forced by the ERA-Interim reanalysis [31,32], including the spectral nudging technique.
All variables have been written out with 1 h step, and the total data volume is about 120 Tb. The COSMO-CLM Russian Arctic hindcast data are in part available on the Figshare repository for the periods 1980–2008 and 2010–2016 [33] and include the most important surface fields: 2 m air temperature and humidity, sea level pressure, zonal and meridional 10 m wind speed components, surface radiation and heat fluxes, and precipitation with 3-hourly timestep. More detailed information on the creation of the hindcast and its initial evaluations can been found in [30,32]. Primary surface wind speed evaluations of the hindcast according to stations and satellite data were presented in [34], showing good reproduction of average wind speed, with the underestimation of extreme quantiles up to 8–10 m/s. Spatial verification according to the FSS method showed the relevance of simulated strong wind speed patterns to the model resolution of ~12 km.

2.2. Weather Stations Data

In this study, we used the 10-min average 10 m wind speed data from 95 Russian weather stations inside the hindcast domain from Roshydromet [35] (Figure 1b). Trends in mean and maximal wind speed, 0.90, 0.95, and 0.99 quantiles values, and occurrences above 20, 25, 30, and 33 m/s were calculated for all stations, nearest model grids and whole model domain for yearly data and data from four months of the calendar year: January, April, July, and October. Statistical significance of all trends was estimated according to the Student’s t-test at the 0.95 level.

3. Results and Discussion

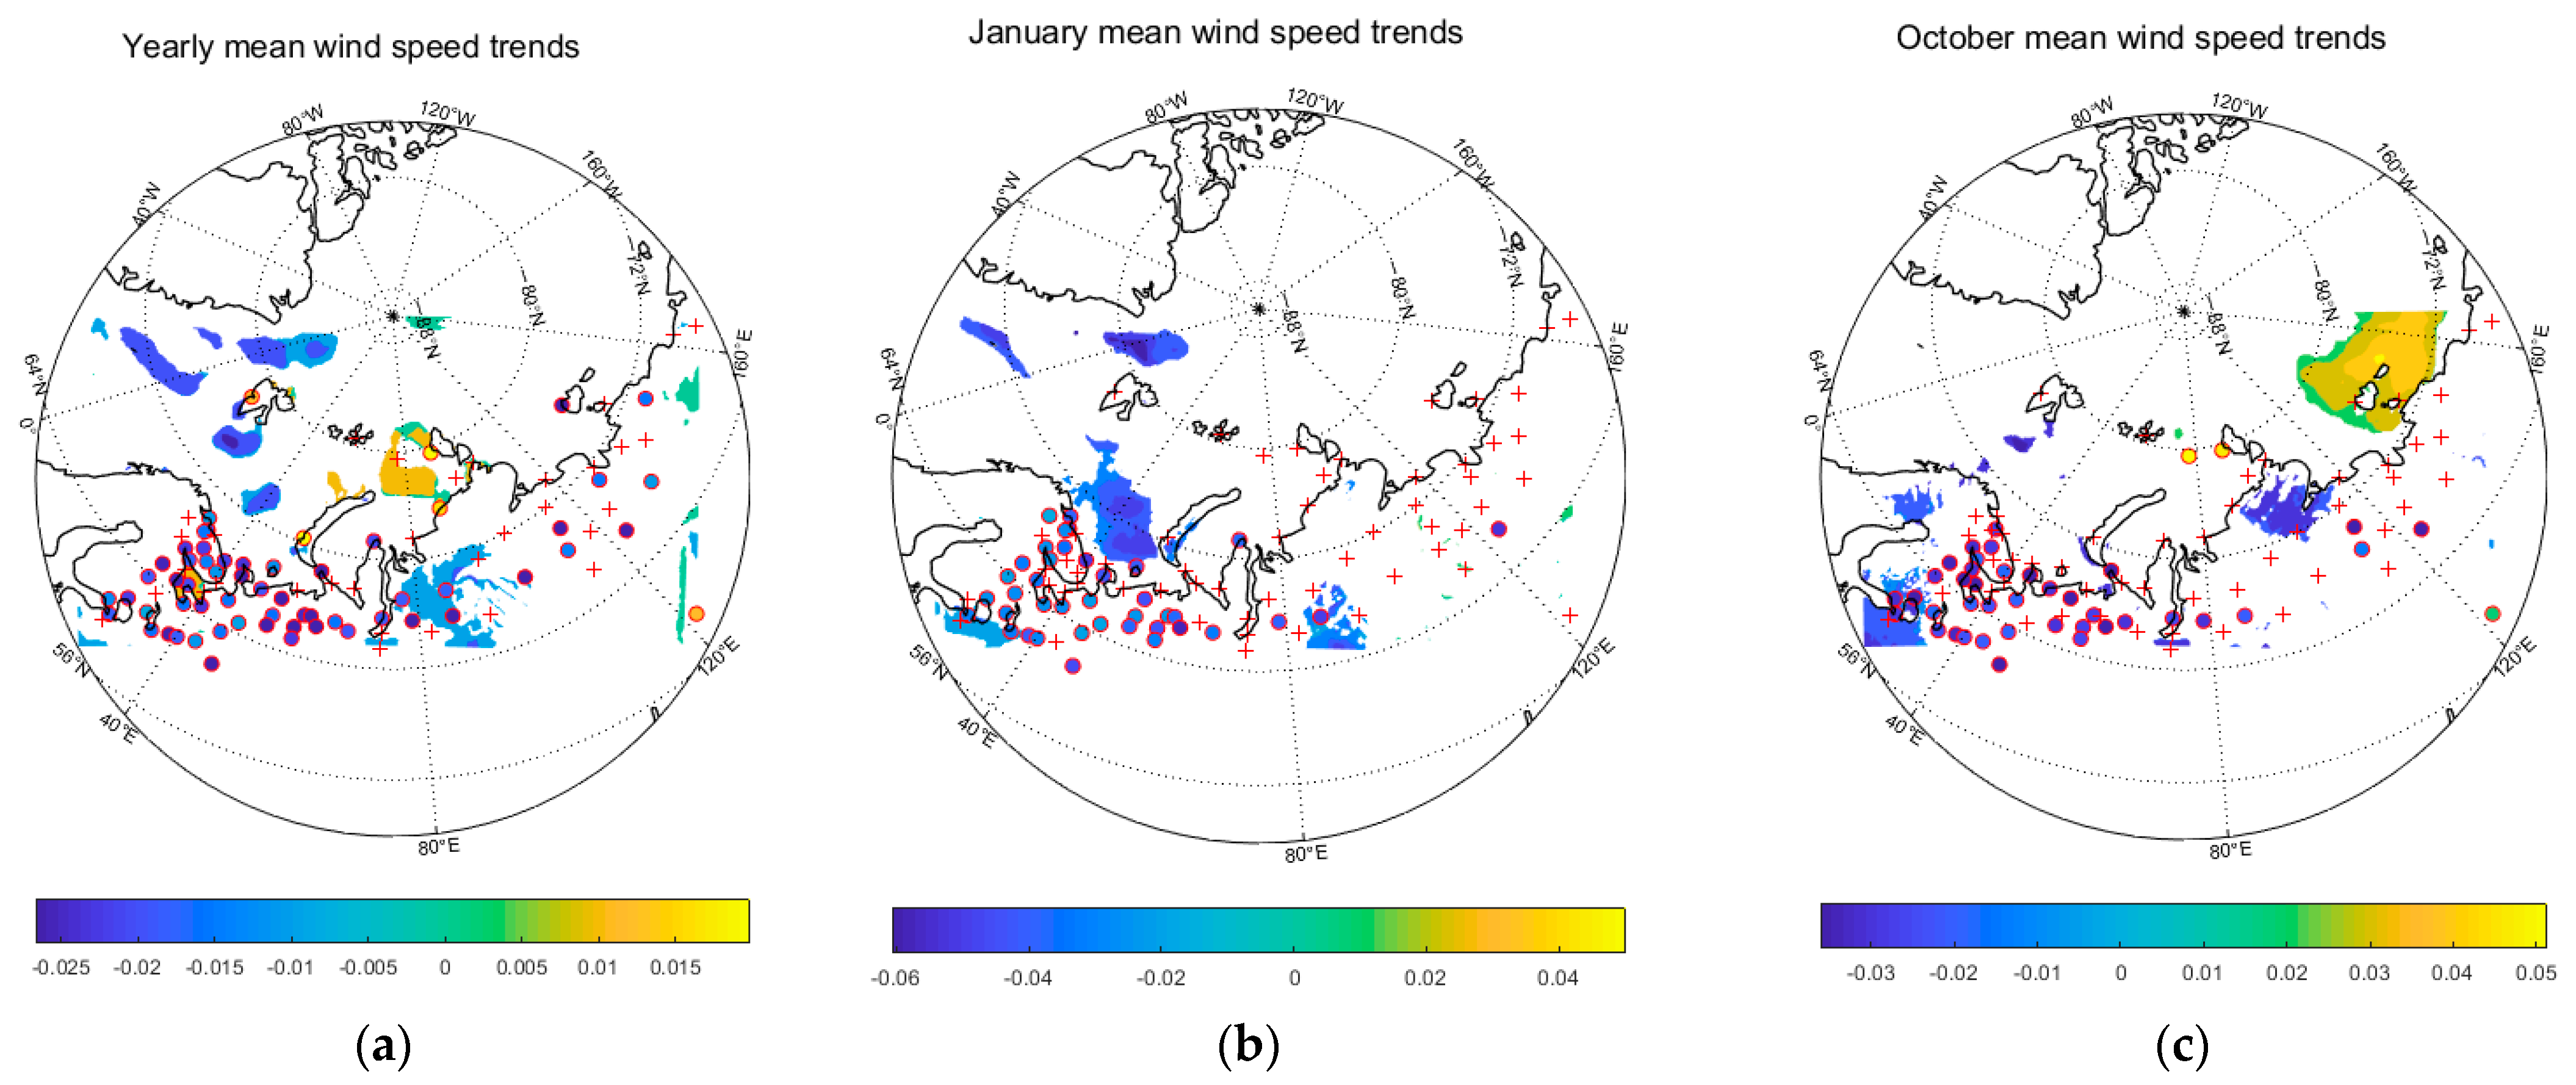
3.1. Mean Wind Speed

The hindcast data showed significant positive mean wind speed trends (up to 0.4 m/s over 36 years; Figure 2a) over the north of the Kara Sea (i.e., in one of the regions most affected by sea ice decline). Other highlighted areas included the area west from the Novaya Zemlya islands, and the White Sea. Significant negative trends covered the northern Atlantic, central Barents Sea, Gyda peninsula, and central Evenkia (up to −0.8 m/s over 36 years). It should be noted that the dataset benefited from the good coincidence of having stations located in regions where it is possible to compare trends. Exceptions are found, however, with data from stations featuring negative trends in northern Sakha and north-western Russia that are not significantly aligned with model trends. In January (Figure 2b), there were significant negative trends only (up to −1.5 m/s over 36 years) over the Barents Sea, Fram strait, northern Atlantic, and central Evenkia, which were confirmed by data from the stations. For April, the model did not capture any significant trends based on the data from the stations, which are mostly located over the north-west of Russia. Negative trends in July were observed over polar regions north of the Kara and Laptev Seas, and the Greenland and Pechora seacoasts (up to 1.5 m/s over 36 years). Slight positive trends were observed over the Gulf of Finland and White Sea (up to 1 m/s over 36 years). In October (Figure 2c), there was a large area of positive trends over the East Siberian Sea (up to 1 m/s over 36 years), and negative trends over Scandinavia, the western Barents Sea, and Taymyr peninsula (up to −1 m/s over 36 years).

3.2. Extreme Wind Speed

Maximal wind speed and the largest quantiles have similar patterns. According to the hindcast, yearly wind speed maxima have sporadic small areas of significant trends. At the same time, stations showing positive trends are located over the western coasts, but the rest display slightly negative trends. Interestingly, there are no significant trends at Malye Karmakuly, Tiksi, and Teriberka, which are well known for their high wind speed climatology. In terms of specific months, the most interesting 0.99 quantile pattern is observed for January (Figure 3a), with significant negative trends over the Barents Sea, northern Atlantic, and some polar regions (up to −2.5 m/s over 36 years), and positive trends over western Sakha and eastern Evenkia (up to 2 m/s over 36 years). There was a notable increase in maximal wind speed in July over the Gyda and Yamal coasts of the Kara Sea (up to 3 m/s over 36 years) (Figure 3b); however, this was not supported by data from the stations, with significant positive trends observed at Teriberka. The 0.95 quantile pattern for October resembles the abovementioned pattern for mean wind speed (Figure 3c), with values up to −2 m/s and 3 m/s over 36 years.

3.3. Wind Speed Occurrences

Trends of wind speed occurrences became partly restricted due to small values on yearly and even more monthly scales. Therefore, many areas became insignificant or showed an absence of trends according to the hindcast. For the most extreme wind speed thresholds, 30 and 33 m/s, there were no stations and hindcast grid points with significant trends of occurrence. For the 20 m/s threshold, yearly occurrence showed slightly positive trends over the northern Barents Sea and negative trends over a small part of the north Atlantic. According to data from the stations, there were no significant positive trends, but negative trends were indicated at Tiksi, im. Popova, GMO im. Krenkelya, and some other locations. Trends at Tiksi remained significant up to the 33 m/s threshold. In specific months, there were significant negative trends over the central Barents Sea and northern Atlantic for the 20 and 25 m/s thresholds.

3.4. Discussion

Considering the differences in trend values and signs according to the hindcast and the data from the stations, we will evaluate the model’s capability to capture climate change-related shifts in real wind speed according to spatial resolution. It should be noted that significant negative trends recorded by stations on continents tend to always be significant according to hindcast. However, if the trends are both significant, the order of the values and signs tend to match. Regarding positive trends, they are usually, on the contrary, overestimated by the hindcast. Moreover, in this study, we were unable to accurately estimate or reproduce the wind speed climatology over the sea areas without data from stations available.

4. Conclusions

In summarizing the presented patterns for wind speed trends, we can conclude that there were prevailing negative trends for mean and maximal wind speed over the Barents Sea and northern Atlantic during most of the year, especially in January. At the same time, there were significant increases in the mean wind speed and extreme quantiles for the Kara Sea and its coastlines, as well as the White Sea and Gulf of Finland, especially in July. Significant maximal wind speed growth over the East Siberian Sea was observed in October. On the continents, there was a significant decrease in wind speed over Taymyr and western Evenkia, and an increase in extreme wind speed observed in northern Sakha in January. Generally, the COSMO-CLM Russian Arctic hindcast is relevant for the estimation of observed surface wind speed trends in the Russian Arctic, including extremes. It is specifically important for sea areas, which are not covered by observations from stations.
Finally, the COSMO-CLM Russian Arctic hindcast could be applied in future for assessments of diurnal wind speed cycles, satellite climatology estimations over the Russian Arctic, statistical evaluations of severe and extreme events (polar lows, downslope windstorms, marine cold air outbreaks, etc.), and quality of wind speed reproduction based on other datasets (e.g., ERA5, NORA3, CARRA, etc.).

Author Contributions

Conceptualization: V.P.; methodology: V.P.; validation: V.P., F.K. and A.B.; formal analysis: V.P., F.K. and A.B.; investigation: V.P.; data curation: F.K. and A.B.; writing—original draft preparation: V.P.; writing—review and editing: V.P.; visualization: V.P. and F.K.; supervision: V.P.; project administration: V.P.; funding acquisition: V.P. All authors have read and agreed to the published version of the manuscript.

Funding

This research was funded by the Lomonosov Moscow State University state project no. 121051400081-7.

Institutional Review Board Statement

Not applicable.

Informed Consent Statement

Not applicable.

Data Availability Statement

The “COSMO-CLM Russian Arctic” hindcast data are openly available in the Figshare repository at [https://doi.org/10.6084/m9.figshare.c.5186714] (accessed on 8 January 2024), [https://figshare.com/collections/Arctic_COSMO-CLM_reanalysis_all_years/5186714] (accessed on 8 January 2024), reference number [5186714].

Acknowledgments

This research was performed according to the Development Program of the Interdisciplinary Scientific and Educational School of M.V. Lomonosov Moscow State University «Future Planet and Global Environmental Change».

Conflicts of Interest

The authors declare no conflict of interest.

References

  1. Screen, J.A.; Deser, C.; Simmonds, I. Local and remote controls on observed Arctic warming. Geophys. Res. Lett. 2012, 39, 10. [Google Scholar] [CrossRef]
  2. Serreze, M.C.; Barrett, A.P.; Stroeve, J.C.; Kindig, D.M.; Holland, M.M. The emergence of surface-based Arctic amplification. Cryosphere 2009, 3, 11–19. [Google Scholar] [CrossRef]
  3. IPCC. Climate Change 2021: The Physical Science Basis. Contribution of Working Group I to the Sixth Assessment Report of the Intergovernmental Panel on Climate Change; Masson-Delmotte, V., Zhai, P., Pirani, A., Connors, S.L., Péan, C., Berger, S., Caud, N., Chen, Y., Goldfarb, L., Gomis, M.I., Huang, M., Leitzell, K., Lonnoy, E., Matthews, J.B.R., Maycock, T.K., Waterfield, T., Yelekçi, O., Yu, R., Zhou, B., Eds.; Cambridge University Press: Cambridge, UK; New York, NY, USA, 2021; p. 2391. [Google Scholar] [CrossRef]
  4. Bekryaev, R.V.; Polyakov, I.V.; Alexeev, V.A. Role of polar amplification in long-term surface air temperature variations and modern Arctic warming. J. Clim. 2010, 23, 3888–3906. [Google Scholar] [CrossRef]
  5. Stroeve, J.C.; Serreze, M.C.; Holland, M.M.; Kay, J.E.; Malanik, J.; Barrett, A.P. The Arctic’s rapidly shrinking sea ice cover: A research synthesis. Clim. Chang. 2011, 110, 1005–1027. [Google Scholar] [CrossRef]
  6. Brennan, M.K.; Hakim, G.J.; Blanchard-Wrigglesworth, E. Arctic Sea-Ice Variability During the Instrumental Era. Geophys. Res. Lett. 2020, 47, 7. [Google Scholar] [CrossRef]
  7. Walsh, J.E.; Fetterer, F.; Scott Stewart, J.; Chapman, W.L. A database for depicting Arctic sea ice variations back to 1850. Geogr. Rev. 2017, 107, 89–107. [Google Scholar] [CrossRef]
  8. Maksym, T. Arctic and Antarctic Sea Ice Change: Contrasts, Commonalities, and Causes. Annu. Rev. Mar. Sci. 2019, 11, 187–213. [Google Scholar] [CrossRef]
  9. Barnes, E.A. Revisiting the evidence linking Arctic amplification to extreme weather in midlatitudes. Geophys. Res. Lett. 2013, 40, 4734–4739. [Google Scholar] [CrossRef]
  10. Francis, J.A.; Vavrus, S.J. Evidence linking Arctic amplification to extreme weather in mid-latitudes. Geophys. Res. Lett. 2012, 39, 6. [Google Scholar] [CrossRef]
  11. Bliss, A.C.; Miller, J.A.; Meier, W.N. Comparison of passive microwave-derived early melt onset records on Arctic sea ice. Remote. Sens. 2017, 9, 199. [Google Scholar] [CrossRef]
  12. Parkinson, C.L. Spatially mapped reductions in the length of the Arctic sea ice season. Geophys. Res. Lett. 2014, 41, 4316–4322. [Google Scholar] [CrossRef] [PubMed]
  13. Peng, X. Spatiotemporal changes in active layer thickness under contemporary and projected climate in the Northern Hemisphere. J. Clim. 2018, 31, 251–266. [Google Scholar] [CrossRef]
  14. Smirnova, J.E.; Golubkin, P.A.; Bobylev, L.P.; Zabolotskikh, E.V.; Chapron, B. Polar low climatology over the Nordic and Barents seas based on satellite passive microwave data. Geophys. Res. Lett. 2015, 42, 5603–5609. [Google Scholar] [CrossRef]
  15. Zahn, M.; von Storch, H. A long-term climatology of North Atlantic polar lows. Geophys. Res. Lett. 2008, 35, L22702. [Google Scholar] [CrossRef]
  16. LaffiLaffineur, T.; Claud, C.; Chaboureau, J.-P.; Noer, G. Polar lows over the Nordic seas: Improved representation in ERA-Interim compared to ERA-40 and the impact on downscaled simulations. Mon. Weather. Rev. 2014, 142, 2271–2289. [Google Scholar] [CrossRef]
  17. Noer, G.; Saetra, Ø.; Lien, T.; Gusdal, Y. A climatological study of polar lows in the Nordic Seas. Q. J. R. Meteorol. Soc. 2011, 137, 1762–1772. [Google Scholar] [CrossRef]
  18. Overland, J.E.; Wang, M. Large scale atmospheric circulation changes are associated with the recent loss of Arctic sea ice. Tellus A 2010, 62, 1–9. [Google Scholar] [CrossRef]
  19. Ivanov, V.; Alexeev, V.; Koldunov, N.V.; Repina, I.; Sandø, A.B.; Smedsrud, L.H.; Smirnov, A. Arctic Ocean heat impact on regional ice decay—A suggested positive feedback. J. Phys. Oceanogr. 2015, 46, 1437–1456. [Google Scholar] [CrossRef]
  20. Zabolotskikh, E.V.; Gurvich, I.A.; Chapron, B. New areas of polar lows over the Arctic as a result of the decrease in sea ice extent. Atmos. Ocean. Phys. 2015, 51, 1021–1033. [Google Scholar] [CrossRef]
  21. Hall, R.; Erdélyi, R.; Hanna, E.; Jones, J.M.; Scaife, A.A. Drivers of North Atlantic polar front jet stream variability. Int. J. Clim. 2015, 35, 1697–1720. [Google Scholar] [CrossRef]
  22. Moore, G.W.K.; Renfrew, I.A. Tip jets and barrier winds: A QuikSCAT climatology of high wind speed events around Greenland. J. Clim. 2005, 18, 3713–3725. [Google Scholar] [CrossRef]
  23. Shestakova, A.A.; Myslenkov, S.A.; Kuznetsova, A.M. Influence of Novaya Zemlya Bora on Sea Waves: Satellite Measurements and Numerical Modeling. Atmosphere 2020, 11, 726. [Google Scholar] [CrossRef]
  24. Christakos, K.; Furevik, B.R.; Aarnes, O.J.; Breivik, Ø.; Tuomi, L.; Byrkjedal, Ø. The importance of wind forcing in fjord wave modelling. Ocean Dyn. 2020, 70, 57–75. [Google Scholar] [CrossRef]
  25. Gutjahr, O.; Heinemann, G. A model-based comparison of extreme winds in the Arctic and around Greenland. Int. J. Clim. 2018, 38, 5272–5292. [Google Scholar] [CrossRef]
  26. Shestakova, A.A.; Toropov, P.A.; Matveeva, T.A. Climatology of extreme downslope windstorms in the Russian Arctic. Weather. Clim. Extremes 2020, 28, 100256. [Google Scholar] [CrossRef]
  27. Willmes, S.; Heinemann, G.; Schnaase, F. Patterns of wintertime Arctic sea-ice leads and their relation to winds and ocean currents. Cryosphere 2023, 17, 3291–3308. [Google Scholar] [CrossRef]
  28. Casas-Prat, M.; Wang, X.L. Sea ice retreat contributes to projected increases in extreme Arctic ocean surface waves. Geophys. Res. Lett. 2020, 47, 15. [Google Scholar] [CrossRef]
  29. Myslenkov, S.; Platonov, V.; Kislov, A.; Silvestrova, K.; Medvedev, I. Thirty-nine-year wave hindcast, storm activity, and probability analysis of storm waves in the Kara Sea, Russia. Water 2021, 13, 648. [Google Scholar] [CrossRef]
  30. Platonov, V.; Varentsov, M. Introducing a New Detailed Long-Term COSMO-CLM Hindcast for the Russian Arctic and the First Results of Its Evaluation. Atmosphere 2021, 12, 350. [Google Scholar] [CrossRef]
  31. Platonov, V.; Varentsov, M. Creation of the long-term high-resolution hydrometeorological archive for Russian Arctic: Methodology and first results. In IOP Conference Series: Earth and Environmental Science; IOP Publishing: Bristol, UK, 2019; Volume 386. [Google Scholar] [CrossRef]
  32. Platonov, V.; Varentsov, M. A new detailed long-term hydrometeorological dataset: First results of extreme characteristics estimations for the Russian Arctic seas. In IOP Conference Series: Earth and Environmental Science; IOP Publishing: Bristol, UK, 2020; Volume 611. [Google Scholar] [CrossRef]
  33. Data from the COSMO-CLM Russian Arctic Hindcast Archive, Figshare Repository. Available online: https://figshare.com/collections/Arctic_COSMO-CLM_reanalysis_all_years/5186714 (accessed on 10 September 2023).
  34. Platonov, V.; Boiko, A. COSMO-CLM Russian Arctic hindcast, 1980–2016: Surface wind speed evaluation and future perspectives. Environ. Sci. Proc. 2022, 19, 39. [Google Scholar] [CrossRef]
  35. Russian Research Institute for Hydrometeorological Information—World Data Center. Available online: http://aisori-m.meteo.ru/ (accessed on 10 September 2023).
Figure 1. The COSMO-CLM Russian Arctic hindcast area [30] (a), and the weather stations used in this study (b).
Environsciproc 27 00006 g001
Figure 2. Trends (m s−1 per year/month) in yearly (a), January (b), and October (c) mean wind speed. Significant trends in the hindcast are shown based on color; stations with significant trends are displayed in circles with the same color; stations with insignificant trends are displayed as crosses.
Environsciproc 27 00006 g002
Figure 3. Trends (m s−1 per year/month) for January 0.99 quantile (a), July maximal wind speed (b), and October 0.99 quantile (c). Significant trends in the hindcast are shown based on color; stations with significant trends are displayed in circles with the same color; stations with insignificant trends are displayed as crosses.
Environsciproc 27 00006 g003
Disclaimer/Publisher’s Note: The statements, opinions and data contained in all publications are solely those of the individual author(s) and contributor(s) and not of MDPI and/or the editor(s). MDPI and/or the editor(s) disclaim responsibility for any injury to people or property resulting from any ideas, methods, instructions or products referred to in the content.

