Proceeding Paper

Analysis of Optical Properties and Radiative Forcing of Different Aerosol Types in Wuhan †

College of New Energy and Materials, Northeast Petroleum University, Daqing 163318, China
Presented at the 6th International Electronic Conference on Atmospheric Sciences, 15–30 October 2023; Available online: https://ecas2023.sciforum.net/.
Environ. Sci. Proc. 2023, 27(1), 31; https://doi.org/10.3390/ecas2023-16347
Published: 27 November 2023
(This article belongs to the Proceedings of The 6th International Electronic Conference on Atmospheric Sciences)

Abstract

:
The optical and radiative properties of aerosols are governed by their types. In this paper, the optical and radiative properties of different aerosol types in Wuhan, China, have been inverted and investigated using the collected PM2.5 samples. The results show that PM2.5 (average mass concentration about 31.25 μg/m3) is mainly contributed by sulfate (SO4) and organic carbon (OC) (22% and 52%, respectively), while aerosol optical depth (AOD, average about 0.28) is mainly contributed by SO4 and black carbon (EC) (22% and 19%, respectively). SO4 and nitrate (NO3) have a negative radiative forcing at the top of the atmosphere (TOA) and a cooling effect, while OC and EC have a positive radiative forcing and a heating effect. Moreover, EC has the most significant effect on the radiative forcing in Wuhan, contributing up to 61% and 73% at the bottom of the atmosphere (BOA) and atmosphere (ATM), respectively, while contributing up to 75% to the atmospheric heating rate (about 1~2 K/day).

1. Introduction

Aerosols are one of the most influential factors in the Earth system, as an important component of the atmosphere. Aerosols affect the Earth’s energy balance via direct and indirect radiative effects, the direct radiative effect being due to the aerosol absorption and scattering of solar radiation, and the indirect radiative effect coming from the fact that aerosols act as cloud condensation nuclei changing the life cycle and physical properties of clouds [1]. Additionally, aerosols can affect human health as respirable particulate matter and reduce visibility in highly polluted regions [2]. However, these effects are usually highly uncertain because aerosols are much more varied in composition and much more heterogeneous in spatial and temporal distributions than greenhouse gases, and there is still a lack of sufficient aerosol information at larger spatial and temporal scales [3].
For decades, recognition of this fact has motivated tremendous efforts, and a great number of in situ measurements and optical remote sensing works have provided valid information on the optical and microphysical properties of aerosols, which have contributed to reducing the uncertainty of aerosols in the global and regional climate system [4,5]. Based on a large number of observation data, various aerosol classification methods have been developed to assess the global and regional distribution characteristics of aerosols in order to improve the level of understanding of aerosols. For example, using a combination of aerosol optical depth (AOD) and Angstrom exponent (AE) index to achieve aerosol classification, or combining AE with single scattering albedo (SSA), as well as using parameters such as AROD [6,7,8]. Moreover, numerous studies have discussed in depth the components and sources of regional aerosols. Hammer et al. have assessed the trends in global particulate matter concentrations using methods such as satellites and modeling [4]. Studies in China, India, and Europe have also revealed sources and drivers of particulate matter at smaller spatial scales [9,10,11]. Source analysis of aerosols in Beijing and Wuhan reveals the dominant influence of traffic and industrial emissions [2,12,13,14,15]. Studies have shown that different aerosol types may have different or even opposite radiative effects [16,17,18]. Therefore, improving the level of understanding of the optical properties and radiative effects of different aerosol types can effectively limit the aerosol direct and indirect radiative forcing and enhance the accuracy of the assessment of aerosol environmental and climate effects.
Wuhan is a major city in central China with more serious pollution and higher aerosol loading. It is mainly attributed to the rapidly growing industry and the consequent increase in energy consumption in Wuhan. The high ambient humidity and stable planetary boundary layer also limit the pollutant dispersion, which further increases the aerosol loading. Although considerable studies have investigated the composition, sources, and distribution of aerosols in Wuhan, the aerosol radiative effect depends more on the combined contribution of multiple aerosol types, and up to now, there are no relevant studies involving the radiative effects of different aerosol types and their relative contributions in Wuhan [2,13,14,15]. In this study, an in situ measurement experiment of atmospheric aerosols is carried out in Wuhan. The mass concentrations (MC) of different aerosol types are investigated and analyzed by the collected PM2.5 samples, and the radiative forcing and atmospheric heating rates of aerosol types are subsequently simulated and discussed based on the inverted aerosol optical properties. This paper aims to reveal the radiative properties of different aerosol types in Wuhan and to limit the uncertainty of aerosol properties and radiative forcing in Wuhan.

2. Materials and Methods

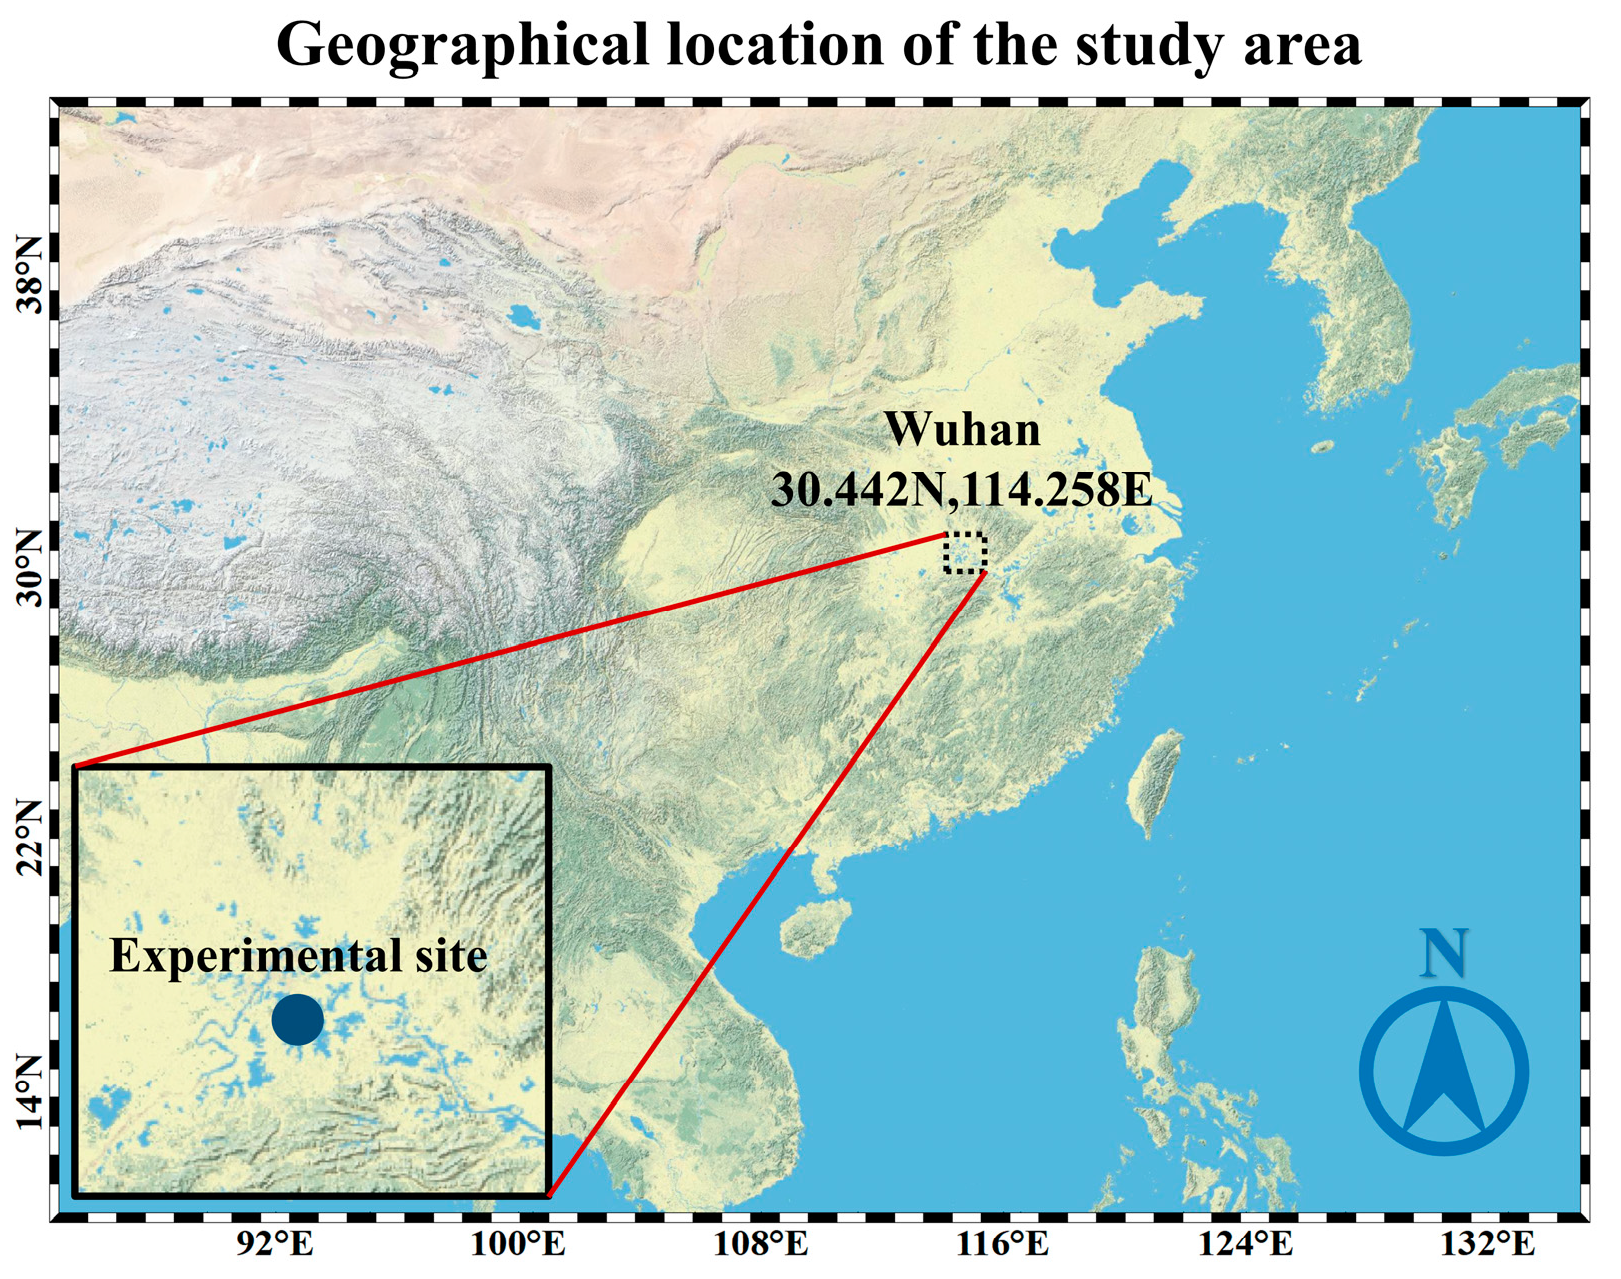
2.1. In Situ Measurement of Aerosols

The sampling site is located at Baishazhou Avenue in Wuhan, China, as shown in Figure 1. With a total population of about 17 million, developed industry, and high car ownership, the aerosols over Wuhan are mainly from various anthropogenic sources. In this study, nine sets (days) of PM2.5 data collected during 2021 are used, with a sampling duration of 20 h or 24 h. The equipment and operation of the experiment are described in detail in the earlier study [19], and the sampling results are shown in Figure 2. The results show that the MC of PM2.5 ranges from 26~37 μg/m3, with mean values of about 31.25 μg/m3, and SO42− and NO3 range from 0.463~1.04 μg/m3 and 5.015~8.19 μg/m3, with mean values of about 6.94 μg/m3 and 0.67 μg/m3, respectively. The MC of organic carbon (OC) and elemental carbon (EC) range from 9.22~16.31 μg/m3 and 0.95~2.03 μg/m3, with mean values of about 11.82 μg/m3 and 1.63 μg/m3, respectively. PM2.5 is mainly contributed by SO4 and OC, accounting for about 22% and 52%, respectively. Several studies show that water-soluble ions such as SO42− and NO3− in Wuhan mainly originate from vehicle exhaust emissions and organic matter combustion, while EC mainly comes from industrial production and coal-fired heating. In addition, the burning of straw in the surrounding countryside is also one of the main sources of EC, while OC comes more from the incomplete combustion of biomass and fossil fuels [14,15].

2.2. Aerosol Optical Properties

In this study, the Optical Properties of Aerosols and Clouds (OPAC) model is used to implement the calculation of aerosol optical properties [20]. This package provides aerosol optical properties at 61 wavelengths between 0.3 µm and 40 µm and 8 relative humidities and is widely used for the calculation and inversion of the optical properties of mixed aerosols with multiple components. The core idea of the inversion is to calculate the AOD by inputting the number density of aerosols and matching it with the observation data. Specifically, the corresponding number densities are first calculated from the MC of the different aerosol types obtained using sampling. Subsequently, parameters such as number density, height profile, and relative humidity are input into the OPAC program, and the aerosol optical properties such as AOD, SSA, and asymmetry factor (ASY) are calculated and recorded. Finally, the AOD is compared with the observation data, and if the relative error is less than 10%, the aerosol optical properties are retained; otherwise, the parameters are adjusted and recalculated. The AOD used for comparison is the MODIS Aerosol Product from the Level 2 (MOD 04) data (Dark Target algorithm) at 500 nm.

2.3. Aerosol Radiation Forcing

Subsequently, the radiative forcing of different aerosol types in Wuhan is simulated using the vector radiative transfer model developed in the previous study [21], and the simulation results are compared and verified using the SBDART (Santa Barbara DISORT Atmospheric Radiative Transfer model) model. The SBDART model is developed based on the discrete coordinate method and the LOWTRAN7 model to deal with various radiative transfer problems in atmospheric energy balance studies [22]. The radiative fluxes at the top of the atmosphere (TOA) and bottom of the atmosphere (BOA) affected by different aerosol types are calculated by aerosol optical properties and radiative transfer model with short-wave radiation at wavelengths of 0.4–3 μm, atmospheric profiles set to mid-latitude summer model, and surface albedo, water vapor concentration and ozone concentration of 0.2, 1.19 g/cm2 and 0.406 ppm, respectively. Radiative forcing is defined in terms of changes in the net radiative flux due to variations in the atmospheric medium or other climatic perturbations; according to the radiative flux results from the SBDART model, the aerosol direct radiative forcing is calculated as follows,
F = F F ,
F a e r o s o l A T M = F a e r o s o l T O A F c l e a r T O A F a e r o s o l B O A F c l e a r B O A ,
where represents the difference in radiation flux, the subscripts aerosol and clear represent the case with and without aerosol, respectively, and ATM represents atmospheric absorption. Further, according to the aerosol radiative forcing, the atmospheric heating rate can be calculated as follows,
d T / d t = ( 1 / ρ c p ) · ( d Δ F a e r o s o l / d z ) ,
where c p represents the constant pressure-specific heat capacity with the value of 1004.67   J k g 1 K 1 , ρ is the air density varying with pressure, z is the altitude, and the atmospheric heating rate d T / d t is in K / d a y .

3. Results and Discussion

The AOD inversion results of different aerosol types at a wavelength of 500 nm are shown in Figure 3a. The results show that the total aerosol AOD during the test period ranges from 0.19 to 0.39, with an average of about 0.28. The average AOD of SO4, NO3, OC, and EC are 0.062, 0.008, 0.023, and 0.052, respectively, which account for about 22%, 3%, 8%, and 19% of the total AOD, with SO4 being the highest and NO3 the lowest. It can also be found that SO4/NO3 does not differ much in MC and AOD, ranging from about 5 to 15, respectively, indicating that the optical properties and radiative effects of these two aerosols are similar. However, OC/EC in AOD (0.3–0.8) is much smaller than MC (6–10), which indicates that EC plays a greater role in the radiation effect.
The SSA and ASY of aerosols at different dates are shown in Figure 3b. The results show that the aerosol optical properties change with date, which is due to the change of different aerosol types in the mixed aerosol. From April to May, SSA shows an increasing trend, while ASY shows a decrease. Similar changes have been reported in several studies, with enhanced scattering (decreased absorption) and some decrease in the size of aerosols from spring to summer in Wuhan [23]. However, the optical properties of different aerosol types do not vary much, and the SSA (ASY) of SO4, NO3, OC, and EC are about 0.98 (0.65), 0.99 (0.65), 0.83 (0.75), and 0.42 (0.35), respectively. SO4 and NO3 have the strongest scattering properties, while EC has the strongest absorption properties, and its size is also the smallest.
The results of the radiative forcing simulations for different aerosol types, including TOA, BOA, and ATM, are given in Figure 4a–c. The results show that the aerosol radiative forcing at TOA ranges from about 8~14 W/m2 with an average of about 10 W/m2, while at BOA and ATM ranges from about −25~−55 W/m2 and 30~70 W/m2 (average of about −40 and 50 W/m2), respectively. The radiative forcing of different aerosol types differs significantly. SO4 and NO3 have negative radiative forcing in TOA (about −1~−2 W/m2 and 0~−1 W/m2), indicating a cooling effect on the Earth system by reflecting solar radiation, while OC and EC have positive radiative forcing in TOA, showing a heating effect. Among all aerosol types, EC has the most significant contribution, not only with the largest positive radiative forcing at TOA (6~18 W/m2) but also up to 61% and 73% at BOA and ATM, respectively (10~35 W/m2 and 15~55 W/m2, respectively), reflecting an extremely strong absorption of radiation. However, the effect of OC, which also plays a heating effect, is much smaller (0~3 W/m2 at TOA).

Funding

This research was funded by the National Natural Science Foundation of China (No. 51876147).

Institutional Review Board Statement

Not applicable.

Informed Consent Statement

Not applicable.

Data Availability Statement

The data of this work are freely available from the authors.

Acknowledgments

We acknowledge NASA’s MODIS data. Moreover, an acknowledgment is made to the editors and referees who made important comments to improve this paper.

Conflicts of Interest

The author declares no conflicts of interest.

References

  1. Climate Change 2014, Synthesis Report, Summary for Policymakers. Available online: https://www.ipcc.ch/pdf/assessment-report/ar5/syr/AR5_SYR_FINAL_SPM.pdf (accessed on 21 April 2022).
  2. Hui, L.; Liu, X.; Tan, Q.; Feng, M.; An, J.; Qu, Y.; Zhang, N.; Cheng, N. VOC characteristics, sources and contributions to SOA formation during haze events in Wuhan, Central China. Sci. Total. Environ. 2019, 650, 2624–2639. [Google Scholar] [CrossRef] [PubMed]
  3. Bellouin, N.; Quaas, J.; Gryspeerdt, E.; Kinne, S.; Stier, P.; Watson-Parris, D.; Boucher, O.; Carslaw, K.S.; Christensen, M.; Daniau, A.L.; et al. Bounding global aerosol radiative forcing of climate change. Rev. Geophys. 2020, 58, e2019RG000660. [Google Scholar] [CrossRef] [PubMed]
  4. Hammer, M.S.; Donkelaar, A.; Li, C.; Lyapustin, A.; Sayer, A.M.; Hsu, N.C.; Levy, R.C.; Garay, M.J.; Kalashnikova, O.V.; Kahn, R.A.; et al. Global estimates and long-term trends of fine particulate matter concentrations (1998–2018). Environ. Sci. Technol. 2020, 54, 7879–7890. [Google Scholar] [CrossRef]
  5. Xia, X.; Che, H.; Shi, H.; Chen, H.; Zhang, X.; Wang, P.; Goloub, P.; Holben, B. Advances in sunphotometer-measured aerosol optical properties and related topics in China: Impetus and perspectives. Atmos. Res. 2021, 249, 105286. [Google Scholar] [CrossRef] [PubMed]
  6. Pathak, B.; Bhuyan, P.K.; Gogoi, M.; Bhuyan, K. Seasonal Heterogeneity in Aerosol Types Over Dibrugarh-north-eastern India. Atmos. Environ. 2012, 47, 307–315. [Google Scholar] [CrossRef]
  7. Choi, Y.; Ghim, Y.S.; Holben, B.N. Identification of Columnar Aerosol Types Under High Aerosol Optical Depth Conditions for a Single Aeronet Site in Korea. J. Geophys. Res.-Atmos. 2016, 121, 1264–1277. [Google Scholar] [CrossRef]
  8. Mao, Q.; Huang, C.; Chen, Q.; Zhang, H.; Yuan, Y. Satellite-based identification of aerosol particle species using a 2D-space aerosol classification model. Atmos. Environ. 2019, 219, 117057. [Google Scholar] [CrossRef]
  9. Li, K.; Jacob, D.J.; Liao, H.; Zhu, J.; Shah, V.; Shen, L.; Bates, K.H.; Zhang, Q.; Zhai, S. A two-pollutant strategy for improving ozone and particulate air quality in China. Nat. Geosci. 2019, 12, 906–910. [Google Scholar] [CrossRef]
  10. Jain, S.; Sharma, S.K.; Vijayan, N.; Mandal, T.K. Seasonal characteristics of aerosols (PM2.5 and PM10) and their source apportionment using PMF: A four year study over Delhi, India. Environ. Pollut. 2020, 262, 114337. [Google Scholar] [CrossRef]
  11. Daellenbach, K.R.; Uzu, G.; Jiang, J.; Cassagnes, L.E.; Leni, Z.; Vlachou, A.; Stefenelli, G.; Canonaco, F.; Weber, S.; Segers, A.; et al. Sources of particulate-matter air pollution and its oxidative potential in Europe. Nature 2020, 587, 414–419. [Google Scholar] [CrossRef]
  12. Chang, X.; Wang, S.; Zhao, B.; Xing, J.; Liu, X.; Wei, L.; Song, Y.; Wu, W.; Cai, S.; Zheng, H.; et al. Contributions of inter-city and regional transport to PM2.5 concentrations in the Beijing-Tianjin-Hebei region and its implications on regional joint air pollution control. Sci. Total. Environ. 2019, 660, 1191–1200. [Google Scholar] [CrossRef] [PubMed]
  13. Zheng, H.; Kong, S.; Chen, N.; Yan, Y.; Liu, D.; Zhu, B.; Xu, K.; Cao, W.; Ding, Q.; Lan, B.; et al. Significant changes in the chemical compositions and sources of PM2.5 in Wuhan since the city lockdown as COVID-19. Sci. Total. Environ. 2020, 739, 140000. [Google Scholar] [CrossRef] [PubMed]
  14. Huang, F.; Zhou, J.; Chen, N.; Li, Y.; Li, K.; Wu, S. Chemical characteristics and source apportionment of PM2.5 in Wuhan, China. J. Atmos. Chem. 2019, 76, 245–262. [Google Scholar] [CrossRef]
  15. Liao, W.; Zhou, J.; Zhu, S.; Xiao, A.; Li, K.; Schauer, J.J. Characterization of aerosol chemical composition and the reconstruction of light extinction coefficients during winter in Wuhan, China. Chemosphere 2020, 241, 125033. [Google Scholar] [CrossRef] [PubMed]
  16. Srivastava, A.K.; Mehrotra, B.J.; Singh, A.; Singh, V.; Bisht, D.S.; Tiwari, S.; Srivastava, M.K. Implications of different aerosol species to direct radiative forcing and atmospheric heating rate. Atmos. Environ. 2020, 241, 117820. [Google Scholar] [CrossRef]
  17. Ramachandran, S.; Srivastava, R. Mixing states of aerosols over four environmentally distinct atmospheric regimes in Asia: Coastal, urban, and industrial locations influenced by dust. Environ. Sci. Pollut. R. 2016, 23, 11109–11128. [Google Scholar] [CrossRef] [PubMed]
  18. Zhao, H.; Che, H.; Xia, X.; Wang, Y.; Wang, H.; Wang, P.; Ma, Y.; Yang, H.; Liu, Y.; Wang, Y.; et al. Multiyear Ground-Based Measurements of Aerosol Optical Properties and Direct Radiative Effect Over Different Surface Types in Northeastern China. J. Geophys. Res.-Atmos. 2018, 123, 13887–13916. [Google Scholar] [CrossRef]
  19. Mao, Q.; Cheng, F.; Chen, M. Experimental Study on the Chemical Characterization of Atmospheric Aerosols in Wuhan, China. Atmosphere 2021, 12, 1393. [Google Scholar] [CrossRef]
  20. Hess, M.; Koepke, P.; Schult, I. Optical properties of aerosols and clouds: The software package OPAC. B Am. Meteorol. Soc. 1998, 79, 831–844. [Google Scholar] [CrossRef]
  21. Mao, Q.; Nie, X. Polarization performance of a polydisperse aerosol atmosphere based on vector radiative transfer model. Atmos. Environ. 2022, 277, 119079. [Google Scholar] [CrossRef]
  22. Ricchiazzi, P.; Yang, S.; Gautier, C.; Sowle, D. SBDART: A research and teaching software tool for plane-parallel radiative transfer in the Earth’s atmosphere. B Am. Meteorol. Soc. 1998, 79, 2101–2114. [Google Scholar] [CrossRef]
  23. Wang, L.; Gong, W.; Xia, X.; Zhu, J.; Li, J.; Zhu, Z. Long-term observations of aerosol optical properties at Wuhan, an urban site in Central China. Atmos. Environ. 2015, 101, 94–102. [Google Scholar] [CrossRef]
Figure 1. Geographical information and latitude and longitude of the study area.
Environsciproc 27 00031 g001
Figure 2. Mass concentrations of PM2.5 and different aerosol types.
Environsciproc 27 00031 g002
Figure 3. (a) Inversion results of AOD for different aerosol types; (b) Variation of aerosol optical properties with date.
Environsciproc 27 00031 g003
Figure 4. Direct radiative forcing of aerosol types at (a) TOA; (b) BOA; (c) ATM; and (d) Atmospheric heating rates of different aerosol types.
Environsciproc 27 00031 g004
Disclaimer/Publisher’s Note: The statements, opinions and data contained in all publications are solely those of the individual author(s) and contributor(s) and not of MDPI and/or the editor(s). MDPI and/or the editor(s) disclaim responsibility for any injury to people or property resulting from any ideas, methods, instructions or products referred to in the content.

