1. Introduction
This paper is focused on understanding the concepts of climate and climate change, and their impact on the natural environment and people, specifically in relation to the important natural resource of water. I explore the Aoos/Vjosa watershed and the effects of human activities on the river, proposing ideas for cooperation and sustainable development. Climate refers to the long-term patterns of temperature, humidity, wind, and precipitation in a region, while climate change refers to significant changes in these patterns over time. Climate change is a natural process that has occurred throughout the history of the Earth, but human activities, such as burning fossil fuels and deforestation, have significantly accelerated the process in recent decades. The effects of climate change can be seen in rising temperatures, sea-level rise, changes in precipitation patterns, and more frequent extreme weather events. Water is a vital natural resource for all life on Earth, and it is created and recycled through natural processes such as evaporation, condensation, and precipitation. However, human activities such as pollution and overuse have had significant negative impacts on water resources, including the degradation of water quality and the depletion of freshwater sources. The Aoos/Vjosa watershed is a transboundary river that flows through Greece to Albania. The watershed is home to a diverse range of plant and animal species and is an important source of water for the region. However, anthropogenic activities such as deforestation, agriculture, and mining have had negative impacts on the river’s ecosystem, including erosion, sedimentation, and pollution. This study proposes ideas for cooperation and sustainable development in the region, including measures to reduce pollution and improve water quality, as well as ideas for promoting sustainable agricultural practices and eco-tourism. By working together, the two countries can ensure the long-term health and sustainability of the Aoos/Vjosa watershed and its natural resources.
The Aoos/Vjosa is a virgin wild river located in Europe, which originates and flows into one of the most untouched areas in the northern part of Epirus. The total length of the river is 272 km, of which 68 km flows into Greece, after which it flows into Albania as Vjosa and then flows into the Adriatic Sea. The river originates in the northern region of Pindos at an elevation of 1340 meters. Its source is marked by the presence of the Aoos artificial lake, which is fed by numerous tributaries. Among these, the most significant contributors are the Voidomatis and Sarantaporos river. The river flows between the mountains of Tymfi and Smolikas and creates an impressive gorge, which is densely forested and almost inaccessible, reaching a length of 8 km near Trapezitsa. Aoos moves between two National Parks, Vikos–Aoos and Valia Calda, and contributes to the formation and preservation of the wild landscape and the rich biodiversity of the area. Unfortunately, some policymakers and individuals under the banner of “environmentalists” have treated the wildlife in the region as a mere asset, going so far as to contemplate the possibility of altering the river’s course. This well-intentioned yet misguided notion has the potential to unleash severe ecological and social consequences upon the area. Overall, the Aoos River is a unique and valuable ecosystem, and its protection is essential to maintain the biodiversity and ecological balance of the area. It is important for policymakers and environmentalists to work together to protect this pristine river and the natural habitats that surround it for future generations to enjoy.
2. SPI
The standard rainfall index is based on the probability of precipitation for any given time scale and can be calculated for different time periods. It is designed to be simple, easy to calculate, and statistically relevant and substantial. SPI only requires rainfall as input data and it is effective in analyzing both dry and wet periods/cycles, making it a versatile tool for climatologists and meteorologists worldwide. To calculate the SPI, monthly rainfall data for at least 20–30 years are required, with 50–60 years or more being optimal and preferred (Guttman, 1994 [
1]). Short-term rainfall anomalies affect soil moisture conditions, while long-term anomalies affect groundwater, stream flow, and reservoir storage. The SPI can be used to monitor wet periods as well as droughts, and the drought intensities resulting from the SPI can be classified according to the SPI value
Table 1 developed by McKee and others in 1993 [
2]. A drought event occurs whenever the SPI is continuously negative and reaches an intensity of −1.0 or less, and each event has a duration and intensity for each month that the event continues.
Its practical range of application is 1–24 months, as recommended by Guttman (1994, 1999 [
1,
3]), based on data availability of about 50–60 years. Beyond 24 months, the statistical confidence of probability estimates in tails (both wet and dry extremities) becomes weak unless one has 80–100 years of data, as the sample size is very small (Guttman, 1994, 1999 [
1,
3], Vicente-Serrano et al., 2010 [
4]).
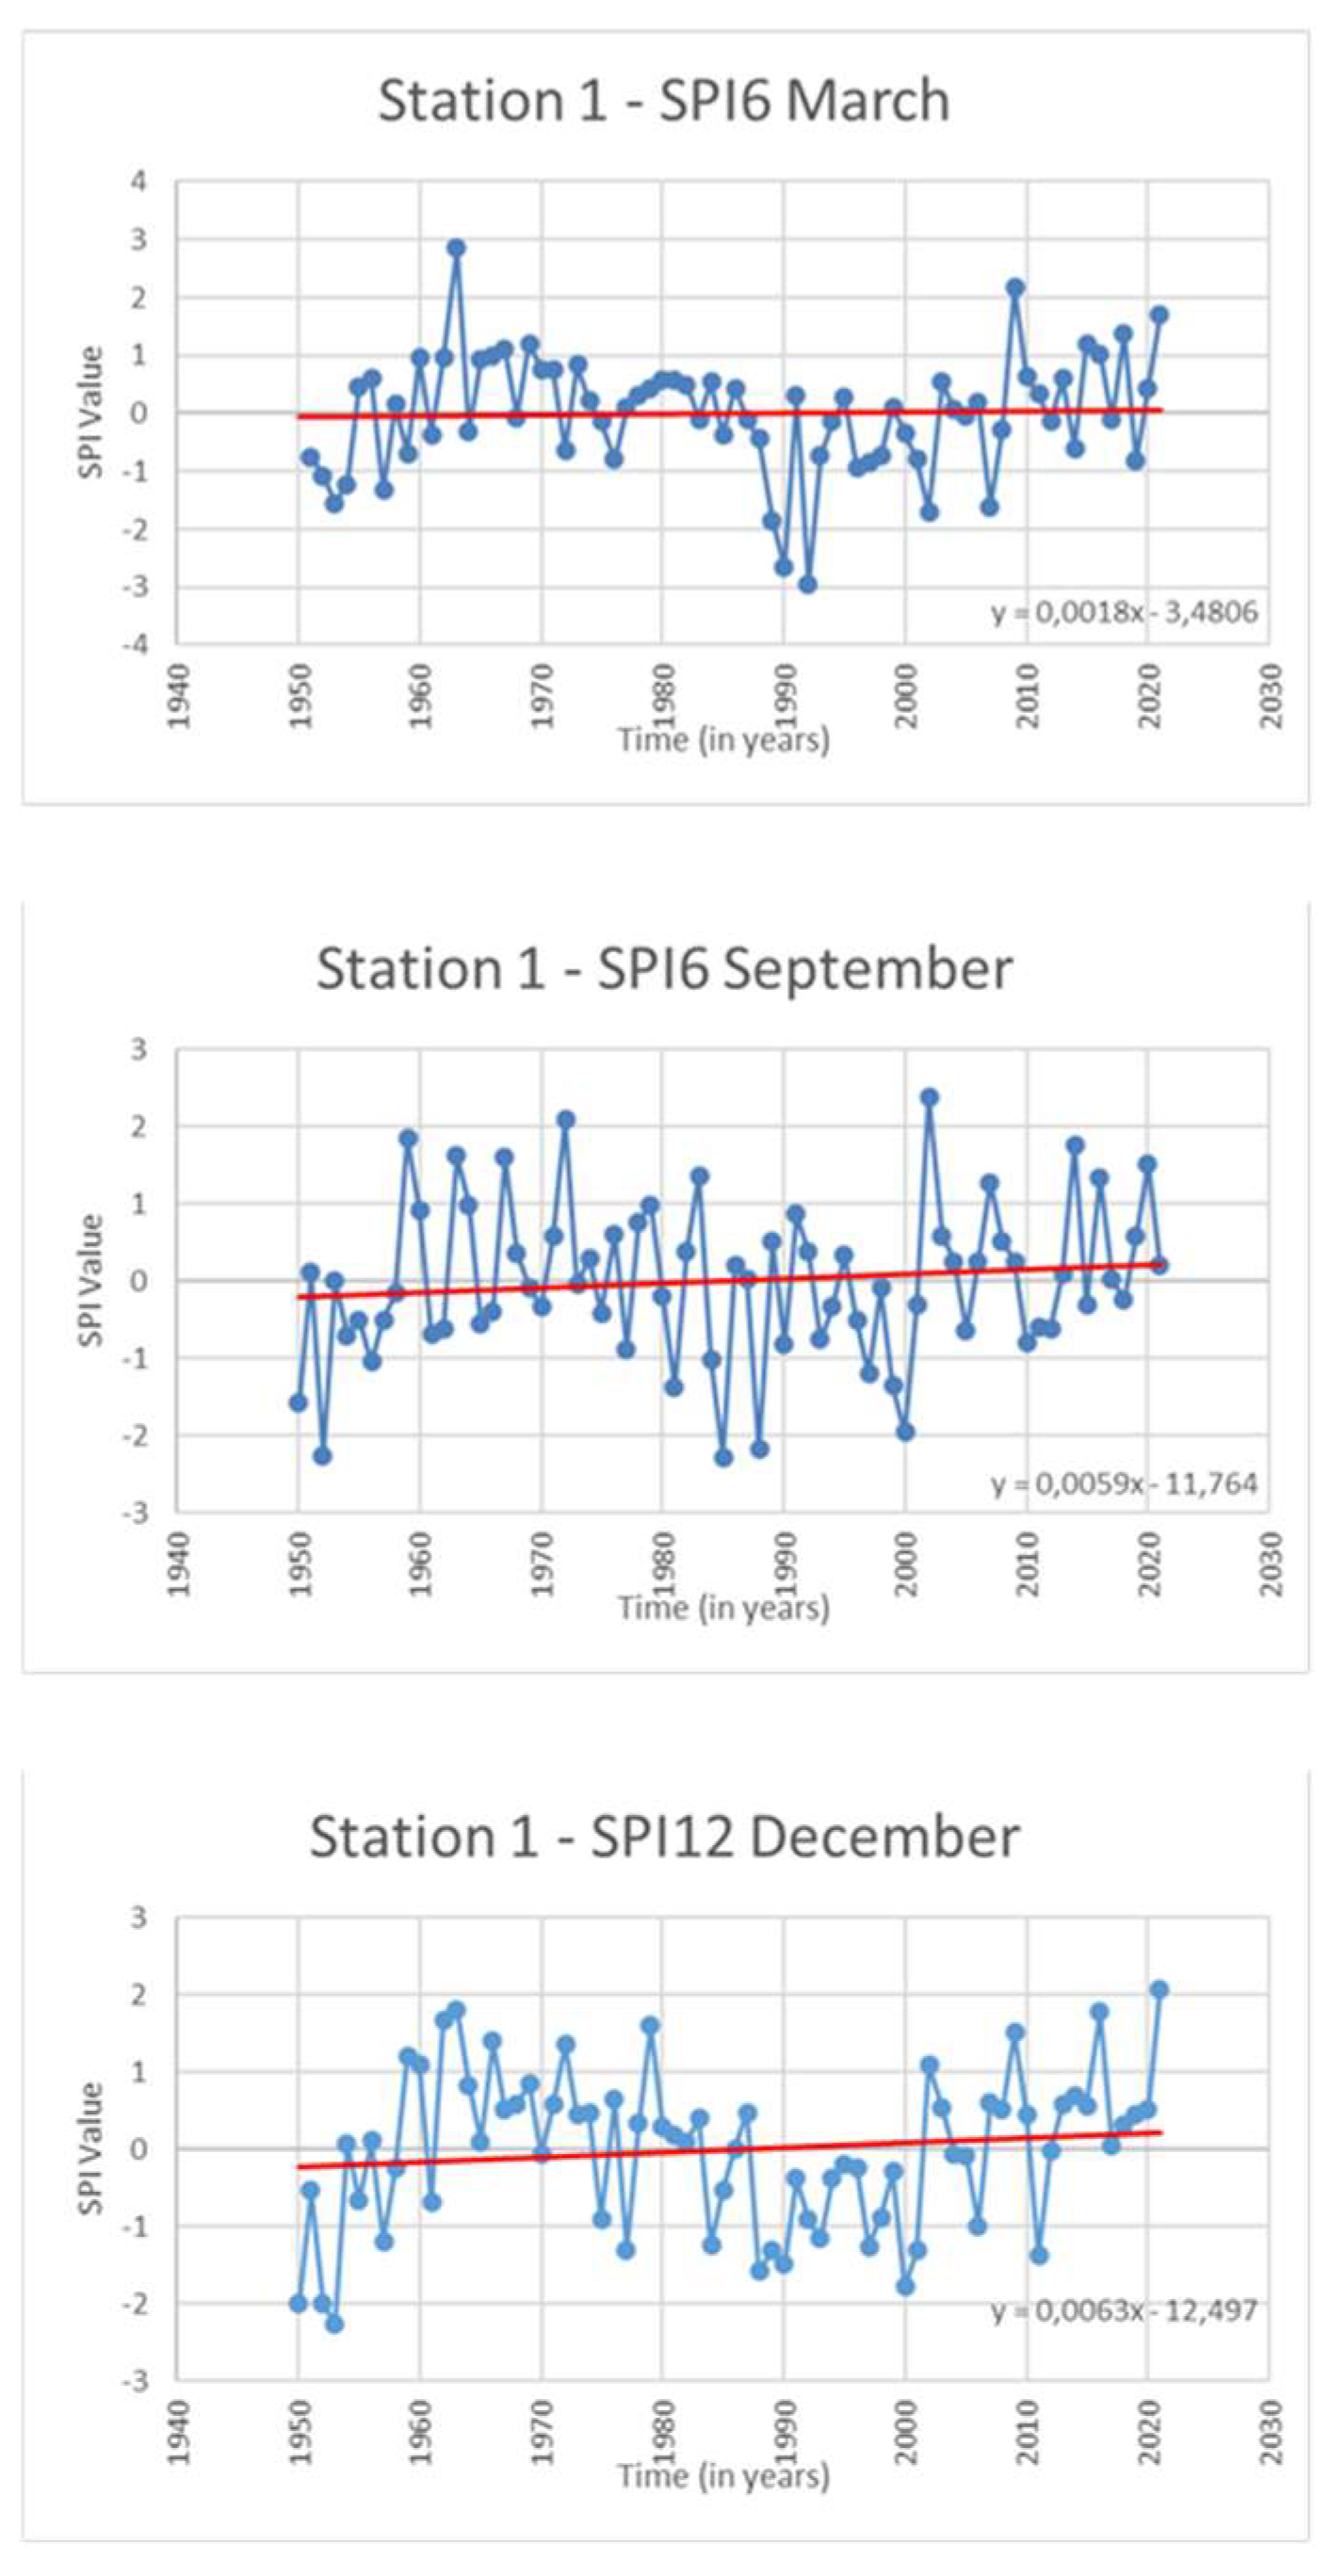
The 6-month standard rainfall index (SPI6) is a widely used tool for monitoring and assessing drought conditions. It compares precipitation for a specific period of 6 months with the same period of 6 months during the historical record to identify deviations from the norm. For example, a 6-month SPI calculated at the end of September compares total rainfall for the April–September period with all previous totals for the same period. It is important to note that the 6-month SPI is only one of many timeframes that can be used to monitor drought conditions, and other SPI schedules may be more suitable for different regions or applications. A 12-month SPI compares precipitation in 12 consecutive months with precipitation over the same period in all previous years of available data. Because this time scale incorporates the effect of shorter periods, it tends to approach zero unless there is a distinct wet or dry trend. These SPIs are typically associated with stream flows, reservoir levels, and groundwater levels over longer time scales. In some regions, the 12-month SPI and Palmer drought severity index (PDSI) are closely related and may reflect similar conditions.
The computational methodology for the SPI was first proposed by McKee et al. (1993, 1995) [
2,
5], Edwards and McKee (1997) [
6], and Guttman (1999) [
3]. The SPI is calculated by first adjusting the precipitation data for a given station to a probability density function. The adjusted probability distribution is then converted to a standard normal distribution, with an average of zero and a standard deviation of one. Finally, SPI values are calculated based on the number of standard deviations that precipitation for a given period deviates from the mean value of the distribution. The SPI’s methodology involves adjusting the long-term rainfall record for a specific location and period to a probability distribution, which is then converted into a normal distribution with an average SPI value of zero (Edwards and McKee, 1997 [
6]). Positive SPI values indicate precipitation above the median, while negative values indicate precipitation below the median. SPI is a powerful tool for drought monitoring and evaluation, as it can be calculated for multiple timeframes, ranging from 1 to 72 months (Guttman, 1994, 1999 [
1,
3]).
3. (Data/Map/Figures)
For the purpose of this paper, it was essential to calculate the Standardized Precipitation Index (SPI) at nine selected sites along the Aoos/Vjosa River. The geographical coordinates of these locations can be found in
Table 2, and their respective positions are depicted in
Figure 1 (Map). To perform the SPI calculations, daily rainfall data spanning from January 1, 1950, to December 31, 2021, were sourced from the European Climate Assessment & Dataset [ECA&D,
www.ecad.eu (accessed on 25 June 2023)]. The dataset used for this historical analysis was based on high spatial resolution E-OBS grid daily rainfall data with a resolution of 0.1° × 0.1° (v.25e). For the assessment of future climate scenarios, with a focus on understanding drought conditions, the two primary positions at station 3 and station 7 were selected.
To obtain future daily rainfall data for these sites, the regional climate model CNRM-CERFACS-CNRM-CM5 [Coupled Model version 5 from Centre National de Recherches Météorologiques. Available at:
https://www.umr-cnrm.fr/gmapdoc/spip.php?article104 (accessed on 25 June 2023)] of KNMI-RACMO22E_v1 [Royal Netherlands Meteorological Institute Regional Atmospheric Climate Model. Available at:
https://www.knmi.nl/kennis-en-datacentrum/achtergrond/knmi-racmo (accessed on 25 June 2023)], featuring a spatial resolution of 11 km, was employed. The data covered the period from 1 January 2022 to 31 December 2100, and was based on the Intergovernmental Panel on Climate Change RCP 8.5 extreme scenario [IPCC Available at:
www.ipcc.ch (accessed on 25 June 2023)]. To calculate the SPI index for both historical and future datasets, the SPI Generator software developed by the National Drought Mitigation Center UNL was utilized [NDMC. Available at:
http://drought.unl.edu/MonitoringTools/SPI/SPIGenerator.aspx (accessed on 25 June 2023)]. This software is widely recognized and respected in the scientific community for its robustness and accuracy in assessing drought conditions through the SPI metric.
4. Results/Conclusions
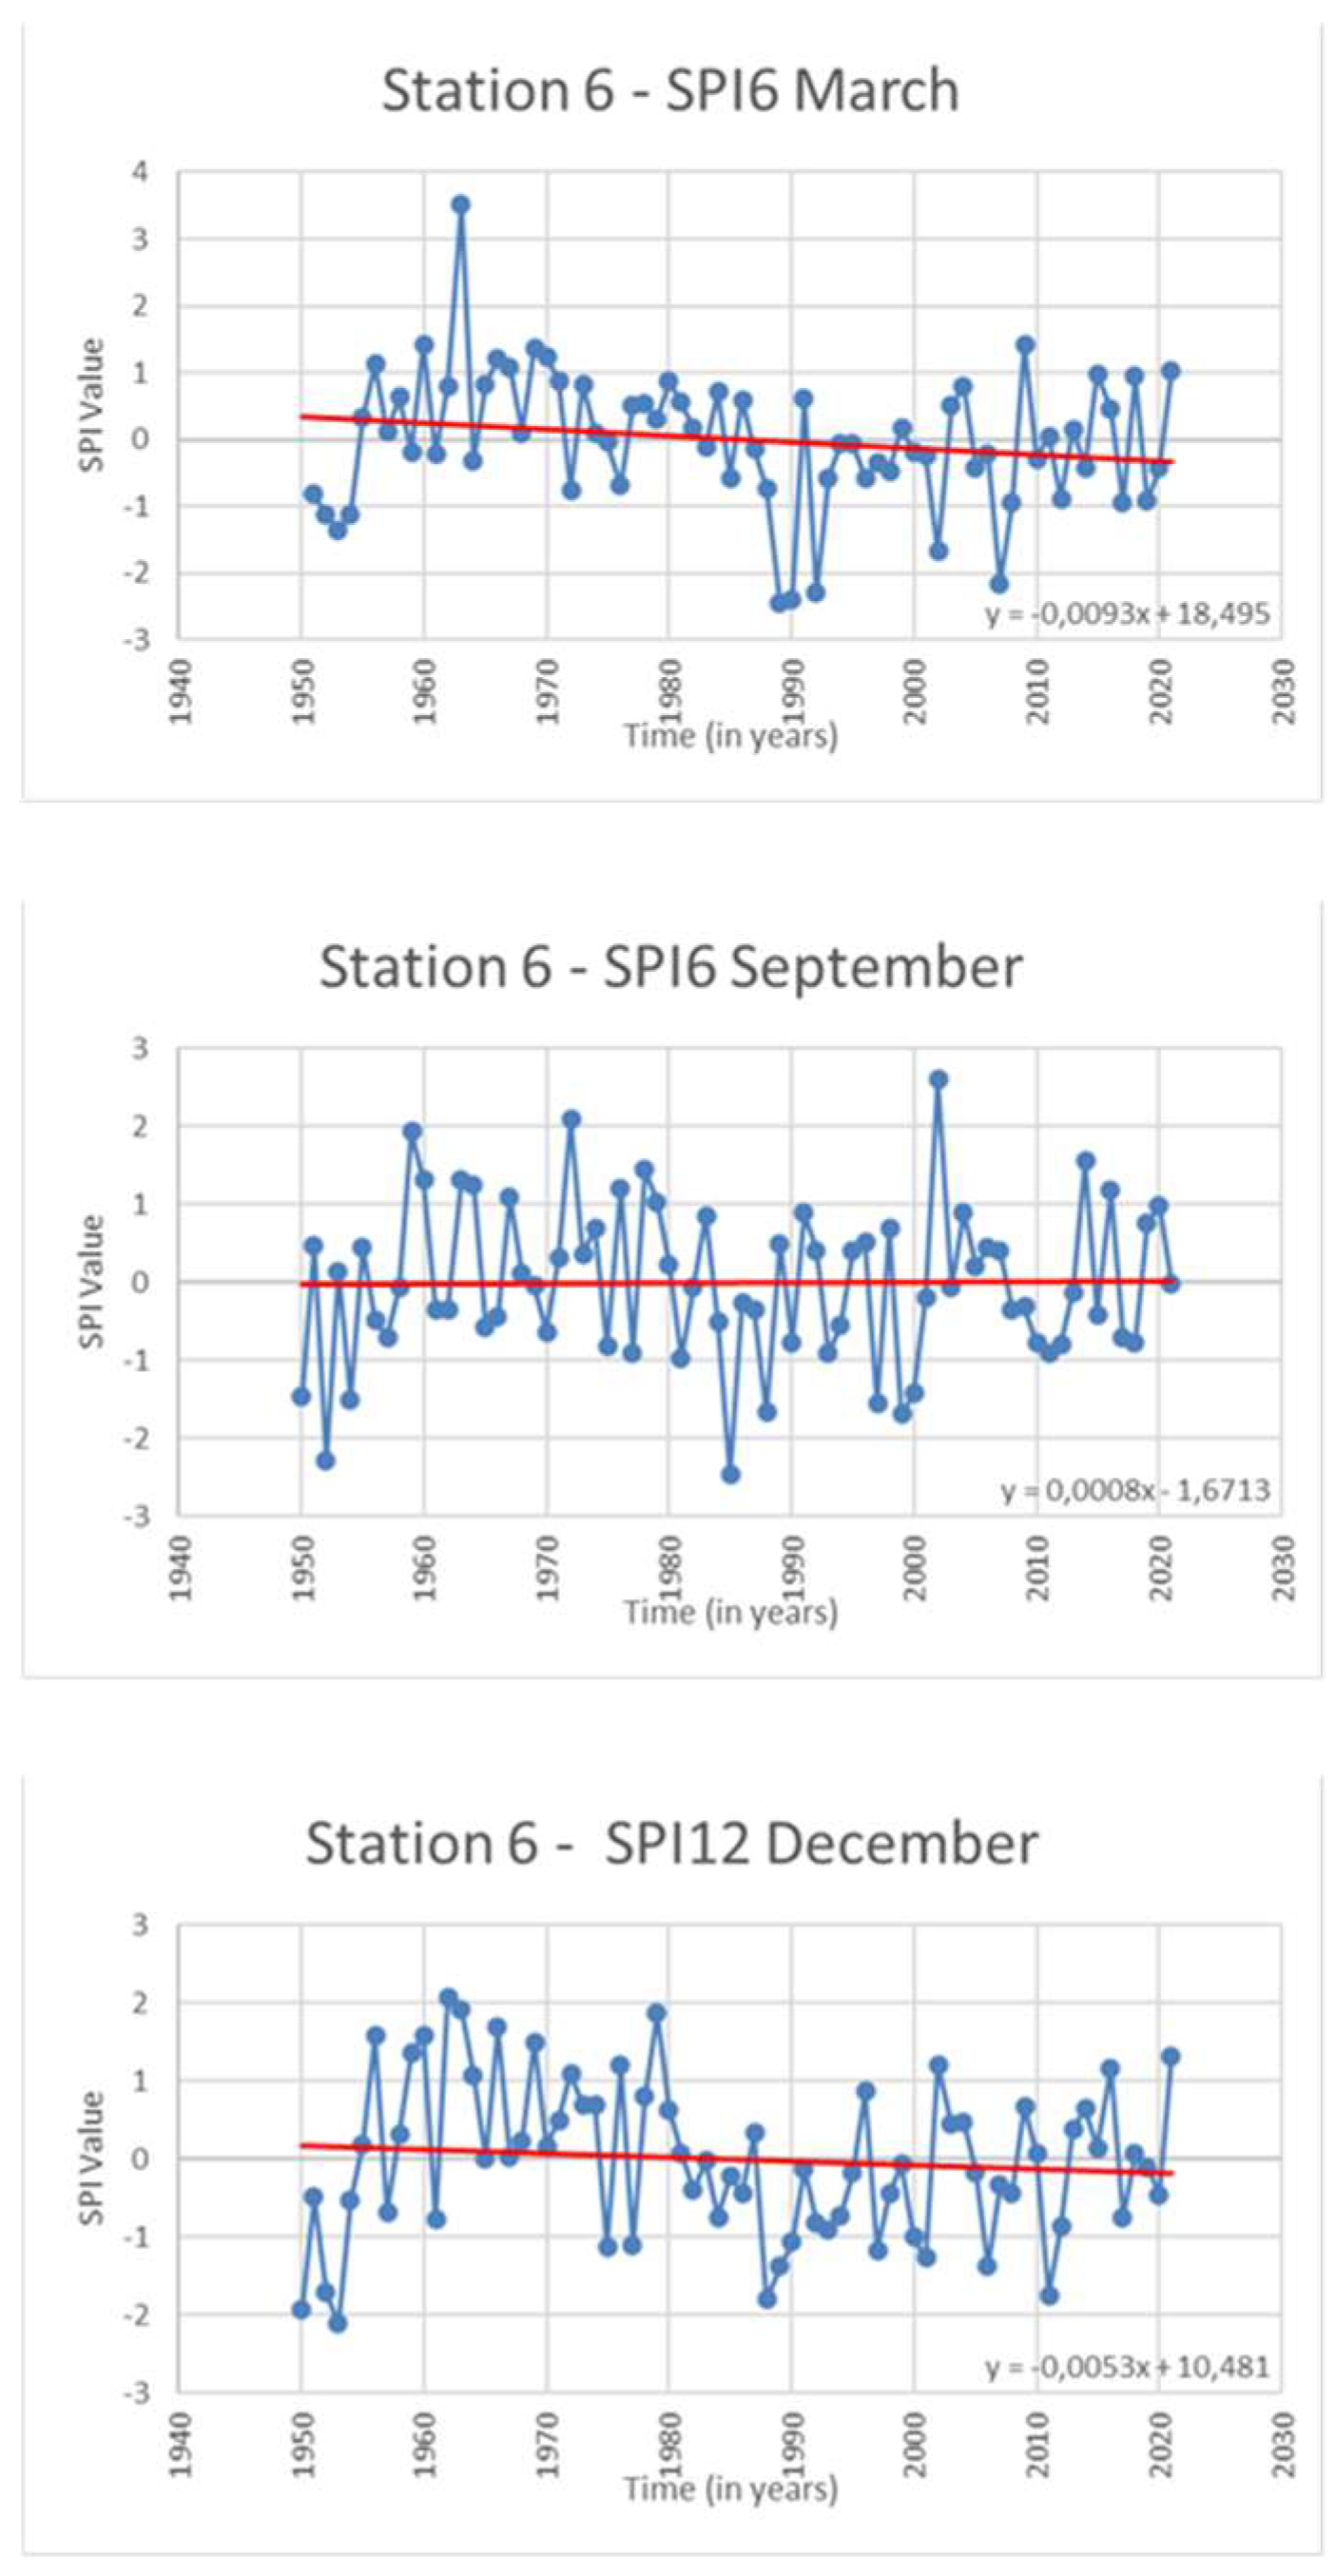
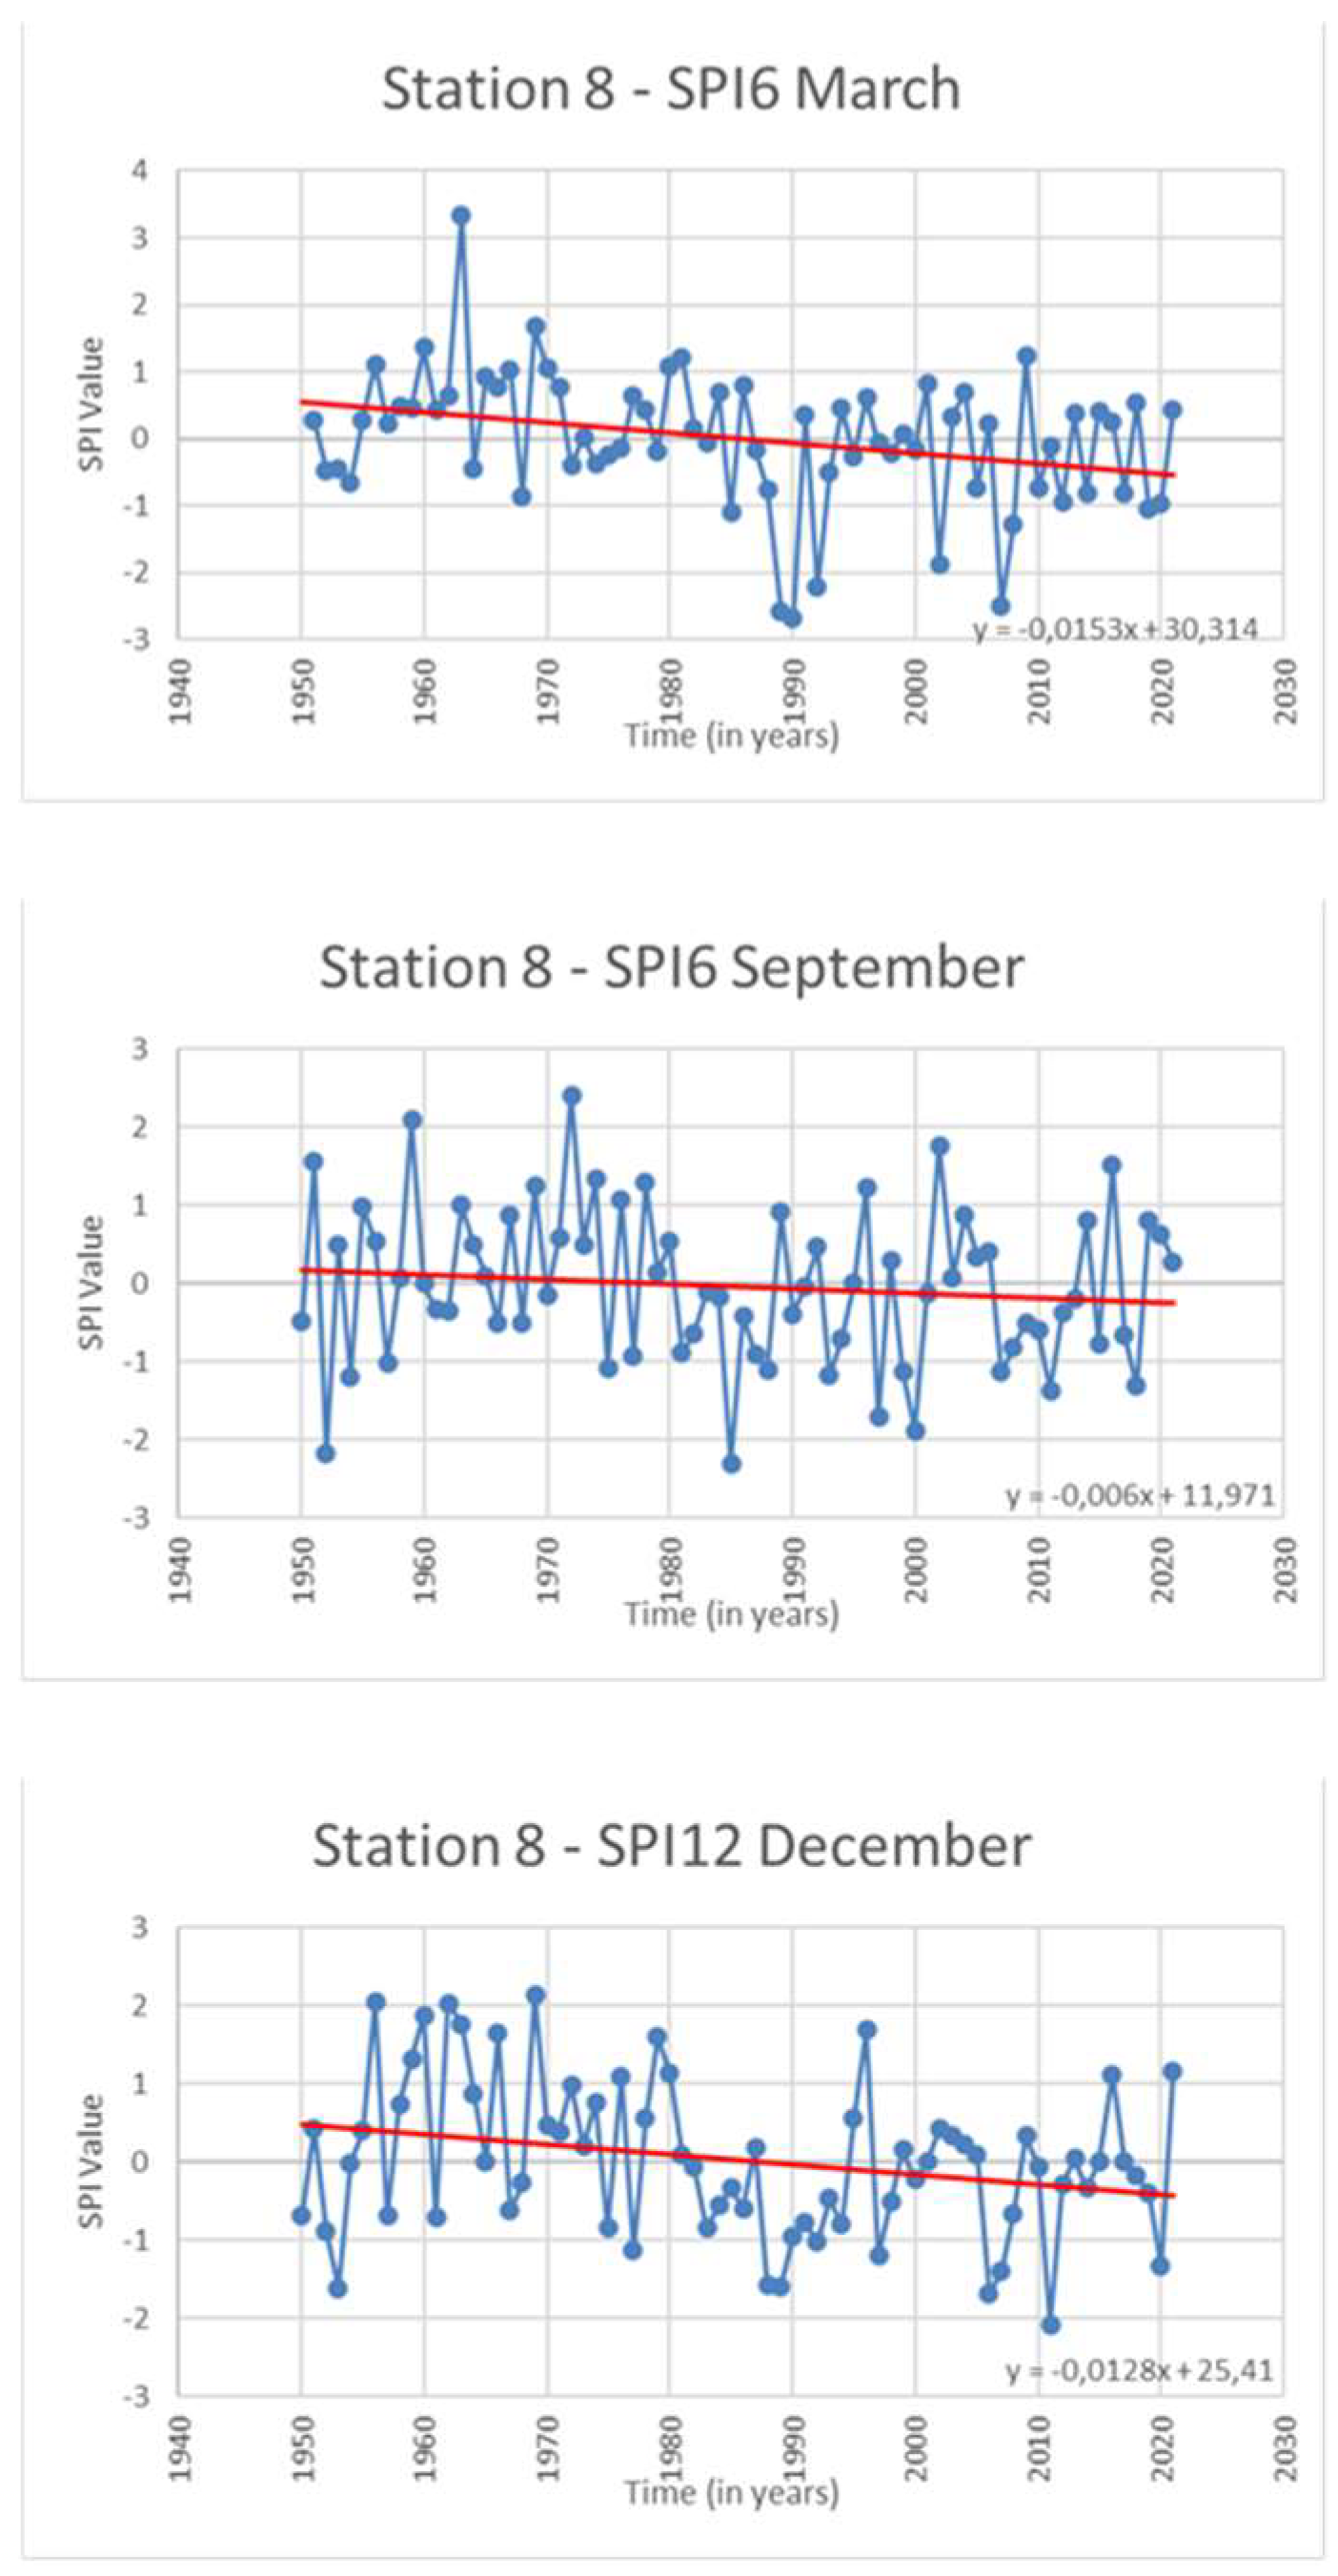
From the diagrams, the highest (SPI > 2) and lowest (SPI < −2) SPI values were collected with the results showing that in the year 1952, at all stations, and sequentially, extreme drought conditions existed all along the river. This was followed by an increasing tendency of the SPI index until 1963 when the river Aoos/Vjosa experienced extreme wet conditions along its entire length. Then, it slowly began to decrease, and from 1985 to 1992, extreme drought conditions prevailed. In the year 2002, extreme wet conditions prevailed, and in a faster period from previous years, it changed in 2007 to extreme drought conditions. Finally, at some of the stations, there were changes in 2009 with extreme wet conditions, in 2011 with extreme drought conditions, and in the year 2021 with extreme wet conditions. Based on the findings, the observed trend of variations as determined by the standardized precipitation index (SPI) does not exhibit significant disparities among the various monitoring stations. It is evident that the distribution of precipitation values along the entire length of the river is relatively uniform, encompassing both wet and drought conditions. It is important to note that the proximity of the SPI values calculated for the period from 1 January 1950 to 31 December 2021 does not serve as an explanation for the similarity observed in the calculated SPI values illustrated in
Figure 2,
Figure 3,
Figure 4,
Figure 5,
Figure 6,
Figure 7,
Figure 8,
Figure 9 and
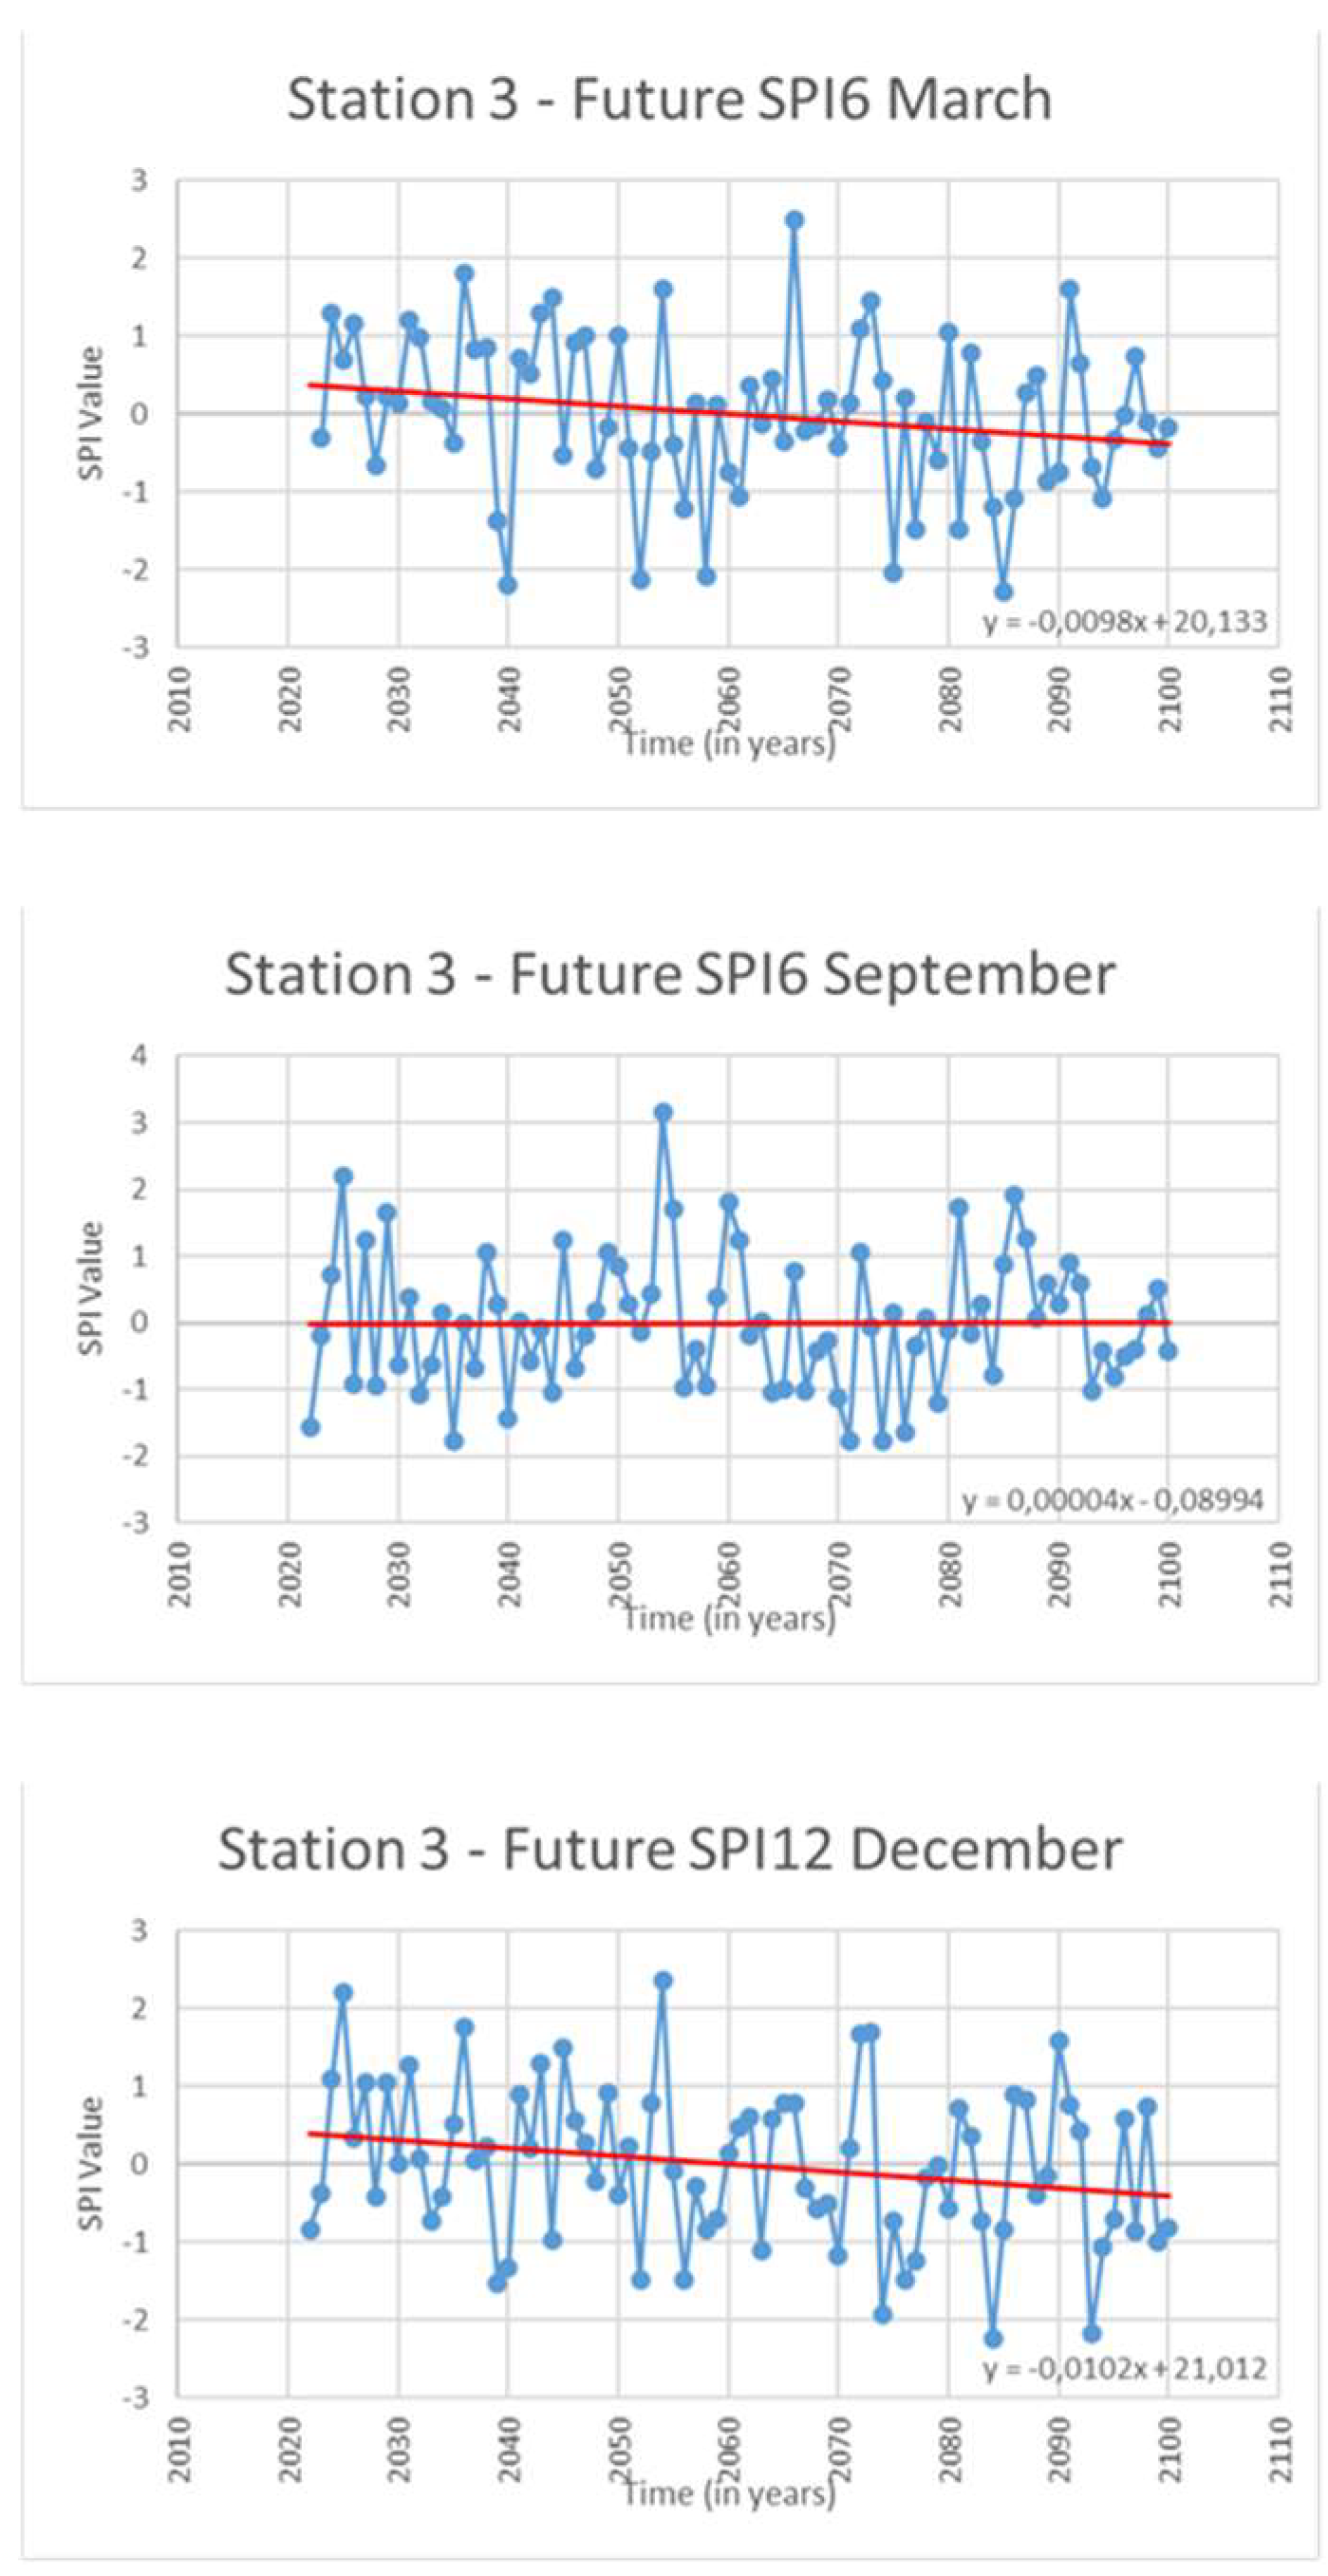
Figure 10. Naturally, the dissimilarities in the SPI values between the stations can be attributed to the diverse topographical and climatic characteristics, in addition to variations in elevation and precipitation patterns within large watersheds. Conversely, the outcomes obtained from the computational model used to project future rainfall patterns, spanning from 1 January 2021 to 31 December 2100, reveal more pronounced disparities in the SPI values between stations 3 and 7, as illustrated in
Figure 11 and
Figure 12. This observation can be attributed to the exacerbation of climate change effects over time. The results seem to be the case, which is confirmed over the years as well as by the future models calculated. The climate cycle has changed; previously, changes in climate were smoother and the time intervals between them were longer. Little by little, we see change, with anomalous changes at shorter intervals and with greater severity of phenomena, while nature tries to balance itself. All of this happens due to climate change that is exacerbated over the years by anthropogenic activities in the context of an uncontrolled business economy. Even though Aoos/Vjosa epitomizes a resilient and vigorous water system, it has been affected as human business activities continue to threaten the river, and it needs protection.
Funding
This research received no external funding.
Institutional Review Board Statement
I choose to exclude this statement, the study did not require ethical approval.
Informed Consent Statement
Informed consent was obtained from all subjects involved in the study.
Data Availability Statement
The data that support the findings of this study are available from the corresponding author, [PV], upon request.
Conflicts of Interest
The author declares no conflict of interest.
References
- Guttman, N.B. On the sensitivity of sample L moments to sample size. J. Clim. 1994, 7, 1026–1031. [Google Scholar] [CrossRef]
- McKee, T.B.; Doesken, N.J.; Kleist, J. The relationship of drought frequency and duration to time scales. In Proceedings of the 8th Conference on Applied Climatology, Zürich, Switzerland, 13–17 September 2010; American Meteorological Society: Boston, MA, USA, 1993; Volume 17, pp. 179–183. [Google Scholar]
- Guttman, N.B. Accepting the Standardized Precipitation Index: A calculation algorithm. J. Am. Water Resour. Assoc. 1999, 35, 311–322. [Google Scholar] [CrossRef]
- Vicente-Serrano, S.M.; Beguería, S.; López-Moreno, J.I. A multiscalar drought index sensitive to global warming: The Standardized Precipitation Evapotranspiration Index. J. Clim. 2010, 23, 1696–1718. [Google Scholar] [CrossRef]
- McKee, T.B.; Doesken, N.J.; Kleist, J. Drought monitoring with multiple time scales. In Proceedings of the 9th Conference on Applied Climatology, Dallas TX, USA, 15–20 January 1995; American Meteorological Society: Boston, MA, USA, 1995; pp. 233–236. [Google Scholar]
- Edwards, D.C.; McKee, T.B. Characteristics of 20th Century Drought in the United States at Multiple Time Scales; Climatology Report 97-2; Colorado State University: Fort Collins, CO, USA, 1997. [Google Scholar]
Figure 1.
Map of Aoos/Vjosa River and data stations.
Figure 1.
Map of Aoos/Vjosa River and data stations.
Figure 2.
SPI6 time series for the wet season, dry season, and annual SPI12 of the year from 1 January 1950 to 31 December 2021 for the wider area of ‘Aoos springs dam’ (Station 1).
Figure 2.
SPI6 time series for the wet season, dry season, and annual SPI12 of the year from 1 January 1950 to 31 December 2021 for the wider area of ‘Aoos springs dam’ (Station 1).
Figure 3.
SPI6 time series for the wet season, dry season, and annual SPI12 of the year from 1 January 1950 to 31 December 2021 for the wider area of ‘Vovousa’ (Station 2).
Figure 3.
SPI6 time series for the wet season, dry season, and annual SPI12 of the year from 1 January 1950 to 31 December 2021 for the wider area of ‘Vovousa’ (Station 2).
Figure 4.
SPI6 time series for the wet season, dry season, and annual SPI12 of the year from 1 January 1950 to 31 December 2021 for the wider area of ‘Aoos Bridge’ (Station 3).
Figure 4.
SPI6 time series for the wet season, dry season, and annual SPI12 of the year from 1 January 1950 to 31 December 2021 for the wider area of ‘Aoos Bridge’ (Station 3).
Figure 5.
SPI6 time series for the wet season, dry season, and annual SPI12 of the year from 1 January 1950 to 31 December 2021 for the wider area of ‘Bourazani Bridge’ (Station 4).
Figure 5.
SPI6 time series for the wet season, dry season, and annual SPI12 of the year from 1 January 1950 to 31 December 2021 for the wider area of ‘Bourazani Bridge’ (Station 4).
Figure 6.
SPI6 time series for the wet season, dry season, and annual SPI12 of the year from 1 January 1950 to 31 December 2021 for the wider area of ‘Melissopetra’ (Station 5).
Figure 6.
SPI6 time series for the wet season, dry season, and annual SPI12 of the year from 1 January 1950 to 31 December 2021 for the wider area of ‘Melissopetra’ (Station 5).
Figure 7.
SPI6 time series for the wet season, dry season, and annual SPI12 of the year from 1 January 1950 to 31 December 2021 for the wider area of ‘Petran’ (Station 6).
Figure 7.
SPI6 time series for the wet season, dry season, and annual SPI12 of the year from 1 January 1950 to 31 December 2021 for the wider area of ‘Petran’ (Station 6).
Figure 8.
SPI6 time series for the wet season, dry season, and annual SPI12 of the year from 1 January 1950 to 31 December 2021 for the wider area of ‘Tepelenë’ (Station 7).
Figure 8.
SPI6 time series for the wet season, dry season, and annual SPI12 of the year from 1 January 1950 to 31 December 2021 for the wider area of ‘Tepelenë’ (Station 7).
Figure 9.
SPI6 time series for the wet season, dry season, and annual SPI12 of the year from 1 January 1950 to 31 December 2021 for the wider area of ‘Selenice’ (Station 8).
Figure 9.
SPI6 time series for the wet season, dry season, and annual SPI12 of the year from 1 January 1950 to 31 December 2021 for the wider area of ‘Selenice’ (Station 8).
Figure 10.
SPI6 time series for the wet season, dry season, and annual SPI12 of the year from 1 January 1950 to 31 December 2021 for the wider area of ‘Vjosa-Narta’ (Station 9).
Figure 10.
SPI6 time series for the wet season, dry season, and annual SPI12 of the year from 1 January 1950 to 31 December 2021 for the wider area of ‘Vjosa-Narta’ (Station 9).
Figure 11.
Future SPI6 time series for the wet season, dry season, and annual SPI12 of the year from 1 January 2022 to 31 December 2100 for the wider area of ‘Aoos Bridge’ (Station 3).
Figure 11.
Future SPI6 time series for the wet season, dry season, and annual SPI12 of the year from 1 January 2022 to 31 December 2100 for the wider area of ‘Aoos Bridge’ (Station 3).
Figure 12.
Future SPI6 time series for the wet season, dry season, and annual SPI12 of the year from 1 January 2022 to 31 December 2100 for the wider area of ‘Tepelenë’ (Station 7).
Figure 12.
Future SPI6 time series for the wet season, dry season, and annual SPI12 of the year from 1 January 2022 to 31 December 2100 for the wider area of ‘Tepelenë’ (Station 7).
Table 1.
SPI value table.
Table 1.
SPI value table.
| 2.0 and more | Extremely wet |
| 1.5 to 1.99 | Very wet |
| 1.0 to 1.49 | Moderately wet |
| −0.99 to 0.99 | Near normal |
| −1.0 to −1.49 | Moderately dry |
| −1.5 to −1.99 | Very dry |
| −2.0 and less | Extremely dry |
Table 2.
Coordinate table of each station.
Table 2.
Coordinate table of each station.
| Stations | wgs84 (Lat) | wgs84 (Lon) |
|---|
| Station 1 | 39.84986 | 21.04986 |
| Station 2 | 39.94986 | 21.04986 |
| Station 3 | 40.04986 | 20.84986 |
| Station 4 | 40.04986 | 20.64986 |
| Station 5 | 40.04986 | 20.54986 |
| Station 6 | 40.24986 | 20.44986 |
| Station 7 | 40.24986 | 20.04986 |
| Station 8 | 40.54986 | 19.64986 |
| Station 9 | 40.64986 | 19.44986 |
| Disclaimer/Publisher’s Note: The statements, opinions and data contained in all publications are solely those of the individual author(s) and contributor(s) and not of MDPI and/or the editor(s). MDPI and/or the editor(s) disclaim responsibility for any injury to people or property resulting from any ideas, methods, instructions or products referred to in the content. |
© 2023 by the author. Licensee MDPI, Basel, Switzerland. This article is an open access article distributed under the terms and conditions of the Creative Commons Attribution (CC BY) license (https://creativecommons.org/licenses/by/4.0/).


