Abstract
Based on ground-based measurements, the impact on air pollution over the Greater Athens Area (GAA) due to the two public lockdown periods (first lockdown period: 23 March 2020 until 3 May 2020; second lockdown period: 7 November 2020 until 2 May 2021) in the GAA implemented to stop the spread of the COVID-19 is analyzed. The findings demonstrated that vehicular traffic is the main culprit of air pollution in the GAA, while secondary factors for the air pollution over the GAA are considered heating systems and the weather, while the ‘ozone paradox’ was noticed, too.
1. Introduction
In late December 2019, pneumonia of an unknown cause was diagnosed in Wuhan, Hubei Province, China. It was derived from a recently discovered coronavirus (Severe Acute Respiratory Syndrome CoronaVirus 2 or SARS-CoV-2) that led to the outbreak of the infamous COVID-19 disease. As this disease spread worldwide, countries implemented lockdown measures and changes in work and living habits were noted. This led to a reduction in passenger car use, and an enhancement in anthropogenic pollution conditions was proposed, after the examination and comparison of multiple satellite images.
A number of studies analyzing in situ air quality data during the pandemic period have reported results from China and other Asian countries [1,2]. In Europe, the first studies were from Southern European countries that applied large-scale confinement measures from the outset to counter the rapidly spreading disease [3,4].
Specifically, in Greece, Melidis & Tzagkarakis conducted research in order to investigate the monthly average concentration values of NO2, PM2.5 and particulate matter (PM10) during the period 2019–2020, in the GAA, Thessaloniki, and Patra. The authors concluded that NO2, PM2.5 and PM10 emissions in these three cities, during 2020, saw an overall decline. However, the authors noted some increases in the pollutants’ concentrations towards the last months of 2020, creating a mixed picture [5].
Barmparesos et al. in their study noticed that the concentrations of CO, NO2 and PM10 in the atmosphere over the GAA, during the lockdown period (24 March 2020 until 7 April 2020) were reduced by 47%, 35% and 24%, respectively, compared to the those observed in the pre-confinement period (19 February 2020 until 11 March 2020) [6].
In another study, Grivas et al. examined the levels of NO2, CO, PM2.5, CO2, black carbon (BC) and source-specific BC components over the GAA and compared them with the respective levels in the four previous years. The results, presented by the authors, showed a concentration reduction of 30–35% for traffic-related pollutants in the GAA (BC, CO, and NO2 produced by fossil fuel burning), compared to the concentrations observed in the pre-confinement period. A decrease in urban CO2 was noticed, too, while the decline in PM2.5 was more subtle (18%) [7].
Inspired by the above-mentioned studies, this research focuses on the consequences of the two lockdown periods (first lockdown period: 23 March 2020 until 3 May 2020; second lockdown period: 7 November 2020 until 2 May 2021) in terms of the air quality within the Greater Athens Area (GAA), Greece, and these will be compared to consequences of the pre-lockdown period (pre-lockdown period: 1 January 2016 until 22 March 2020). Locally emitted, regulated air pollutants in the Attica Basin (carbon monoxide (CO), sulfur dioxide (SO2), ozone (O3), nitrogen dioxide (NO2) and particulate matter (PM10)) are going to be examined on a monthly, daily and hourly basis and will allow for a better approach to this investigation, as the identification and study of the seasonality, the weekend effect and the intraday variation, respectively, of each one of the five studied pollutants for each period will show how much the pollution levels have really changed during the two confinement periods.
2. Data and Methodology
Air pollution concentrations have been collected by the network of fourteen air pollution monitoring stations, all located within the GAA, owned by the Hellenic Ministry of Environment and Energy (HMEE) and are uploaded, annually, on the HMEE site as .dat files. These data have been downloaded from the HMEE site and with the use of Apple’s spreadsheet application ‘Numbers’, have been converted into .numbers files to be processed. Thus, the monthly, daily and hourly average concentration values of the studied pollutants were calculated separately for the three above-mentioned periods, for each pollutant, and the respective figures were made.
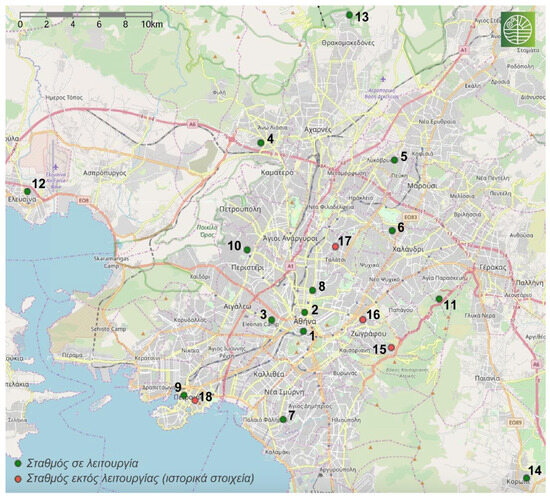
Figure 1 presents the map of the fourteen operational (number one to number fourteen) air pollution monitoring stations in the GAA. Note that the red numbered dots, are air pollution monitoring stations, which are out of service and are not included in this study.

Figure 1.
Map of air pollution monitoring stations in the Greater Attica region [8].
More specifically, the fourteen air pollution monitoring stations are Athinas (ATH) (dot number 1), Aristotelous (ARI) (dot number 2), Geoponiki (GEO) (dot number 3), Liossia (LIO) (dot number 4), Lykovrissi (LYK) (dot number 5), Maroussi (MAR) (dot number 6), Nea Smyrni (SMY) (dot number 7), Patission (PAT) (dot number 8), Piraeus (PIR) (dot number 9, Peristeri (PER) (dot number 10), Agia Paraskevi (AGP) (dot number 11), Elefsina (ELE) (dot number 12), Thrakomakedones (THR) (dot number 13) and Koropi (KOR) (dot number 14).
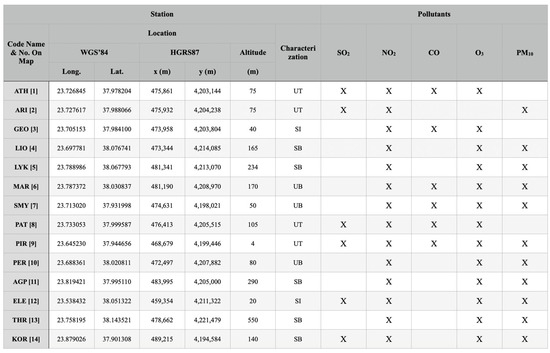
Four of the above monitoring stations are characterized as urban traffic (UT) stations, two as suburban industrial (SI) stations, five as suburban background (SB) stations and the rest three as urban background (UB) monitoring stations.
Figure 2 depicts a detailed description of the coordinates, altitude, characterization, and pollutants which were recorded by each monitoring station within the GAA.

Figure 2.
Detail characteristics of the fourteen air pollution monitoring stations within the GAA [9].
3. Results and Discussion
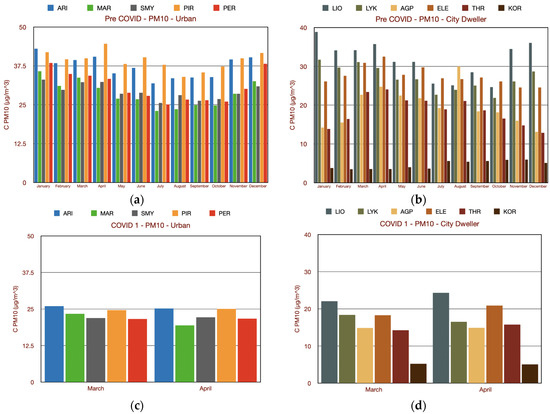
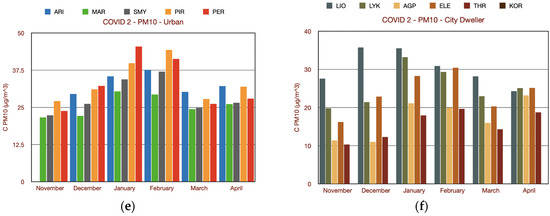
Figure 3 depicts the monthly average concentrations of PM10 within the GAA during the examined periods. After examining the hourly, daily and monthly average concentration values in the atmosphere over the GAA, for all of the three examined periods, the following observations could be made:


Figure 3.
(a) Monthly average concentration values of PM10 in the atmosphere, during the pre-COVID period (urban stations); (b) monthly average concentration values of PM10 in the atmosphere, during the pre-COVID period (suburban stations); (c) monthly average concentration values of PM10 in the atmosphere, during the first lockdown period (urban stations); (d) monthly average concentration values of PM10 in the atmosphere, during the first lockdown period (suburban stations); (e) monthly average concentration values of PM10 in the atmosphere, during the second lockdown period (urban stations); (f) monthly average concentration values of PM10 in the atmosphere, during the second lockdown period (suburban stations).
- A proportional influence of CO and vehicular traffic is seen. In particular, it is noticed that whenever there is intense vehicular traffic, CO concentration values are high. A couple of strong examples are (a) the first confinement period and the very low concentration values of CO in the atmosphere (when the restriction measures were rigorous and thus, there was almost no use of vehicles) and (b) a station with the codename “PAT”, which recorded the highest, in most cases, CO concentration values as heavy vehicular traffic is present in that area, compared to those recorded by other stations.
- A small proportional influence of NO2 and vehicular traffic is seen, as there is a decrease in NO2 concentration values, in the atmosphere over the GAA, during the two lockdown periods, but not a significant one. Other factors affect the NO2 concentration in the atmosphere over the GAA, too.
- The two main reasons for the increase in O3 concentration in the atmosphere during the lockdown periods (especially the first one) are (a) the reduction in NOxs emissions, as O3 can be degraded by NOxs, by which it is also formed, and (b) the sunny, warm weather.
- A proportional influence of PM10, vehicular traffic, and heating systems is observed. In particular, it is noticed that whenever there is intense vehicular traffic or a usage of heating systems, PM10 concentration values are high. A strong example is the first confinement period accompanied by the low concentration values of PM10 in the atmosphere (when the restrictions measures were rigorous and thus, there was almost no use of vehicles; in addition, the weather was warm and there was no use of heating systems).
- A proportional influence of SO2 and vehicular traffic is observed. In particular, it is noticed that whenever there is intense vehicular traffic, SO2 concentration values are high.
4. Conclusions
After analyzing the data on regulated air pollutants in the Attica Basin during the COVID-19 confinement periods, comparing them with each other and also with those for the pre-lockdown period, this project shows that vehicular traffic is the main culprit of air pollution in the GAA, as CO, ΝO2, SO2 and—to a lesser extent—PM10 concentrations in the atmosphere decreased, especially during the first restriction period, in which the measures were stricter than those of the second period. Secondary factors for the air pollution over the GAA are considered heating systems and the weather.
Furthermore, the ‘ozone paradox’ was noticed, too. O3 can be degraded by NOxs, by which it is also formed. As NOxs’ emissions were decreased (due to the presence of almost no vehicular traffic), O3 concentration in the atmosphere over the GAA, during the two lockdown periods (especially during the first one), increased, compared to those in the pre-confinement period.
Concentration values of CO, ΝO2 and SO2 seem to be higher at the downtown-urban monitoring sites, while for O3, typically higher values are observed at the city dweller–suburban sites. Topography and a low mixing layer height combined with southwestern local winds of a low speed (sea breeze) in Athens often result in ozone accumulation in the northern and northeastern suburbs, especially during the summertime afternoon hours [9].
CO and SO2 concentrations during the winter period are higher than those during the summer period [9].
Overall, the temporal variation in the measured air pollutant concentrations in the GAA, since 1984, shows a general decline in the concentrations of certain air pollutants [9]. The air quality over the GAA is within sustainable frameworks between 2016 and 2021.
Author Contributions
Conceptualization, methodology, investigation, writing—original draft preparation, writing—review and editing, and supervision, I.J. and K.M. All authors have read and agreed to the published version of the manuscript.
Funding
This research received no external funding.
Institutional Review Board Statement
Not applicable.
Informed Consent Statement
Not applicable.
Data Availability Statement
Publicly available datasets were analyzed in this study.
Acknowledgments
The specific work was carried out in the context of the Master Diploma Thesis, of the MSc In Energy Systems, Mechanical Engineering Department, School of Engineering, University of West Attica, Athens, Greece.
Conflicts of Interest
The authors declare no conflict of interest.
References
- He, G.; Pan, Y.; Tanaka, T. The short-term impacts of COVID-19 lockdown on urban air pollution in China. Nat. Sustain. 2020, 3, 1005–1011. [Google Scholar] [CrossRef]
- Sharma, S.; Zhang, M.; Anshika; Gao, J.; Zhang, H.; Kota, S.H. Effect of restricted emissions during COVID-19 on air quality in India. Sci. Total Environ. 2020, 728, 138878. [Google Scholar] [CrossRef] [PubMed]
- Collivignarelli, M.C.; Abbà, A.; Bertanza, G.; Pedrazzani, R.; Ricciardi, P.; Carnevale Miino, M. Lockdown for COVID-19 in Milan: What are the effects on air quality? Sci. Total Environ. 2020, 732, 139280. [Google Scholar] [CrossRef] [PubMed]
- Tobías, A.; Carnerero, C.; Reche, C.; Massagué, J.; Via, M.; Minguillón, M.C.; Alastuey, A.; Querol, X. Changes in air quality during the Lockdown in Barcelona (Spain) one month into the SARS-CoV-2 epidemic. Sci. Total Environ. 2020, 726, 138540. [Google Scholar] [CrossRef] [PubMed]
- Melidis, M.; Tzagkarakis, S.I. Assessing air quality in Greece in times of a global pandemic. HAPSc Policy Briefs Ser. 2020, 2, 87. [Google Scholar] [CrossRef]
- Barmparesos, N.; Efthymiou, C.; Tasios, P.; Asimakopoulos, D.; Assimakopoulos, M.N. Preliminary results of COVID-19 restriction measures on the air pollution levels in the city center of Athens, Greece. In Proceedings of the Technologies and Materials for Renewable Energy, Environment and Sustainability: TMREES21Gr, Athens, Greece, 28–30 May 2021. [Google Scholar]
- Grivas, G.; Athanasopoulou, E.; Kakouri, A.; Bailey, J.; Liakakou, E.; Stavroulas, I.; Kalkavouras, P.; Bougiatioti, A.; Kaskaoutis, D.; Ramonet, M.; et al. Integrating in situ measurements and city scale modelling to assess the COVID–19 lockdown effects on emissions and air quality in Athens, Greece. Atmosphere 2020, 11, 1174. [Google Scholar] [CrossRef]
- Annual Air Quality Report 2022, HMEE. Available online: https://ypen.gov.gr/wp-content/uploads/2023/06/%CE%95%CE%A4%CE%97%CE%A3%CE%99%CE%91-%CE%95%CE%9A%CE%98%CE%95%CE%A3%CE%97-2022.pdf (accessed on 23 August 2023). (In Greek)
- Annual Air Quality Report 2021, HMEE. Available online: https://ypen.gov.gr/wp-content/uploads/2022/07/%CE%95%CE%9A%CE%98%CE%95%CE%A3%CE%97-2021.pdf (accessed on 26 April 2023). (In Greek)
Disclaimer/Publisher’s Note: The statements, opinions and data contained in all publications are solely those of the individual author(s) and contributor(s) and not of MDPI and/or the editor(s). MDPI and/or the editor(s) disclaim responsibility for any injury to people or property resulting from any ideas, methods, instructions or products referred to in the content. |
© 2023 by the authors. Licensee MDPI, Basel, Switzerland. This article is an open access article distributed under the terms and conditions of the Creative Commons Attribution (CC BY) license (https://creativecommons.org/licenses/by/4.0/).