1. Introduction
Extreme precipitation events pose a significant threat to human infrastructure and health, as in most cases, they result in flash floods, especially in large metropolitan areas where population density is high. In Greece, during the period 1960–2010, there were recorded nearly 500 flood cases accounting for 3.7 fatalities per year, with flash floods being responsible for the vast majority of them (82%) [
1]. Analysis of a large number of studies has shown that both observed trends and future climate projections indicate an increase in extreme precipitation events and associated flood discharge in Europe despite the uncertainties concerning the changes in total precipitation [
2]. Significant positive trends are also found in Northern Greece under both RCP4.5 and RCP8.5 future scenarios [
3].
In addition, there is evidence that increases in extreme rainfall, especially in dry regions, are linearly related to global temperature change [
4]. According to IPCC, more precipitation is associated with higher temperatures as the capacity of the atmosphere to hold water increases in warmer conditions. This link is best described via the Clausius–Clapeyron relationship, which determines that the water-holding capacity of the atmosphere increases by about 7% for every 1 °C rise in temperature [
5]. Several observational studies in a range of climatic conditions and temporal scales identified this scaling rate (CC rate) in extreme precipitation data. These studies also identified that for temperatures above ~12 °C, the scaling rate exceeds the CC rate. This so-called super-CC scaling (>7%/°C) is considered to be caused by a surplus of latent heat release during extreme events. As increasing temperature leads to increased moisture content, more latent heat is released, thus enhancing convection [
6]. The existence of CC-scaling, especially the super CC-scaling, has very important socio-economic consequences as it suggests that in a warmer climate, the expected increase in the intensity of extreme precipitation is going to be particularly significant and is likely to exceed the current expected rate.
In this paper, the methodology of Vyver et al. [
7] is applied to estimate the scaling rates and temperature threshold for Thessaloniki by dividing the data into warm and cold periods. This distinction is implemented to distinguish between convective and stratiform precipitation since the convective form is mainly observed during the warm season, as opposed to the stratiform, which dominates during the cold half of the year. Most studies that separated these two types identified a super CC scaling in convective events [
6]. In addition, some studies, such as Vyver et al. [
7] and Ali et al. [
8], showed that using dew point temperature to estimate the scaling of extreme precipitation to temperature provided results closer to the sensitivity predicted by the CC relation compared to the use of temperature. Therefore, the calculations of the CC relations using both temperature and dew point were conducted in order to select the optimal one.
Several studies have shown that although most reanalysis data represent precipitation patterns fairly accurately, they struggle to identify the extremes, particularly in sub-daily timescales [
9,
10]. In this paper, the derived scaling equations for the station of Thessaloniki are used in order to investigate whether there can be a correction/improvement of the precipitation extremes obtained from the reanalysis data of the ERA5-Land dataset.
2. Data and Methods
Hourly precipitation data for the period 1951–2021 were used in this study from the station of the Department of Meteorology and Climatology at Aristotle University of Thessaloniki. The 90th, 95th, and 99th percentiles of hourly precipitation p (where p ≥ 0.1 mm) were calculated to define the hourly extremes. In order to determine the scaling rate, average daily temperature at 2 m above the ground and dew point temperature are used.
For the estimation of the scaling rates and the temperature threshold, the methodology of Vyver et al. [
7] is applied. This methodology uses quantile regression. Two models are calculated:
The CC model, which is calculated using a linear model by Wasko and Sharma [
11], where log(p) of the highest percentiles is computed using temperature and dew point as the predictor variables as follows:
with β as the slope, which determines the CC rate.
The second model is the CC+ model, which uses piecewise linear quantile regression [
12] to define the change point Tc (the temperature threshold), which divides the CC scaling rate (~7%/°C) and the super-CC or sub-CC rate as follows:
where Tc is the change point, β
1 corresponds to the CC scaling rate, and β
2 to the super-CC or sub-CC.
The statistical evaluation measure used in this study is the Bayesian Information Criterion (BIC) developed by Yu et al. [
13], where the model with the lowest BIC value is selected. Additionally, to check the success of the quantile regression model in representing the data for a certain quantile, the goodness-of-fit criterion is used, as defined by Koenker et al. [
14].
Moreover, to assess the ability of the derived equation to predict and improve the estimation of extremes, ERA5 Land data, with 9 km spatial resolution, for the period 1981–2021 were used. Hourly rainfall, temperature, and dew point data were obtained at the nearest grid point to Thessaloniki. The hourly data derived the daily mean temperature and dew point values, which were used as predictor variables to the equations estimating the rainfall based on the corresponding CC relation.
3. Results
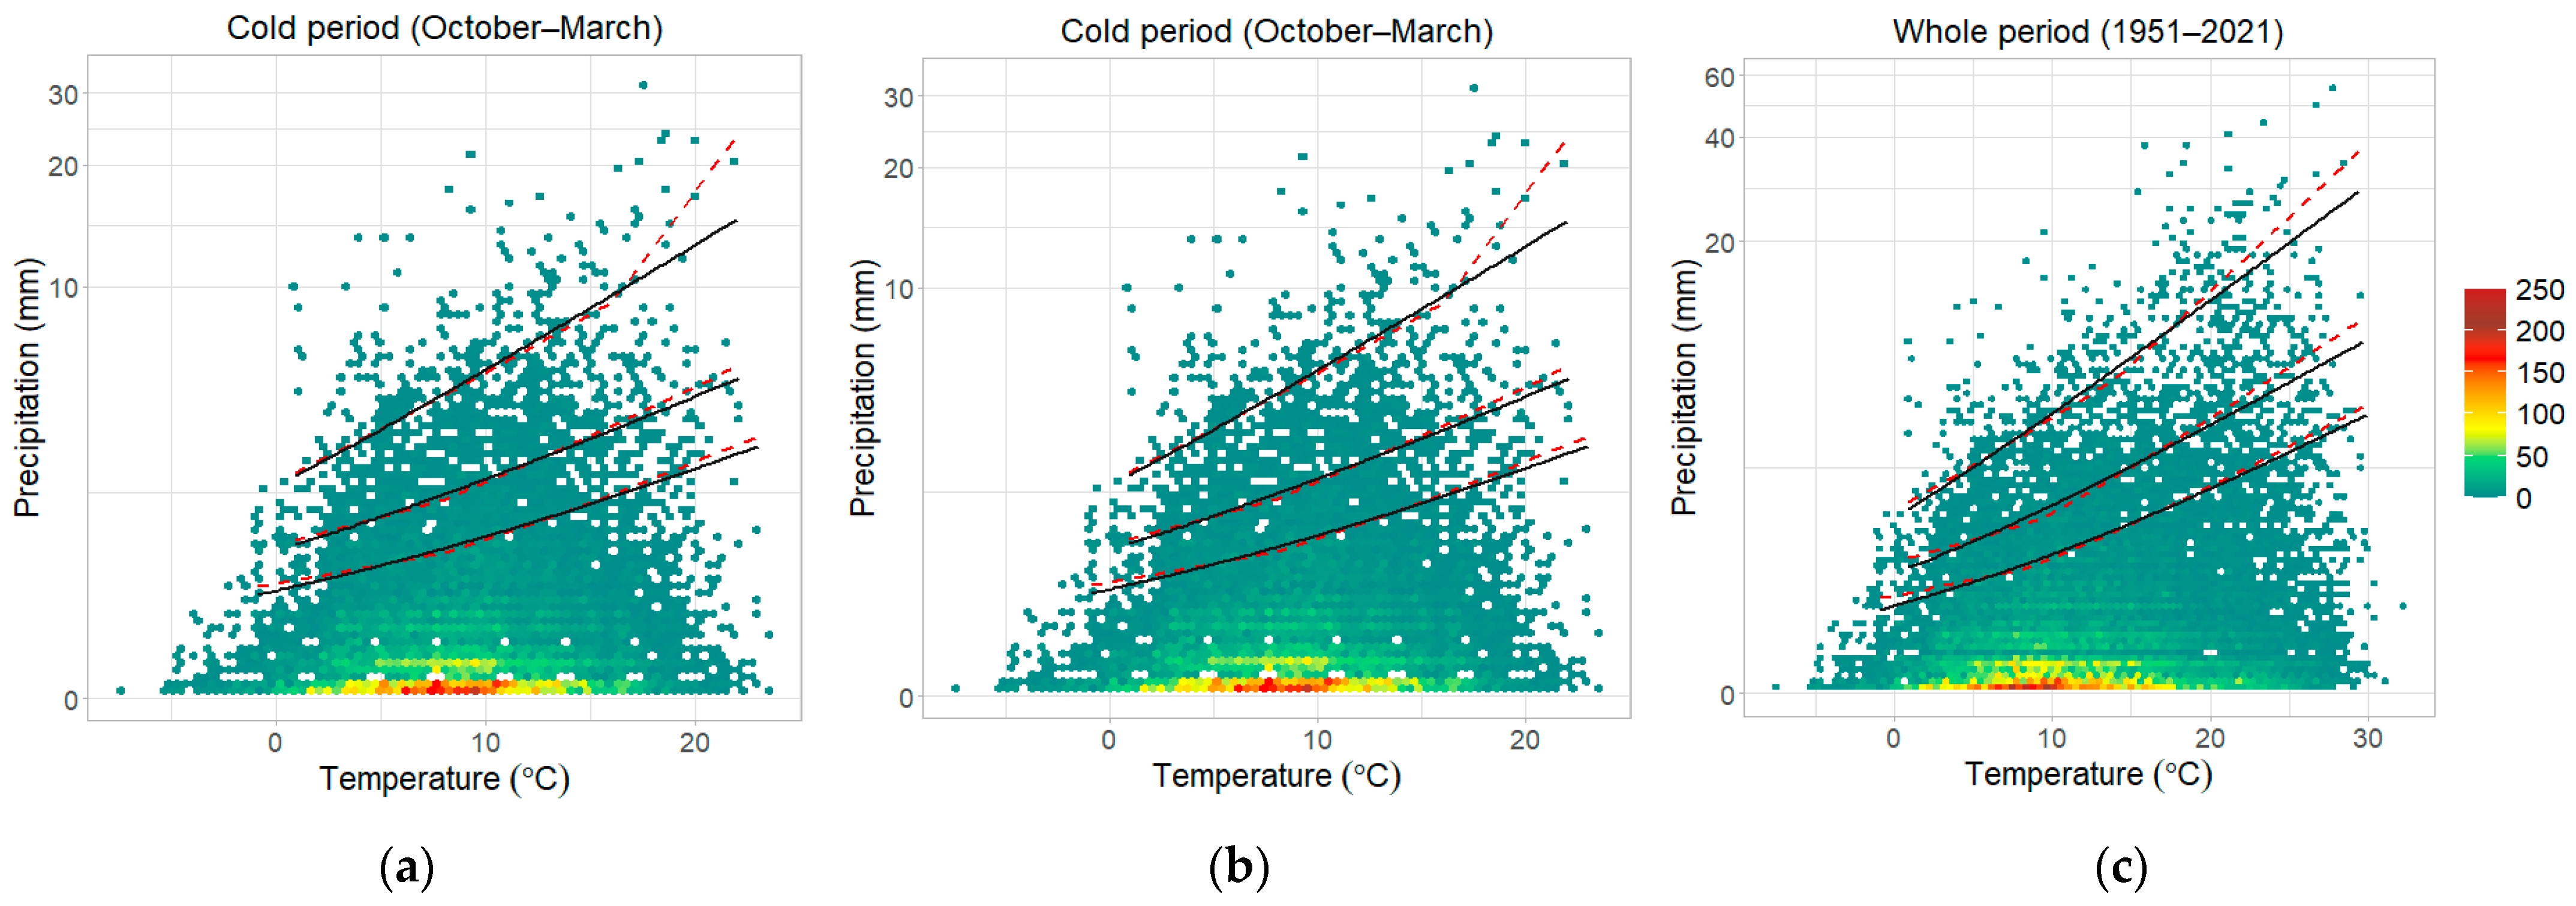
The two quantile regression models were applied to the observed precipitation data for three different time periods (whole series, warm and cold period), using both temperature and dew point as predictor variables. The goodness-of-fit criterion showed that the use of temperature as the predictor variable provides better results compared to the dew point for both models and for all time periods. Also, the predictive becomes higher for the highest percentiles. The quantile lines for the three different percentile values are shown in
Figure 1, along with the density plot of the non-zero precipitation of the three time periods. In
Table 1, the CC and CC+ scaling rate, as determined using the slope β (CC) and β
1, β
2 (CC+) of the quantile lines, is presented. The shaded β values are the best rate of the two models for each percentile and period according to the Bayesian information criterion (BIC).
The scaling rates for the cold season are equivalent to the annual rates for all percentiles. According to the BIC method, the two models have relatively small differences, which is also evident from the graph. When applied to the whole time period, the CC+ model is better for each percentile, but for the two subperiods, the CC model provides better results for P90 and P95, while for P99, the CC+ model is superior. Based on the scaling rates in
Table 1, it appears that for the station of Thessaloniki, P90 precipitation follows a sub-CC rate. P95 shows a rate closer to that defined by Clausius-Clapeyron (~7%/°C), especially during the warm period of the year, where a scaling larger than the CC rate (7.5%/°C) is obtained for temperatures higher than 15.1 °C. A larger scaling is observed at the 99th percentile, i.e., at the very extreme precipitation, where throughout the year, the scaling is close to the CC rate and higher (7.7%/°C during the whole period and 7.2%/°C in the cold season). Super-CC scaling is observed during the warm season with 8.7%/°C that reaches 9.9%/°C with the CC+ model. Super-CC scaling is also found in the overall period data with the CC+ model, giving a rate of 9.9%/°C for temperatures exceeding 14.1 °C. In addition, a scaling of 15.8%/°C is observed in the winter season, however, because the temperature threshold is very high (16.1 °C), it does not seem to represent the data accurately.
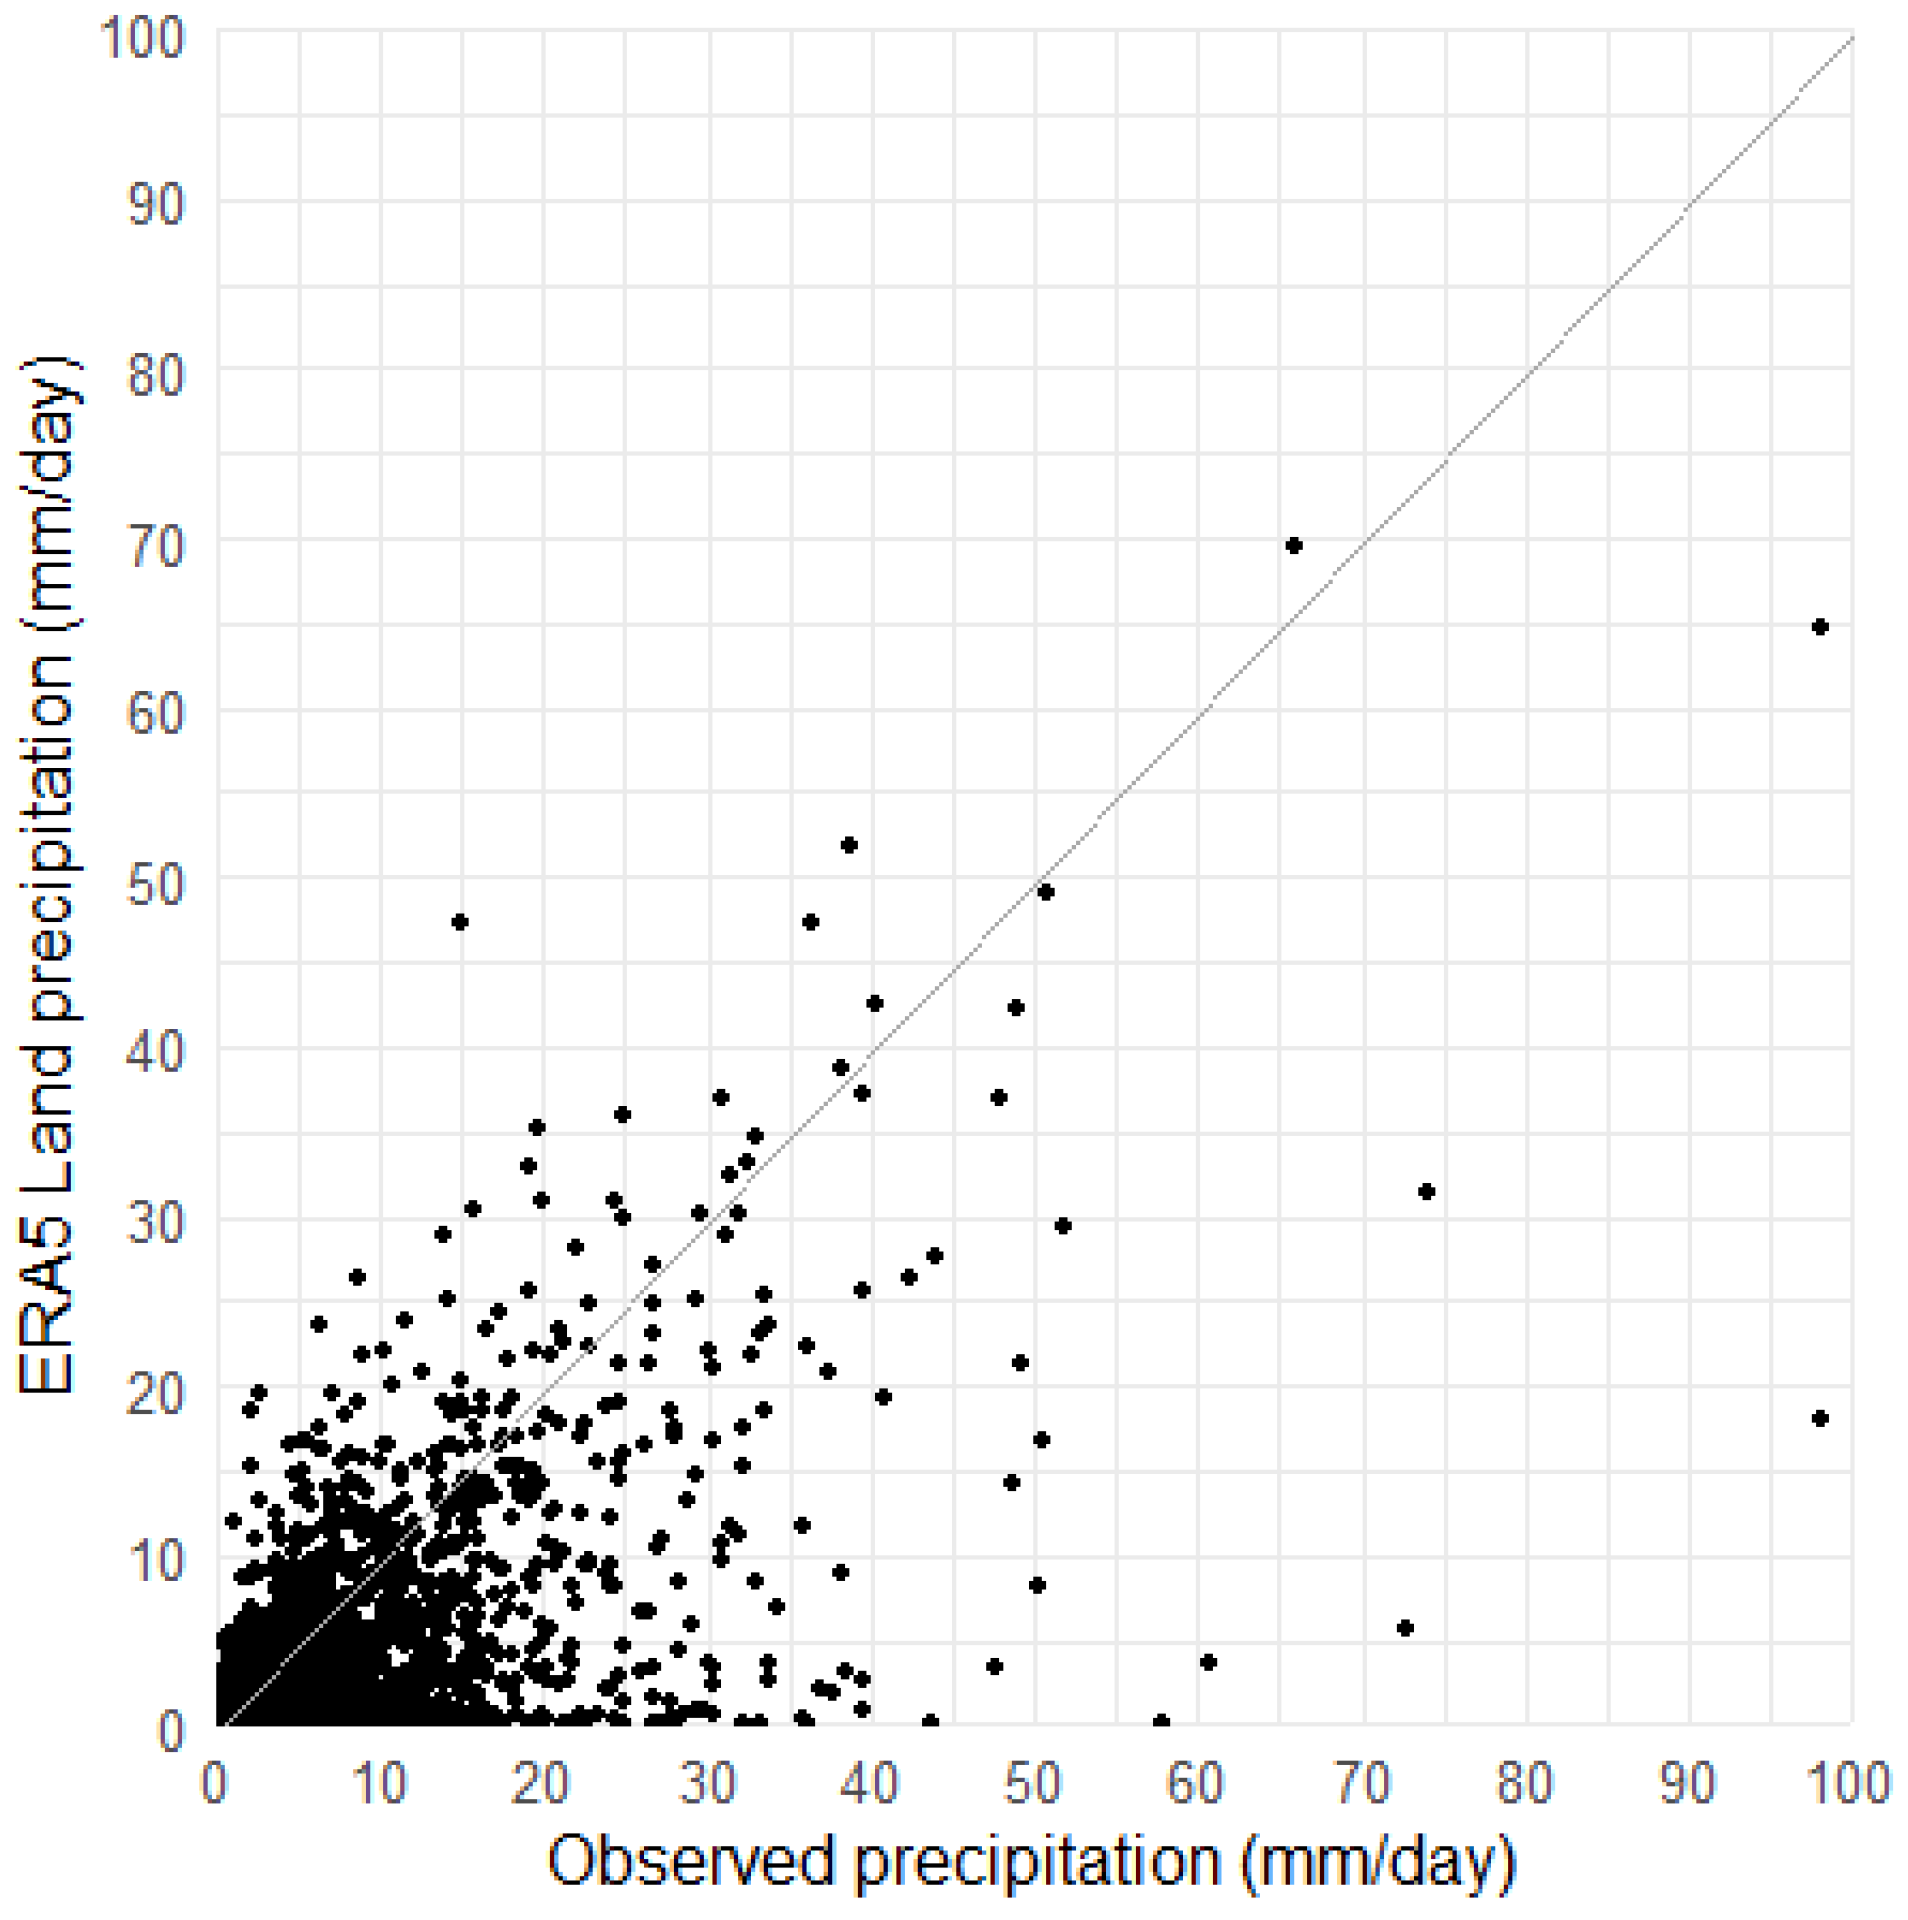
In order to perform a quick evaluation of the ability of ERA5 Land to accurately represent precipitation, a scatterplot of the cumulative daily rainfall was constructed, comparing the ERA5 daily rainfall with the observational data for the period 1981–2021 (
Figure 2). Of the total 3711 days on which rainfall has been recorded in the observations, a significant number is underestimated via ERA5 Land. Specifically, 82.2% of the cases underestimate precipitation since they lie below the straight line x = y. Regarding the hourly extremes, after calculating the values exceeding the 90th, 95th, and 99th percentile for the period 1981–2021 from the station’s data against those of ERA5, they were accumulated per day. This was carried out in order to take into account any time deviations in the recording of hourly extremes from ERA5 (e.g., to record the event between 2 h or one hour before/after it was recorded at the station). With this approach, a record of the daily rainfall extremes was created derived from the hourly extremes.
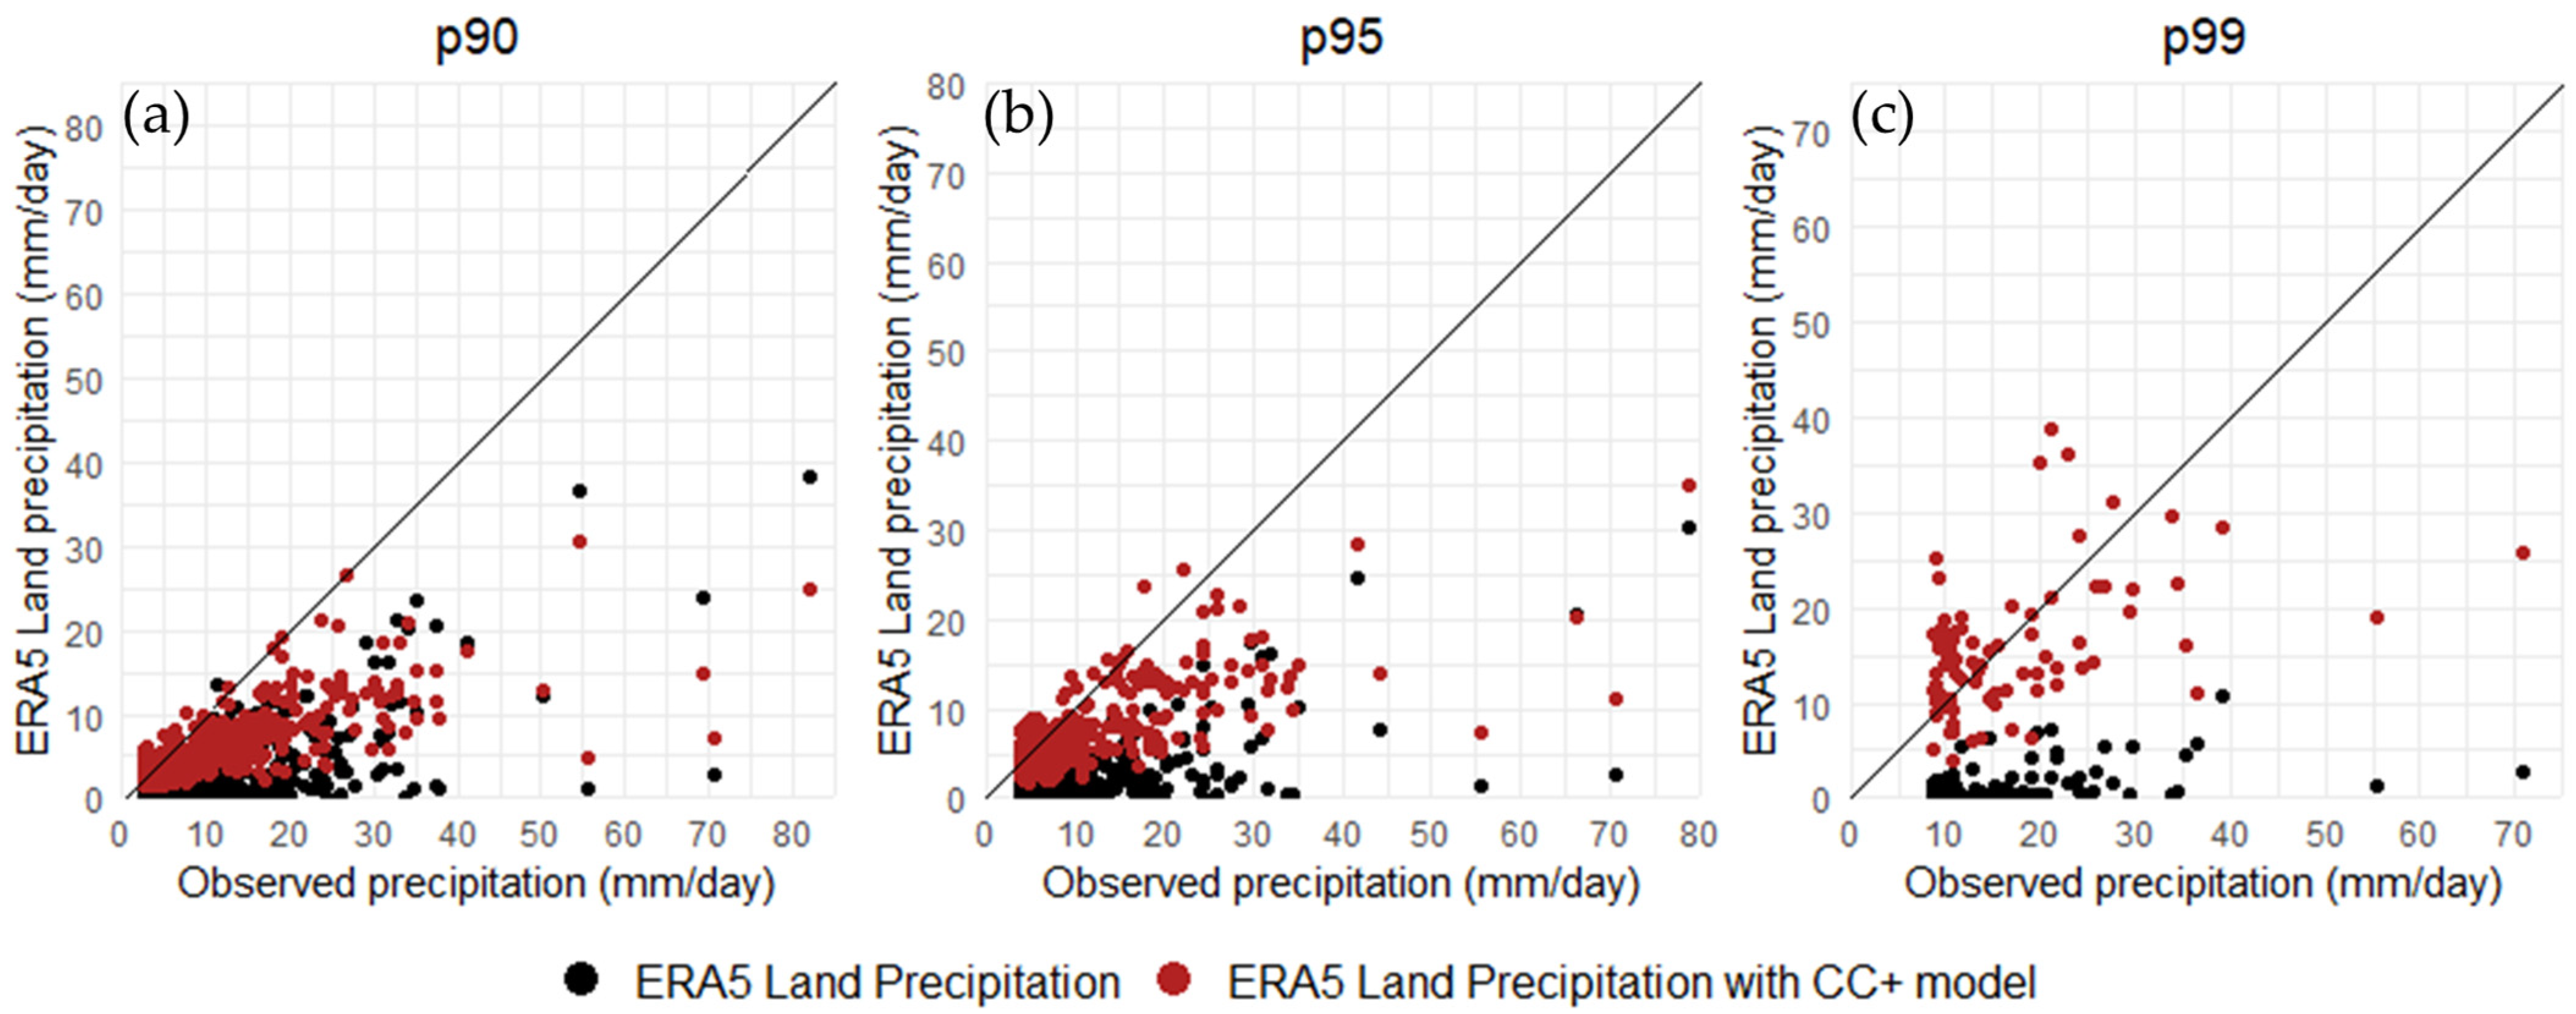
To validate the CC and CC+ equations on the underestimation of the reanalysis data extremes, the equations were applied to the hourly data from the ERA5 Land dataset on the dates when extreme hourly precipitation was recorded at the station. More specifically, for the days on which hourly precipitation exceeded the 90th, 95th, and 99th percentile for the period 1981–2021, the daily mean temperature data from the ERA5 Land data were selected, applied to the CC and CC+ equations, and the simulated rainfall was obtained.
Figure 3 presents the scatterplots of the extreme rainfall events as recorded via ERA5 Land (black dots) compared to the observed values and the corresponding simulated rainfall (red pots) as estimated by the linear CC+ model.
Comparing the observational data with ERA5 Land reveals that almost all extremes are underestimated. In particular,
Figure 3 shows that all ERA5 Land data (black dots) are below the line y = x, meaning that the observed values are higher. A significant improvement in the extreme values is observed. In particular, the underestimation rate drops from 98.8% to 85.8% for the 90th percentile, from 100% to 76.8% for the 95th, and from 100% to 51.9% for the 99th percentile. In addition, there is an improvement in the correlation between the two datasets. Specifically, the correlation of p90 increases from 0.69 to 0.76, for p95 from 0.63 to 0.71, while for p99, it remains almost the same (from 0.36 to 0.37).
4. Conclusions
Two quantile regression models were applied to the observational data from the station of Thessaloniki to estimate the scaling of the extremes with temperature. Both temperature and dew point were tested as predictor variables, with temperature being slightly superior according to the goodness-of-fit criterion. This is in contrast with Vyver et al. [
7], where dew point provided a better fit for the Western European and Scandinavian stations. Between the two models, the differences are small, with the CC+ model showing a slightly better fit to the data, indicating that there is a change point but with a small change in the scaling rates. The annual and cold season scaling rates are similar, mainly because the majority of rainfall events occur during the cold period. The extreme rainfall events of the 90th and 95th percentile exhibit sub-CC scaling except for the warm period, where the rate approaches the one defined by the Clausius–Clapeyron equation. It is noticeable that the highest extreme hourly episodes follow CC scaling up to super-CC, especially during the summer season. This super-CC scaling found in the warm season is in agreement with other studies suggesting that convective events follow scaling with temperature that exceeds 7%/°C [
6].
The evaluation of the ERA5 Land hourly precipitation fields revealed that the reanalysis data present an underestimation of the daily rainfall, especially the sub-daily extremes. After applying the CC model on the ERA5 data the extreme precipitation of ERA5 shows significant improvement, especially the highest extreme precipitation (>99th percentile).
It is proved that the CC method can be used as a correction tool for extreme rainfall episodes when they are not adequately captured by the reanalysis data. Moreover, it can be used in forecasting extreme precipitation occurring at a particular time but also to assess the likelihood of extreme events leading to flooding in a future, warmer climate. The main limitation is that the scaling relations vary depending on the region, and the applicability of the method is restricted to a very local scale. More research is, therefore, needed in this area.


