1. Introduction
Aviation-scale turbulence is considered one of the major causes that can affect flight safety and lead to weather-related accidents. The occurrence of abrupt changes in altitude during an en-route flight due to a severe turbulence event can lead to injuries for both passengers and crew members [
1]. The nowcasting of the atmospheric conditions that trigger turbulence by aviation meteorologists or pilots is an important factor that can improve flight safety. Locating upper-level turbulence in satellite images is associated with patterns of the phenomena that trigger turbulent events. Turbulence is typically categorized by its sources or the conditions under which it is detected: convection-induced turbulence (CIT), near-cloud turbulence (NCT), mountain wave turbulence (MWT) and clear-air turbulence (CAT) [
2]. Of the above, CAT is considered the most challenging to be detected in satellite imagery, considering that there are no visual clues of possible turbulence for pilots to initiate turbulence avoidance procedures.
Tropopause folding is a feature that is widely used as an input in several satellite-derived turbulence products, through its dry intrusion depiction in water vapor channels. The gradient of upper-level humidity is used as an input in tropopause folding turbulence products by NOAA NESDIS [
3] using Ch08 (6.2 μm) of the GOES-R Advanced Baseline Imager, and by NWC SAF [
4] with Ch05 (6.2 μm) of the Spinning-Enhanced Visible and Infrared Imager (SEVIRI) of the Meteosat Second Generation (MSG), which indicate where turbulence might be experienced. Cumulonimbus clouds are well-known sources of turbulence [
5], while transverse cirrus clouds are indicators of aviation-scale turbulence [
6] as they are associated with large horizontal wind shear [
7].
In this study, we utilize in situ observations of turbulence from aircraft that are available from the Aircraft Meteorological Data Relay (AMDAR) program. Over Europe, turbulence is recorded as Derived Equivalent Vertical Gust (m/s) (DEVG), which is an aircraft-independent metric [
8,
9].
2. Data and Methodology
We study the upper-level turbulence (ULT) events that can affect flight safety, over 20.000 ft (FL200). The severity of turbulence is qualifiedly connected with DEVG values [
9], as shown in
Table 1. Therefore, turbulence records with DEVG > 4.5 m/s, which are considered heavy–severe (H–S), are used. The upper-level synoptic analysis from 500 hPa charts (not shown) showed that during the first ten days of November 2009, an upper-level cyclonic circulation prevailed over Europe, with successive troughs and an extended upper-level low, centered over Italy. The circulation changed thereafter, with prevailing upper-level ridge in south of Europe and successive barometric lows affecting the northwestern parts of Europe. During this period, 92 H–S ULT events were recorded over Europe. This constitutes 2.5% of the total observations of the aircraft (
Table 1), which is in the climatological turbulence range as described in several climatological studies [
10,
11].
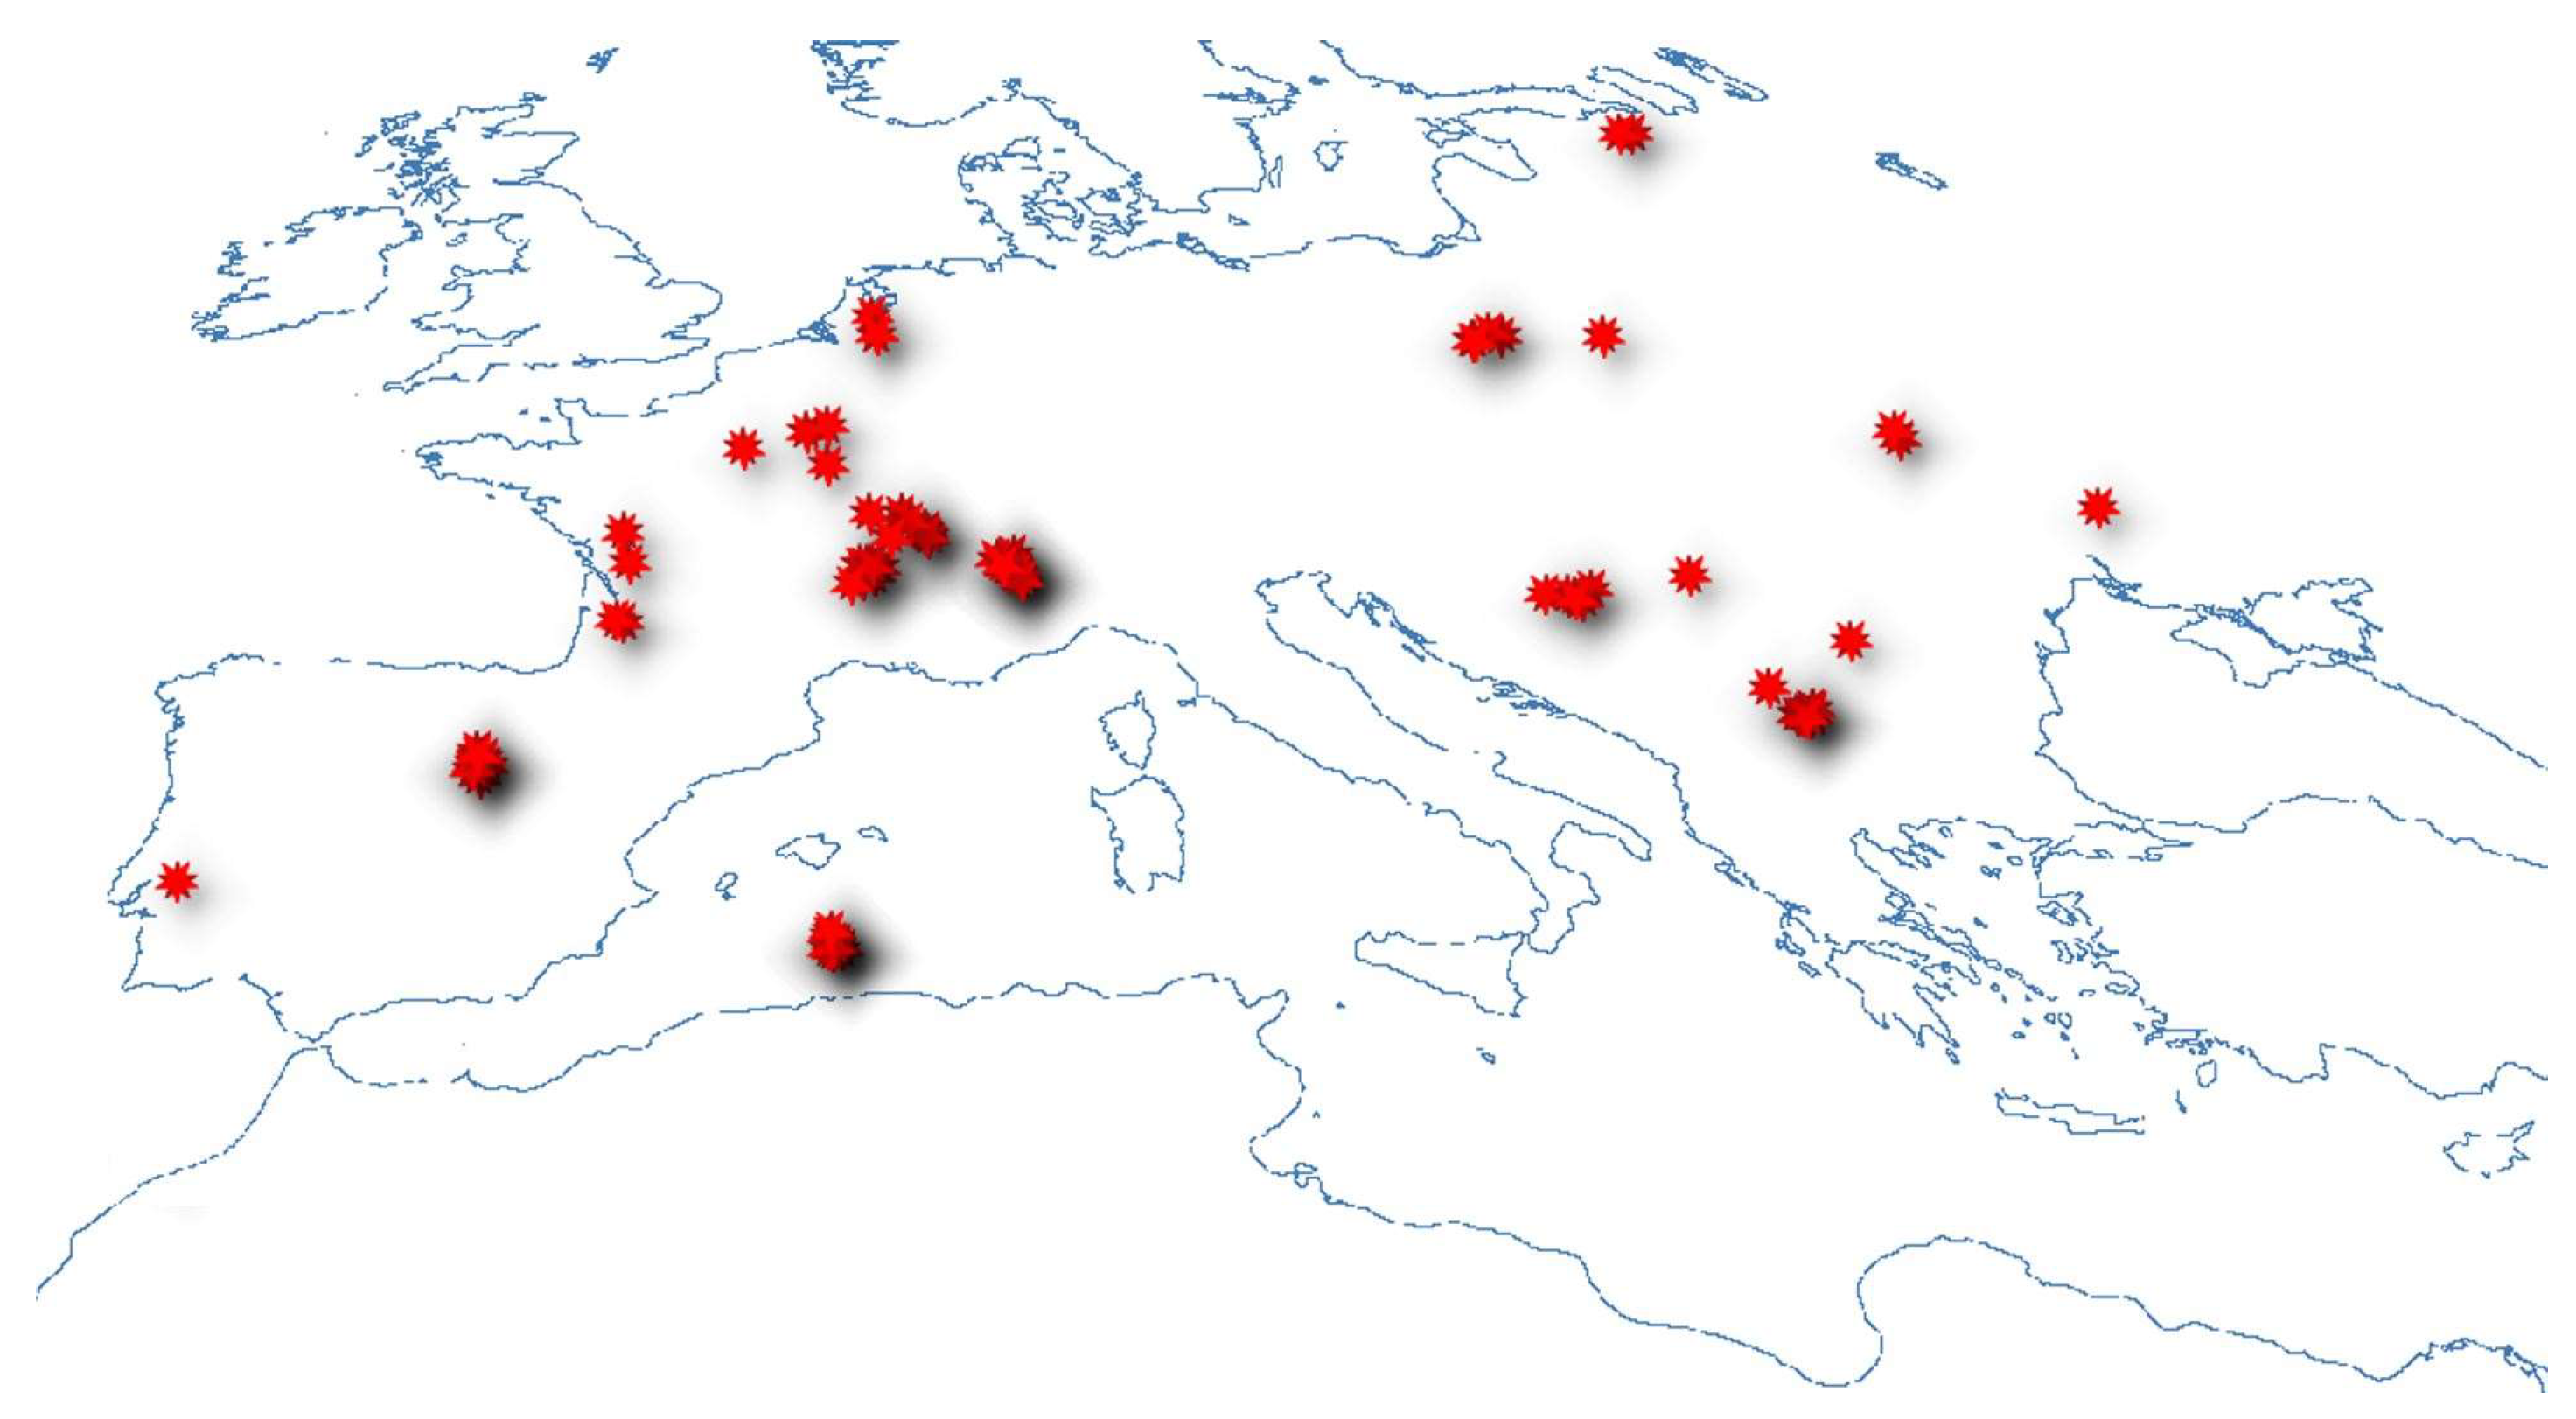
Figure 1 shows the distribution of the H–S ULT observations during November 2009, over 20.000 ft. To associate the ULT events with the prevailing weather conditions, every ULT event is visualized with the corresponding satellite data time slot from MSG SEVERI radiometer.
Our goal is to evaluate indicators from the in situ ULT events during different types of turbulence, including CAT, NCT, CIT and over extended cloud patterns. Therefore, the encounter percentage of the CAT events and the tropopause folding contribution are studied. Moreover, events related to NCT, CIT and transverse cirrus bands are presented.
MSG SEVIRI images are used to detect features of interest. We present typical examples from SEVIRI WV6.2 μm, which is used to detect the tropopause folding, and Airmass RGB, which is used to locate the high-level thick clouds, which stand out in bright whites in relation to mid-level and low-level clouds [
12]. SEVIRI RGB microphysics [
13] and RGB Natural Color [
14] are used to present CIT and NCT events during daytime.
3. Results
Three types of environmental conditions in which the turbulent event was recorded by the aircraft were monitored. If an event is recorded in clear sky with no cloud formations having tops exceeding 20.000 ft, it is considered a CAT event. If an event is recorded within a distance of 50 km from a cloud formation, usually an isolated cumulonimbus cloud, it is characterized as an NCT event. The remaining events, recorded over areas of extended cloud formations are referred hereafter as OCT events.
Table 2 presents the percentage records of each category, during November 2009. The analysis shows that the majority of the ULT events, accounting for 54.2% of the total H–S ULT records, took place over cloudy areas, followed by events in clear-air environment which accounted for 38.1%. The smallest percentage is found near isolated cumulonimbus clouds, which may be because they are well-known sources of severe turbulence, and pilots try to avoid them for flight safety.
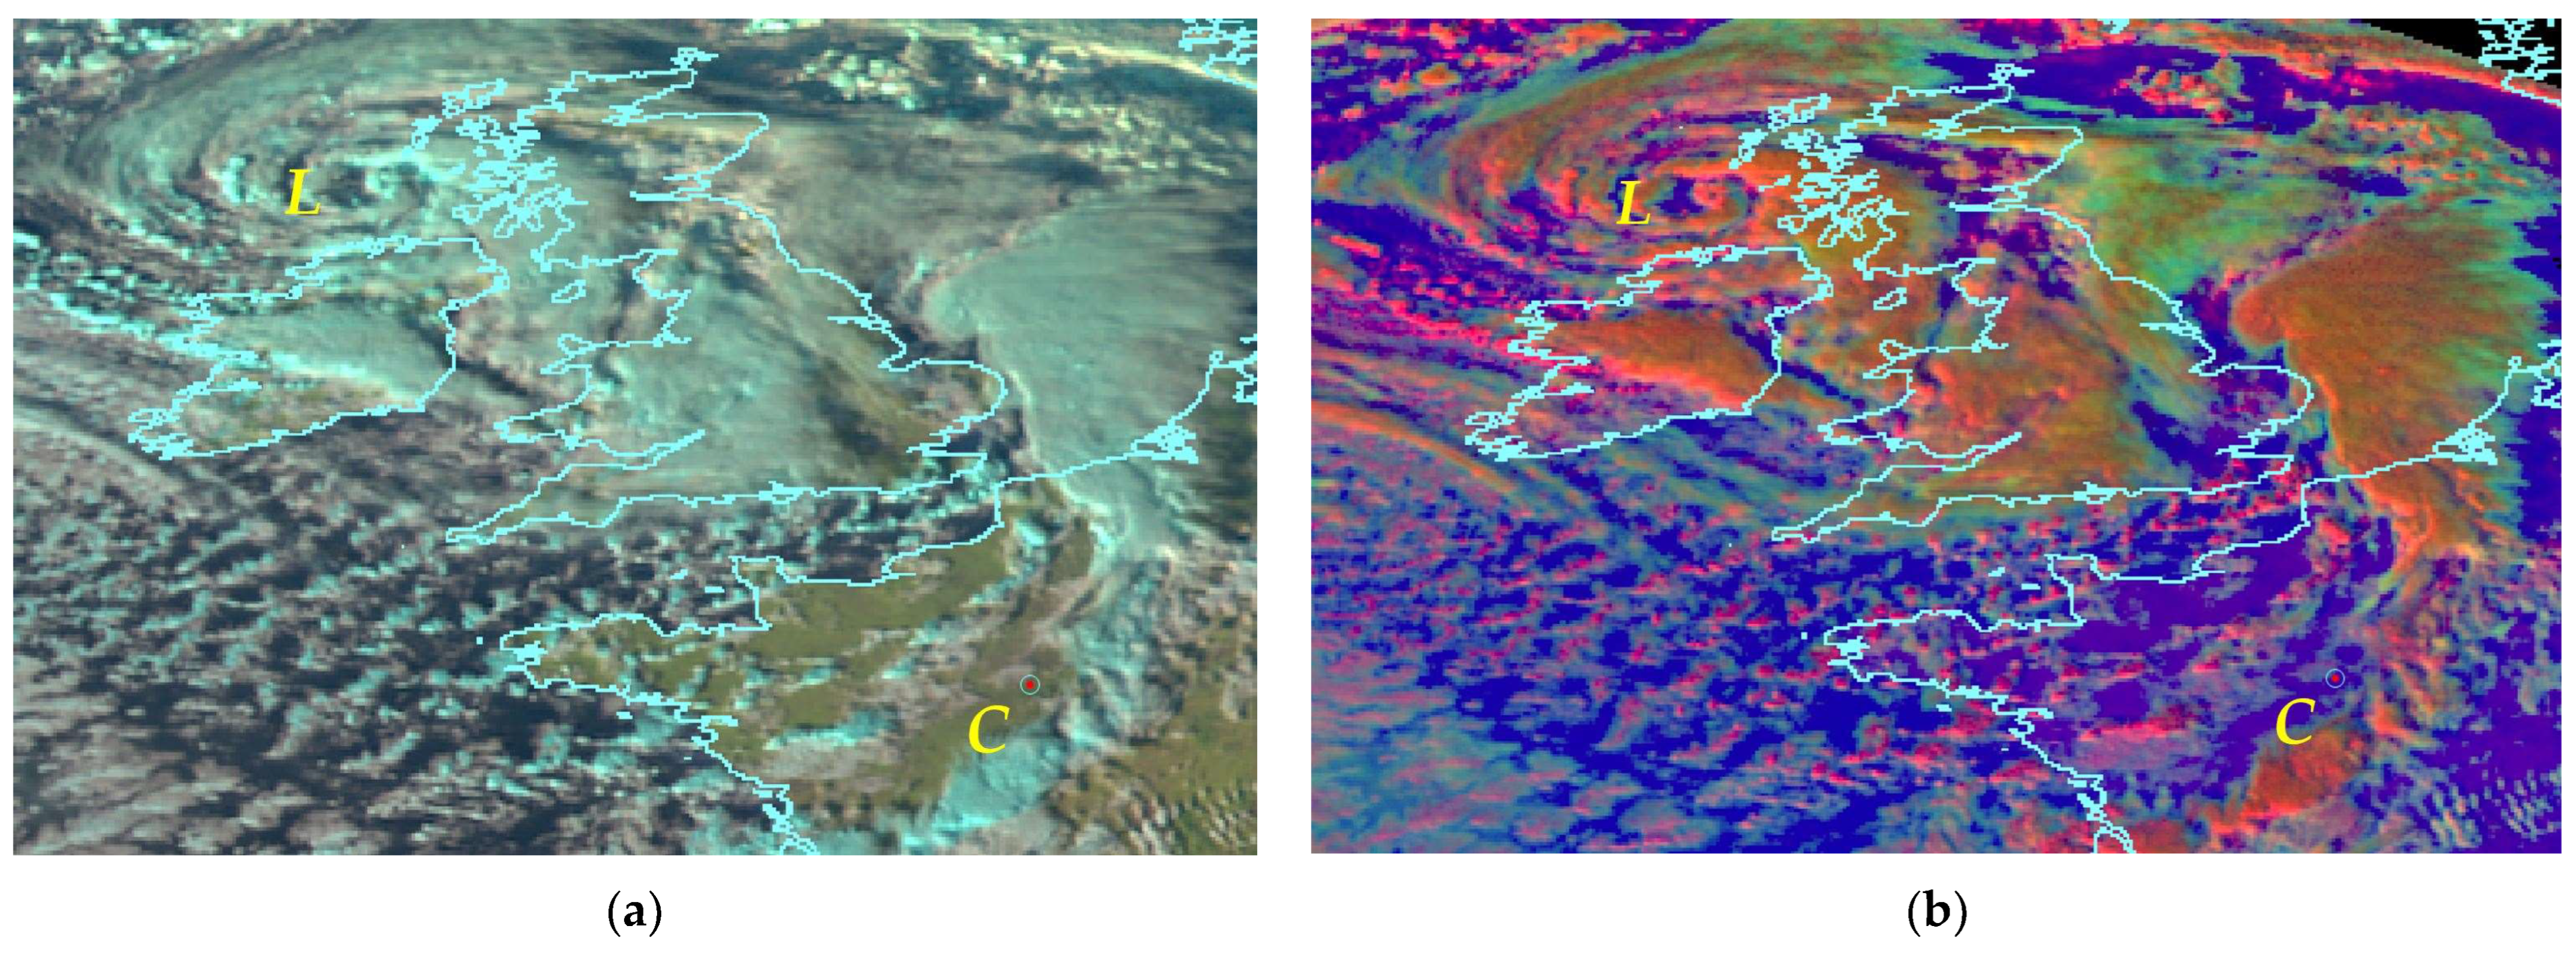
Figure 2 shows a typical NCT event (red circled dot) recorded over France in clear air but in the proximity of isolated convective clouds “C”, during a mature vortex “L”, centered in the north of Ireland.
3.1. Clear-Air Turbulence—Tropopause Folding
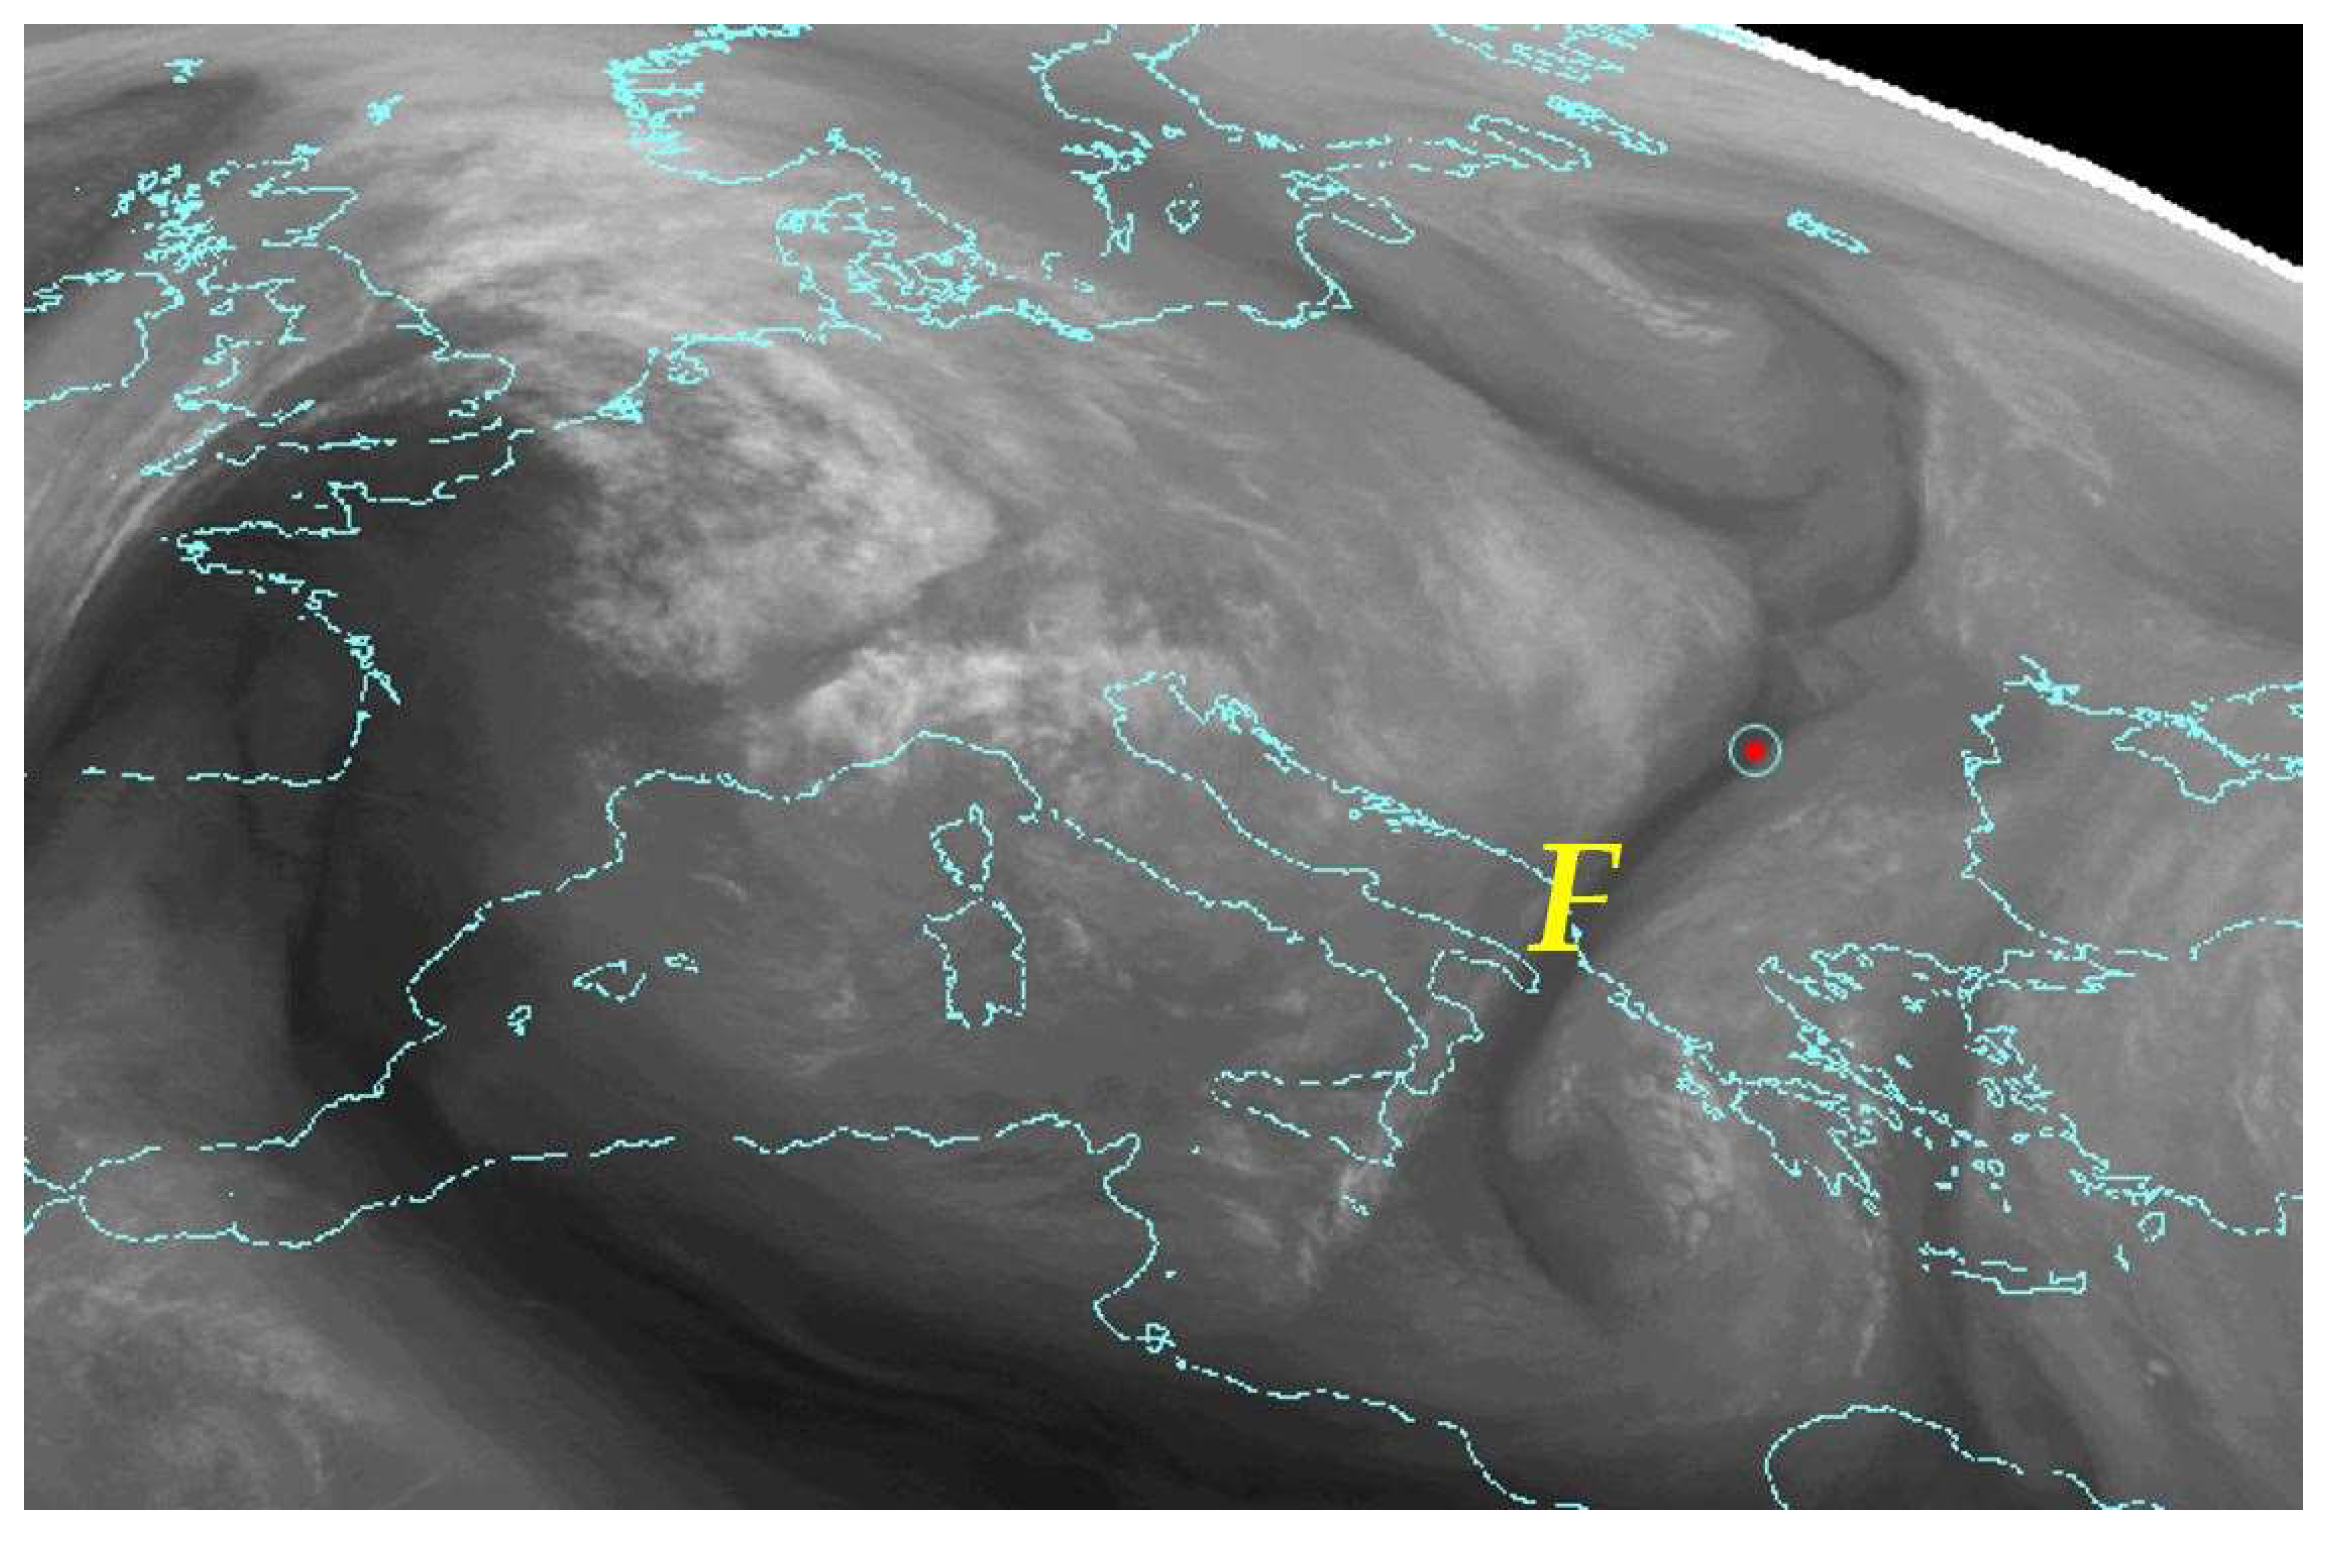
CAT turbulence events are very challenging for pilots and aviation meteorologists to detect, as there are no visible clues to indicate the possibility of turbulence. Therefore, the tropopause folding effect is considered. The MSG WV6.2 μm is used, in which the tropopause folding is clearly visible. The dry intrusion of a folding can be observed as a dark striped area, where the jet streak lowers the upper-level humidity, providing strong large-scale spatial gradients in brightness temperature. A typical example is shown in
Figure 3, where the folding “F” is crossing the Balkans, in which the event (circled red dot) is recorded on the outflow of a comma cloud. During November 2009, the frequency encounter of the tropopause folding in clear-air environment accounted for 57.1% of the total CAT events, indicating its potential use as a nowcasting indicator of possible turbulence in clear-air weather.
3.2. Cloud Patterns
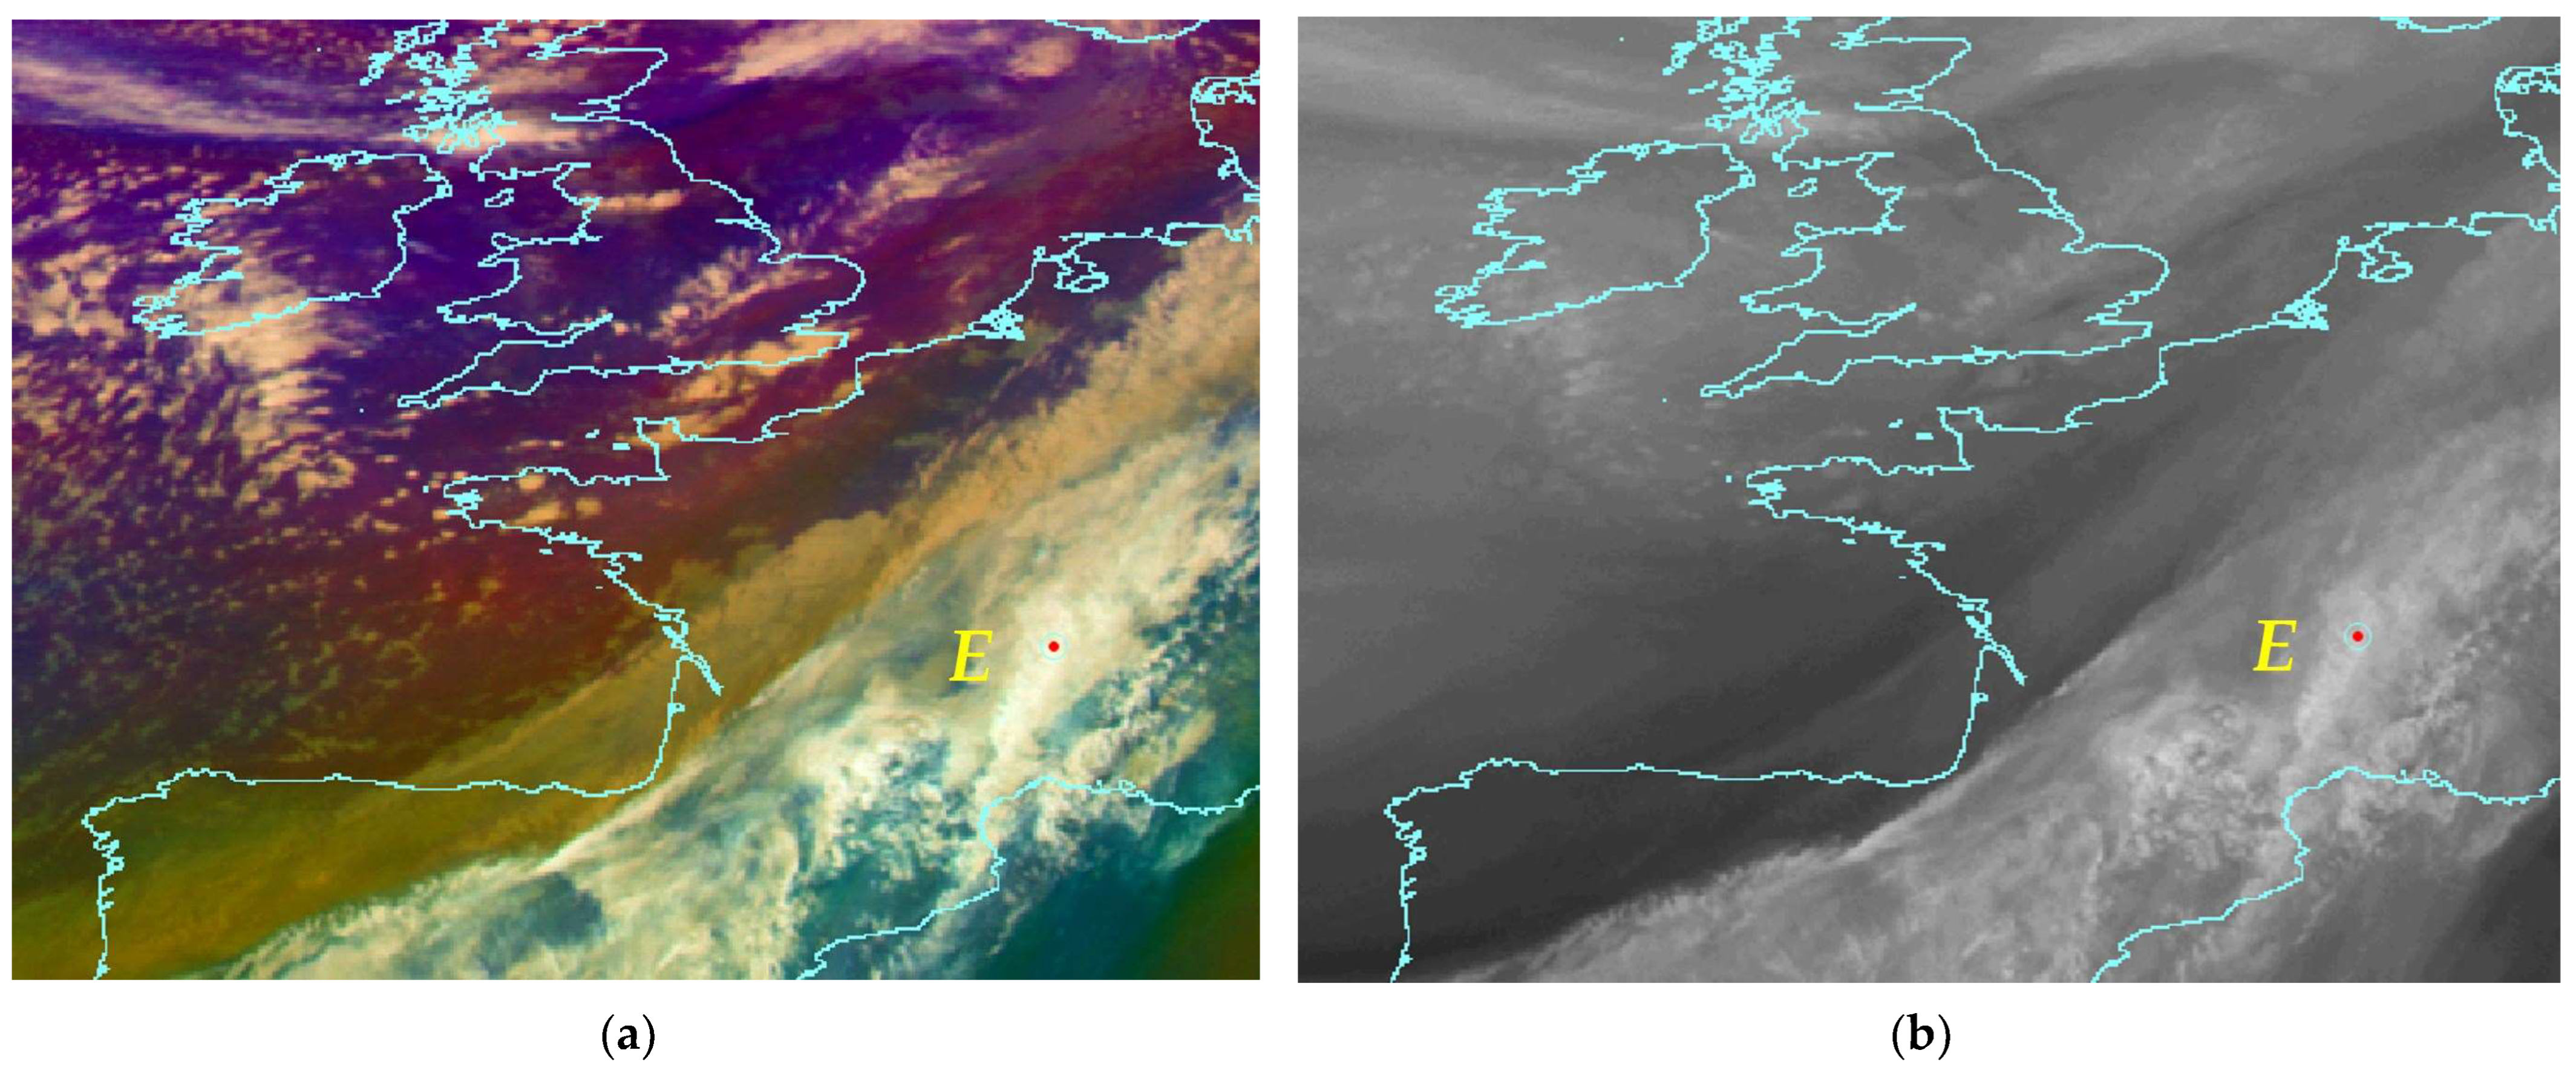
The majority of the ULT events are recorded over extended cloudy areas. Two well-known patterns that are often related to turbulence events are monitored. It was found that 26% of the OCT events were recorded over embedded cumulonimbus clouds, while 38% of the OCT recordings are related to transverse cirrus bands. This shows that these patterns combined account for 64% of the H–S ULT events over cloudy areas.
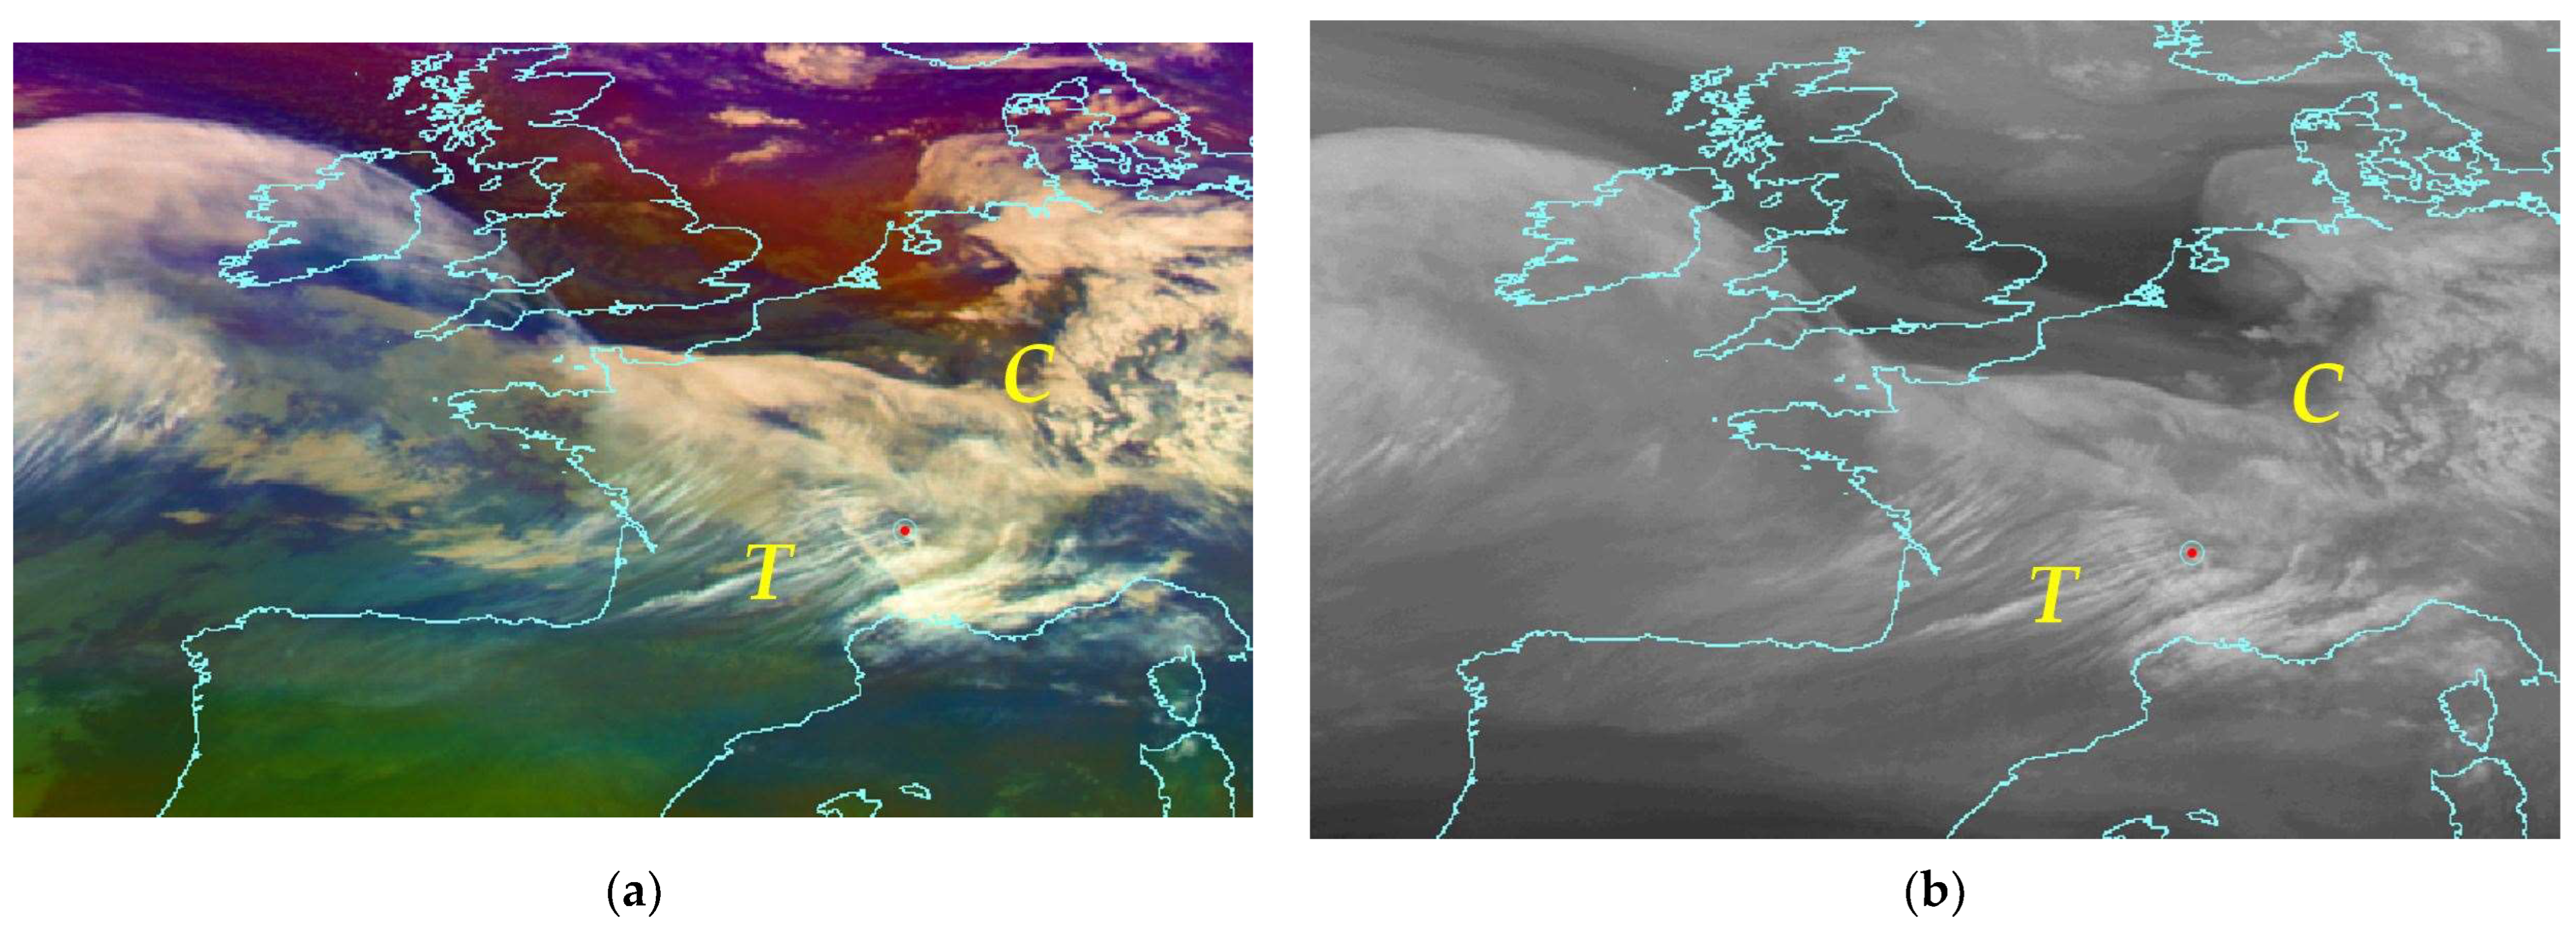
Figure 4 depicts a typical H–S ULT event over France associated with transverse cirrus bands “T”. The stripes are almost perpendicular to the northwestern flow of the jet stream, and they are orientated radially away from the convective clouds “C”.
Figure 5 depicts a typical H–S ULT event over embedded cumulonimbus clouds in a baroclinic conveyor belt.
4. Conclusions-Discussion
The present study analyzed 92 H–S ULT events from in situ aircraft observation during November 2009 over Europe. The following points of interest were identified:
Overall, 54.2% of the turbulent events were recorded over cloudy-patterned areas. The two prominent cloud types associated with these events were transverse cirrus band, accounting for 38% of the OCT, and embedded cumulonimbus clouds, which accounted for 26%.
Clear-air turbulence events were recorded at a frequency of 38.1%. In those cases, 57.1% were monitored in the tropopause folding area.
The occurrence of H–S ULT events near isolated cumulonimbus clouds was found to be 7.6%. This low percentage may be attributed to the avoidance procedures adopted by pilots for flight safety.
Overall, the study revealed the challenges associated with nowcasting of heavy–severe upper-level turbulence. In clear-sky conditions, the tropopause folding is a useful indicator of turbulence, but further research is needed. Over extended cloudy areas in satellite imagery, patterns associated with turbulence can aid pilots and aviation forecasters in estimating turbulence-prone areas.
Author Contributions
Conceptualization, V.T.G. and H.F.; methodology, V.T.G. and H.F.; validation, V.T.G. and H.F.; formal analysis, V.T.G. and H.F.; investigation, V.T.G. and H.F; resources, V.T.G. and H.F.; data curation, V.T.G. and H.F.; writing—original draft preparation, V.T.G.; writing—review and editing, H.F.; visualization, V.T.G.; supervision, H.F; project administration, V.T.G. and H.F.; All authors have read and agreed to the published version of the manuscript.
Funding
This research received no external funding.
Institutional Review Board Statement
Not applicable.
Informed Consent Statement
Not applicable.
Data Availability Statement
No new data were created.
Conflicts of Interest
The authors declare no conflict of interest.
References
- Eurocontrol, Severe Weather Risk Management Survey Report. European Organisation for the Safety of Air Navigation. 2013. Available online: https://www.eurocontrol.int/sites/default/fles/article/fles/severe-weather-risk-management-survey-2013.pdf (accessed on 22 April 2023).
- Sharman, R.; Lane, T. (Eds.) Aviation Turbulence. Processes, Detection, Prediction; Springer International Publishing: Cham, Switzerland, 2016. [Google Scholar]
- Wimmers, A.; Feltz, W. Tropopause Folding Turbulence Product, Algorithm Theoretical Basis Document v2.0. PublisherNOAA NESDIS, Center for Satellite Application and Research: 2010. Available online: https://www.nwcsaf.org/documents/20182/30813/Aviation_Turbulence_v1.0_no_color.pdf/52fb7ca4-b8c3-4b8e-a124-6534e2e329b0 (accessed on 22 April 2023).
- Jann, A.; Wirth, A.; Zeiner, B. Algorithm Theoretical Basis Document for the “Automatic Satellite Image Interpretation—Next Generation” Processor of the NWC/GEO, issue 2.1, Jan 2019. Available online: https://www.nwcsaf.org/Downloads/GEO/2018/Documents/Scientific_Docs/NWC-CDOP2-GEO-ZAMG-SCI-ATBD-ASII_v2.0.pdf (accessed on 22 April 2023).
- Federal Aviation Administration. Weather-Related Aviation Accident Study 2003–2007. 2013. Available online: https://www.asias.faa.gov/i/studies/2003-2007weatherrelatedaviationaccidentstudy.pdf (accessed on 22 April 2023).
- Elrod, G.P. A Decision Tree Approach to Clear Air Turbulence Analysis Using Satellite and Upper Air Data. United States, National Environmental Satellite, Data, and Information Service, NOAA Technical Memorandum NESDIS; 23. 1989. Available online: https://repository.library.noaa.gov/view/noaa/19299 (accessed on 22 April 2023).
- Galvin, J.F.P. The weather and climate of the tropics: Part 2—The subtropical jet streams. Weather 2007, 62, 295–299. [Google Scholar] [CrossRef]
- Sherman, D.J. The Australian implementation of AMDAR/ACARS and the use of derived equivalent gust velocity as a turbulence indicator. In Structures Reports No 418; Department of Defence, Defence Science and Technology Organization, Aeronautical Research Laboratories: Melbourne, Australia, 1985. [Google Scholar]
- World Meteorological Organization. Aircraft Meteorological Data Relay (AMDAR) Reference Manual (WMO-No. 958); World Meteorological Organization: Geneva, Switzerland, 2003. [Google Scholar]
- Wolf, J.K.; Sharman, R. Climatology of upper-level turbulence over the contiguous United States. J. Appl. Meteorol. Climatol. 2008, 47, 2198–2214. [Google Scholar] [CrossRef]
- Gerogiannis, V.T.; Feidas, H. An 11-year analysis of in situ records of aviation-scale turbulence over Europe. Theor. Appl. Climatol. 2021, 145, 941–953. [Google Scholar] [CrossRef]
- SEVIRI Airmass RGB Quick Guide, EUMETRAIN. Available online: https://www.eumetsat.int/media/41623 (accessed on 22 April 2023).
- SEVIRI Day Microphysics RGB Quick Guide, EUMETRAIN. Available online: https://www-cdn.eumetsat.int/files/2020-04/pdf_rgb_quick_guide_day_micro.pdf (accessed on 22 April 2023).
- SEVIRI Natural Color RGB Quick Guide, EUMETRAIN. Available online: https://www.eumetsat.int/media/41629 (accessed on 22 April 2023).
| Disclaimer/Publisher’s Note: The statements, opinions and data contained in all publications are solely those of the individual author(s) and contributor(s) and not of MDPI and/or the editor(s). MDPI and/or the editor(s) disclaim responsibility for any injury to people or property resulting from any ideas, methods, instructions or products referred to in the content. |
© 2023 by the authors. Licensee MDPI, Basel, Switzerland. This article is an open access article distributed under the terms and conditions of the Creative Commons Attribution (CC BY) license (https://creativecommons.org/licenses/by/4.0/).
