1. Introduction
Polar stratospheric clouds are a unique atmospheric phenomenon occurring over the Earth’s polar regions. These clouds form at high altitudes in the stratosphere during the polar winter and early spring, when temperatures drop to extreme cold levels, below ~195 K. The stratosphere is very dry, in contrast to the troposphere, thus not allowing clouds to easily form. That is why low temperatures are crucial for the formation of PSCs, as they create conditions suitable for the condensation and crystallization of various substances. There are three main types of PSCs, based on their characteristics: Type-1a PSCs (composed mainly of non-spherical nitric acid trihydrate—NAT—crystals), Type-1b PSCs (composed of liquid supercooled ternary solution—STS—droplets), and Type-2 PSCs (primarily consisted of water ice crystals) [
1]. In the present study, we do not separate the clouds into their three different types, but we investigate them as a whole.
Polar stratospheric clouds play a crucial role in the depletion of stratospheric ozone. As the unreactive chemical compounds CLONO2 and HCL react on the frozen surface of PSCs, under sunlit conditions, they convert to active forms which can destroy the ozone rapidly [
2]. There are many differences between Antarctica and the Arctic, including ozone loss, stratospheric temperatures, and the occurrence of PSCs. In contrast to the Antarctic, Arctic PSC occurrence is highly variable from year to year not following a climatological mean pattern [
3]. Hence, each PSC season differs distinctly, explaining why ozone loss varies that much from year to year. The significant spatial and temporal variability of PSCs along with their important role in ozone depletion are the reasons for intensive research preferably enabling large spatiotemporal coverage, which is ensured by contemporary satellite data. This study investigates the spatial and temporal variability of PSCs and stratospheric temperatures during the period 2006–2021.
2. Data and Methodology
The data used for this study are obtained from the CALIOP lidar level-2 PSC Mask-Version-2.00 products during the 16-year period, starting from July 2006 to March 2021. CALIOP is the primary instrument on the CALIPSO satellite. It is a dual-wavelength polarization-sensitive lidar that provides unprecedentedly high-vertical-resolution profiles of backscatter coefficients at 532 and 1064 nm [
4]. The CALIPSO lidar level 2 data product ensemble for PSCs describes not only the spatial distribution, but also the composition, and optical properties of 121 PSC layers, which are observed by the CALIPSO lidar, CALIOP. The detection of PSCs is limited only to nighttime observations in order to reduce the external noise produced by the background light during daytime.
The original level 2 data were re-gridded at 1° × 1° latitude–longitude, for all the equally divided 121 vertical layers from 8.5 to 30 km, at 5 km-horizontal and 180 m-vertical resolution. The observations were available for latitudes and time periods that are characteristic for PSCs, namely: north of 50° N (December–March) and south of 50° S (May–October). In this case, the observation latitude does not exceed 82.5° N in both the Northern and Southern Hemispheres. From the obtained statistics, the monthly mean areal coverage and fractional cloud cover of PSCs were estimated. Ancillary parameters, such as the tropopause height and atmospheric temperature based on the MERRA-2 reanalysis were also included in CALIOP data products.
Because the tropopause height is quite difficult to determine in the polar regions, mainly during the polar nights [
5], using the MERRA-2 tropopause as a strict boundary to distinguish PSCs from upper tropospheric cirrus leads to cloud misclassifications. Hence, using a criterion to distinguish tropospheric clouds from stratospheric clouds is quite essential. So, in the present study, the criterion for separating stratospheric from tropospheric clouds was that the location of stratospheric clouds needed to be 4 km above the reported tropopause.
3. Results
According to our results (
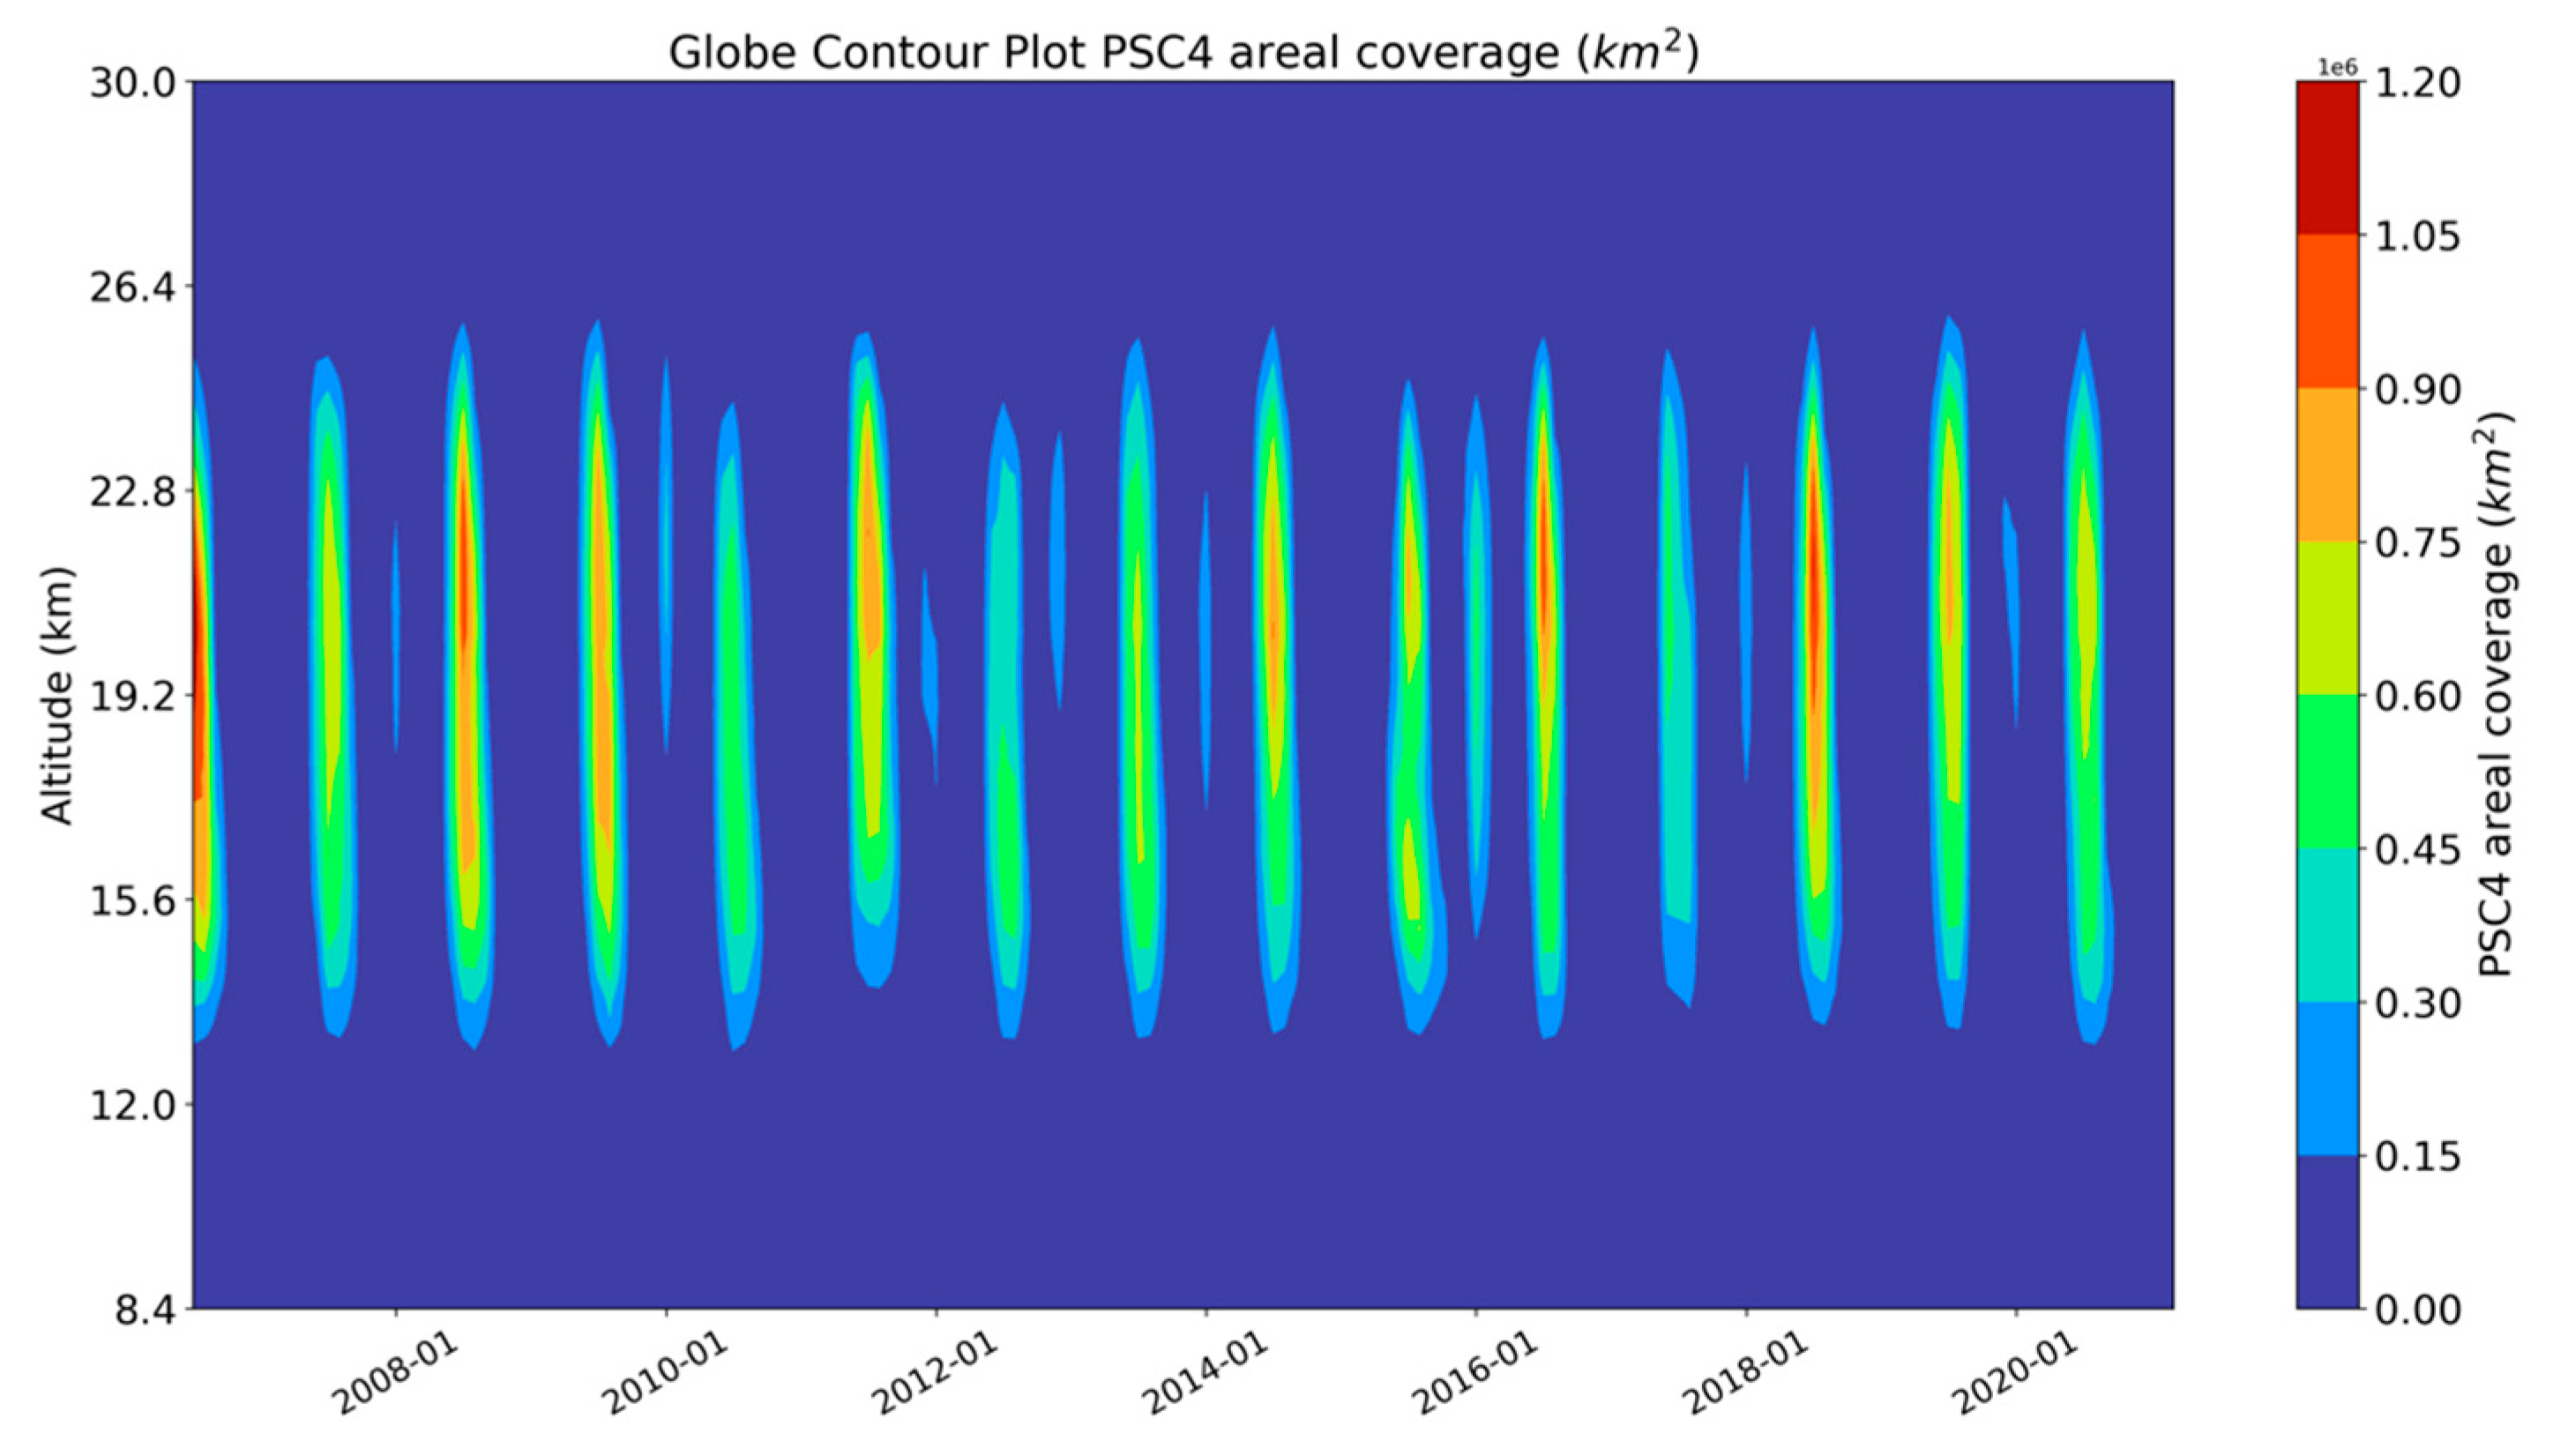
Figure 1), in general, and independently of the PSCs altitude, over the Antarctic, the PSC season extends from May to October. This is in contrast to the Arctic where the PSC season is quite variable, possibly extending from December to March. The PSC area coverage significantly varies from region to region and from season to season.
It is important to gain detailed information about the seasonal and year-to-year differences in PSC occurrence with respect to their altitude. This is easily depicted in
Figure 1, where the 16-year (2006–2021) interannual variability of mean monthly PSC areal coverage per altitude is presented. PSCs are found in altitudes ranging from 13 to 25 km above the Earth’s surface, with maximum frequency (reddish colors) between 18 and 22 km. According to our results, the areal extent of PSCs, at the altitude of their maximum frequency of occurrence, has decreased over the SH from 2006 to 2021 and increased over the NH, but these trends are not statistically significant. The decreasing PSCs over the SH, essentially over its polar (Antarctic) areas, may be responsible for the ozone depletion recovery since 2000 [
6]. It appears that the highest values of PSC’s areal coverage are observed in the Southern Hemisphere, essentially in Antarctica (greenish, yellowish, and reddish plot areas in
Figure 1) with an absolute monthly mean maximum at approximately 1.2 million km
2. In contrast, the PSC areal coverage is clearly smaller in NH, e.g., the Arctic (light bluish plot areas). More specifically, the monthly mean PSC areal coverage ranges from 1984 km
2 to 510,184 km
2 in the North Hemisphere and from 462 km
2 to 1,196,110 km
2 in the SH.
The total areal extent of PSCs in the SH typically peaks in July, and rarely in August, before decreasing noticeably in September and finally almost vanishing in October. As seen in
Figure 1 the seasonal variation of SH is quite similar from year to year, but there is a small year-to-year variability in PSC coverage, which is mainly driven by the dynamical factors that control the stability and size of the polar vortex, along with the frequency and intensity of upper tropospheric and orographic forcing events [
3]. Furthermore, during July and August, the area of highest occurrence frequency is increasing in both latitude and altitude in response to the continued cooling of the polar vortex.
On the other hand, the PSC occurrence in the NH, which is clearly smaller than in SH (the light bluish areas of the
Figure 1 plot), varies significantly from season to season. According to
Figure 1, the greatest areal coverage of PSCs out of the 16-year study period has been observed during the years 2015 and 2016. In contrast to those remarkable PSC years/seasons, the previous winter periods, e.g., 2014–2015, were almost without any PSCs (extremely low values of PSC areal coverage). The total areal extent typically peaks in December or January, and then diminishes quite fast in February, approaching zero in March.
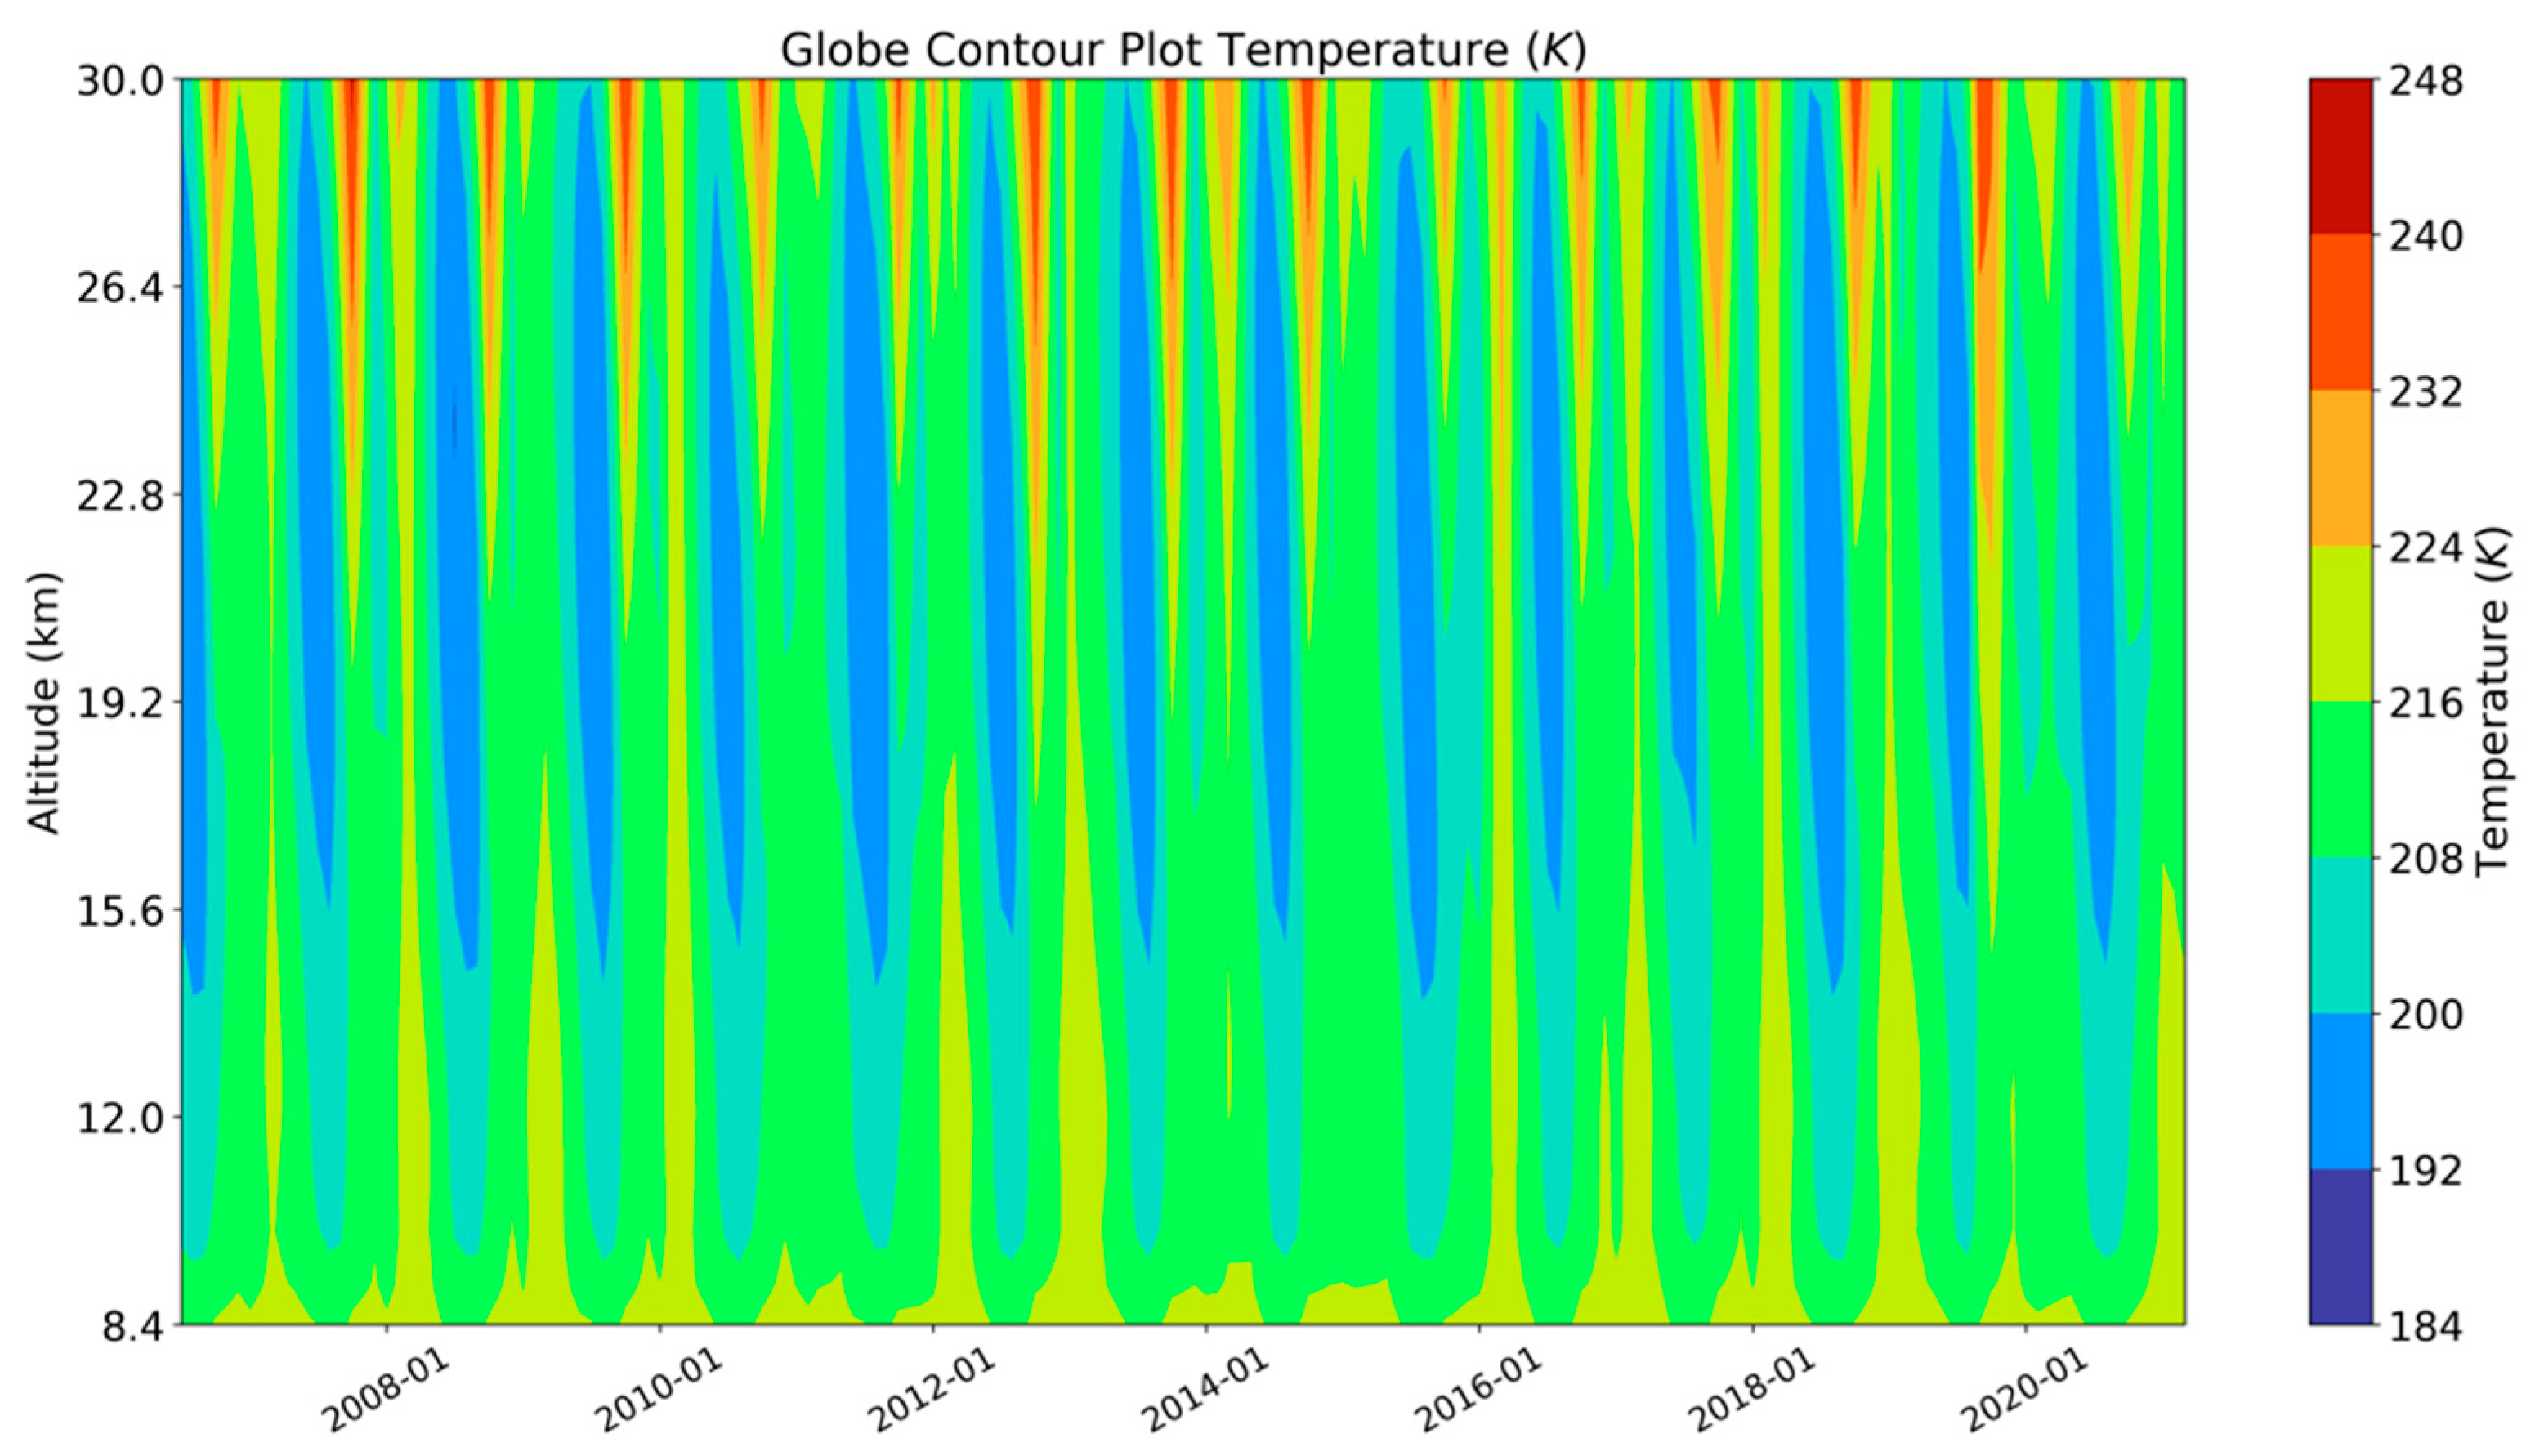
To explain the corresponding spatial and temporal patterns of PSC’s occurrence, the stratospheric temperatures have been also investigated.
In
Figure 2, the temporal variability of mean monthly values of stratospheric temperatures is shown for the 16-year period 2006–2021 per altitude. A clear seasonal variability is indicated, with the lowest temperatures being observed at the altitude range of PSC maximum frequency of occurrence. In the NH, the coldest temperatures occur mainly in December, until the middle of January. The figure displays noticeable differences in stratospheric temperatures between the periods 2014–2015 and 2015–2016, the first one being quite warmer than the second, which explains the previously reported different areal extents of PSCs in these two periods. In the SH, the lowest temperatures occur mostly in July, while in August there is some warming in the uppermost stratosphere (>23 km). Above 26 km in the SH, temperatures start reaching almost 200 K, while in the NH temperatures at the same altitude are greater. It is important to note that there is a basic difference between the two Hemispheres in terms of low temperatures (bluish colors) regarding their vertical extent in the polar stratosphere and persistence (indicated by the wider bluish areas for SH than NH). The comparison between the results of
Figure 1 and
Figure 2 reveals that for both the North and South Hemispheres, the occurrence of PSCs occurrence is quite well correlated with stratospheric temperatures, indicating that stratospheric temperatures are a major driver of PSC’s formation.
4. Conclusions
In the present study, a 16-year climatology of PSCs and stratospheric temperatures was built for the period 2006–2021. When analyzing the CALIOP data for both the Northern and Southern Hemispheres, some interesting findings were found: (a) There are greater values of PSC areal extent in the SH than in the NH, (b) the altitude range of PSCs’ maximum occurrence is wider in the SH than in the NH, (c) contrary to the SH, the PSC occurrence in the NH is highly variable from year to year, (d) there is an increasing/decreasing trend of PSCs in the NH / SH, respectively, but both are not statistically significant, (e) the PSC season in the SH can last for 6 months (May–October), while in the NH lasts for 4 (December–March) and (f) stratospheric temperatures are correlated with PSCs in both hemispheres.


 and
and 