Proceeding Paper

Optimization of a CHP Unit Operation on a University Campus for Carbon Dioxide Emission Minimization †

by
Kleanthis Kaldellis
,
Emmanouil Kostopoulos
and
John K. Kaldellis
*
Laboratory of Soft Energy Applications & Environmental Protection, University of West Attica, 12201 Athens, Greece
*
Author to whom correspondence should be addressed.
Presented at the 16th International Conference on Meteorology, Climatology and Atmospheric Physics—COMECAP 2023, Athens, Greece, 25–29 September 2023.
Environ. Sci. Proc. 2023, 26(1), 210; https://doi.org/10.3390/environsciproc2023026210
Published: 19 October 2023

Abstract

:
The current study examines an algorithmic solution for the reduction of carbon dioxide emissions resulting from the optimum energy demand coverage of a typical university campus via the contribution of an existing Combined Heat and Power (CHP) unit of 600 kWe based on natural gas utilization. The application results of the proposed algorithm for the UNIWA Ancient Grove Campus suggest an optimal operation plan for the corresponding CHP unit and achieve a carbon dioxide emission reduction by almost 55% on an annual basis. In this context, the proposed innovative solution may be equally well applied on several other university campuses with similar positive results for the environment.

1. Introduction

University campuses belong to the (public) service sector and, for various reasons, are characterized as high energy consumption and heavy polluting facilities, due to the absence of an energy saving strategy or zero energy consumption management. Normally, university campuses should present the optimum energy consumption performance and minimum environmental surcharge, being also a successful real-world example for young engineers but also for the citizens of nearby communities. Unfortunately, this is not the case for the vast majority of Greek universities, since the standard solution adopted up to now by the public sector is the purchase of electricity from the national grid and consumption of oil or natural gas in the central heating boilers of the buildings. Moreover, the utilization of small air conditioners for each office, mainly for cooling purposes, completes the irrational energy consumption pattern.
In contrast to this general case, the University of West Attica (UNIWA) Ancient Grove Campus covers its energy consumption needs mainly by the contribution of an existing Combined Heat and Power (CHP) unit of 600 kWe based on natural gas utilization. A complementary amount of electricity may be supplied by the main grid, applying the net metering option. Moreover, small natural gas quantities may be used for heating purposes by university boilers, although the vast majority of heat demand is covered by the utilization of the CHP. To this end, the current study examines an algorithmic solution for the reduction of carbon dioxide emissions resulting from the optimum energy demand coverage of a modern, environmentally friendly university campus. The application results of the proposed algorithm for the UNIWA Ancient Grove Campus suggest an optimal operation plan for the corresponding CHP unit and achieves a carbon dioxide emission reduction by almost 55% on an annual basis.

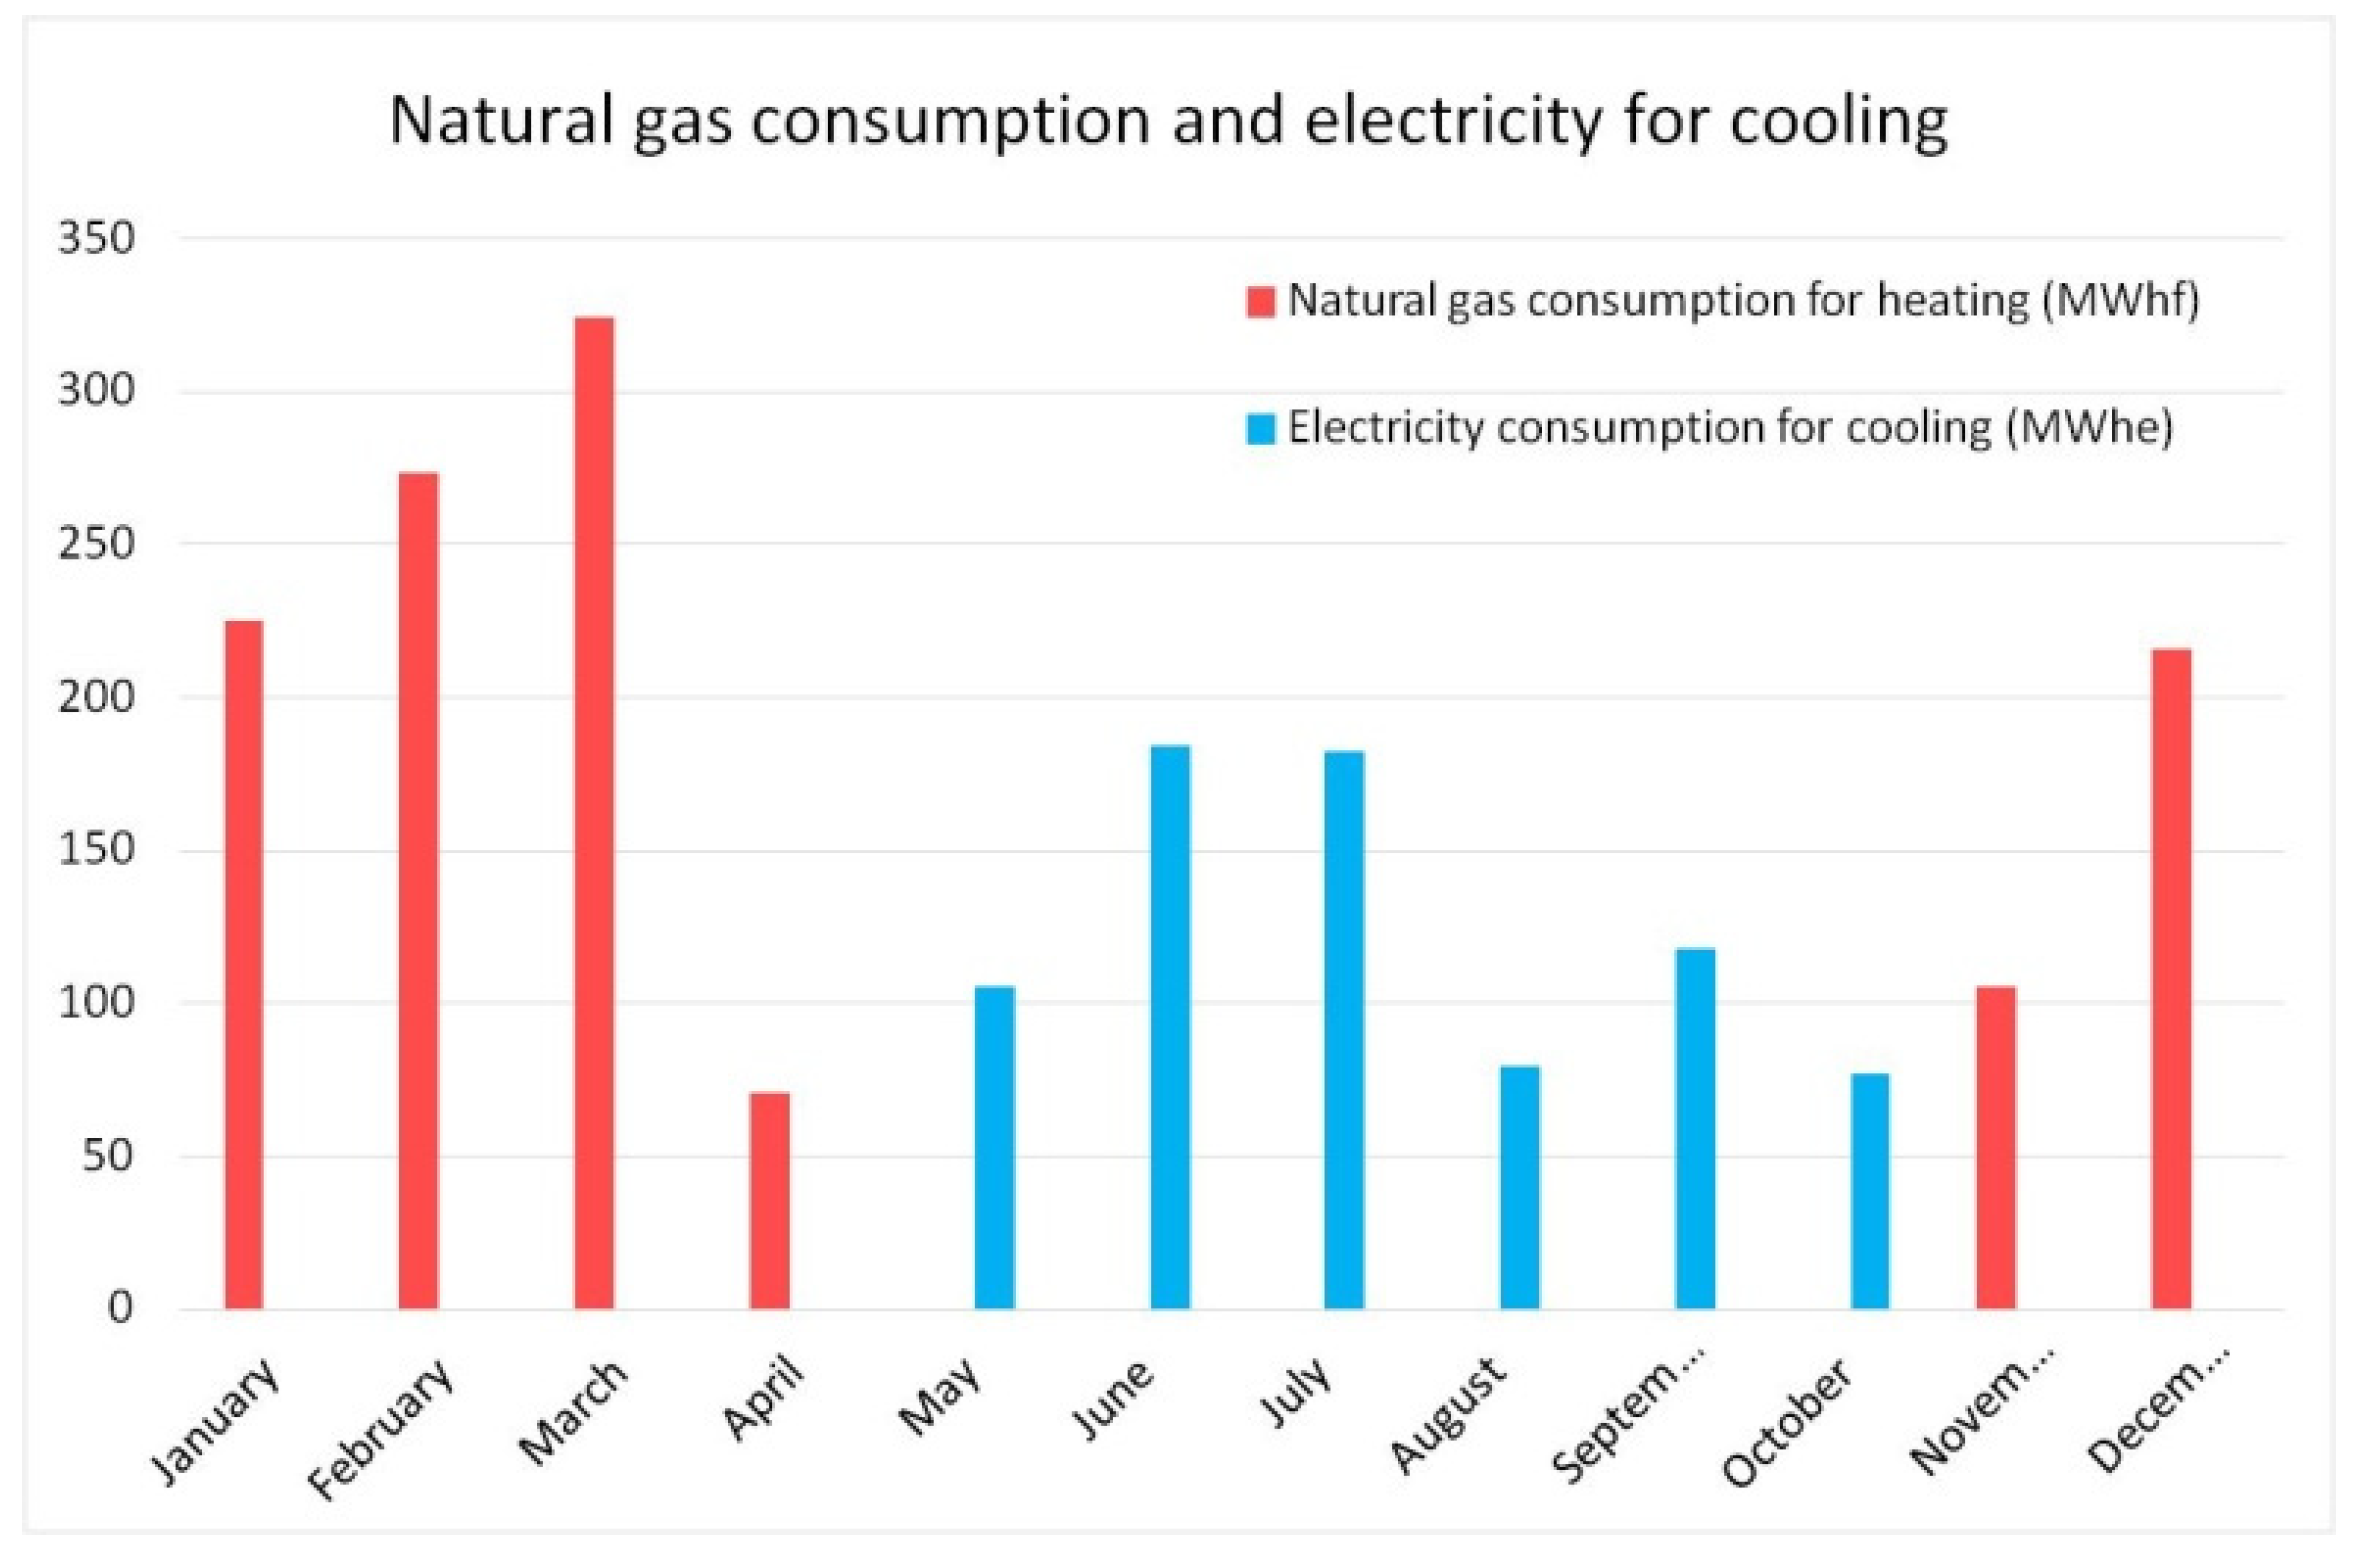
Energy Consumption Profile for the University of West Attica

The Ancient Grove Campus of the University of West Attica extends over an area of about 100,000 m2 in the middle of an olive grove and is located near the center of Athens and the port of Piraeus and includes a total of 10 buildings with an equivalent space of 50,000 m2. The campus hosts more than 400 staff members, while the total number of active students currently is more than 12,000. In recent years, the annual electricity consumption of the entire campus was almost 3.0 GWh, while the corresponding peak load rarely exceeded 1 MW. Moreover, monthly electricity consumption does not present significant fluctuations yearly (Figure 1), excluding the period of the pandemic and taking values between 150 MWh and 350 MWh. According to the data in Figure 1, it is obvious that electricity consumption is also affected by the cooling and heating needs of the campus, covered by small autonomous AC devices.
On the other hand, the heat demand of the campus is fulfilled by seven central heating boilers (practically each for every building) of various thermal power values (e.g., from 200,000 kcal/h up to 1,200,000 kcal/h), while the cooling load is covered by several central heating pumps up to 600 kWe. To this end, the natural gas consumption for campus heating is more than 1200 MWhth, while the corresponding additional electricity consumption for cooling purposes may approach 750 MWh (Figure 2).

2. CHP Methodology & Unit

2.1. Combined Heat and Power Methodology

Cogeneration/polygeneration, i.e., the parallel production of electricity and heat or cooling, is one of the most promising energy saving techniques, since the “waste heat” of the electricity generation process is used to cover the heating/cooling demand of the consumers. More specifically, cogeneration, also known as combined heat and power (CHP), has a similar function to conventional thermal power plants but in a more efficient way. In this context, CHP power plants generate electricity using a fossil fuel (e.g., natural gas) or a renewable fuel (e.g., biogas), while the remaining energy in the exhaust gases is exploited for space and water heating purposes [1]. Additionally, the combination of a CHP system with an absorption chiller, which converts the waste heat into chilled water for cooling purposes, is known as “trigeneration” or combined cooling, heating and power (CCHP).
Several studies have shown that the simultaneous production of electricity and heat is a highly efficient method (i.e., 80–90%) [2]. Additionally, cogeneration consumes 10–30% less fuel than the separate production of electricity and heat [3]. More thorough research has shown that depending on the CHP technology used, the overall efficiency of plants can reach 80% [4]. Figure 3 presents the efficiency of a conventional centralized power plant, where the heat is produced separately from electricity vs. the efficiency of a CHP system. Therefore, cogeneration represents an environmentally friendly way to save energy, on top of improved financial performance compared to conventional thermal power plants (i.e., 10–30% less fuel). For instance, natural gas due to its high heating value, easy supply, and relatively low greenhouse gas (GHG) emissions compared to other fossil fuels, is appropriate for high efficiency CHP plants [5]. However, at this point, it is important to mention that one of the key points for the successful operation of a similar installation is the simultaneous demand of electricity and heat or cooling.
Recapitulating cogeneration provides many benefits compared to conventional energy production concerning efficiency, environmental, economic and reliability issues [6]. CHP plants avoid transmission and distribution losses that typically occur in large, centralized power stations, while consuming less fuel for energy production. Less fuel means not only reduced energy costs but also fewer GHGs and other harmful emissions. CHP also mitigates the risk of electric grid disruptions by providing reliable on-site energy.

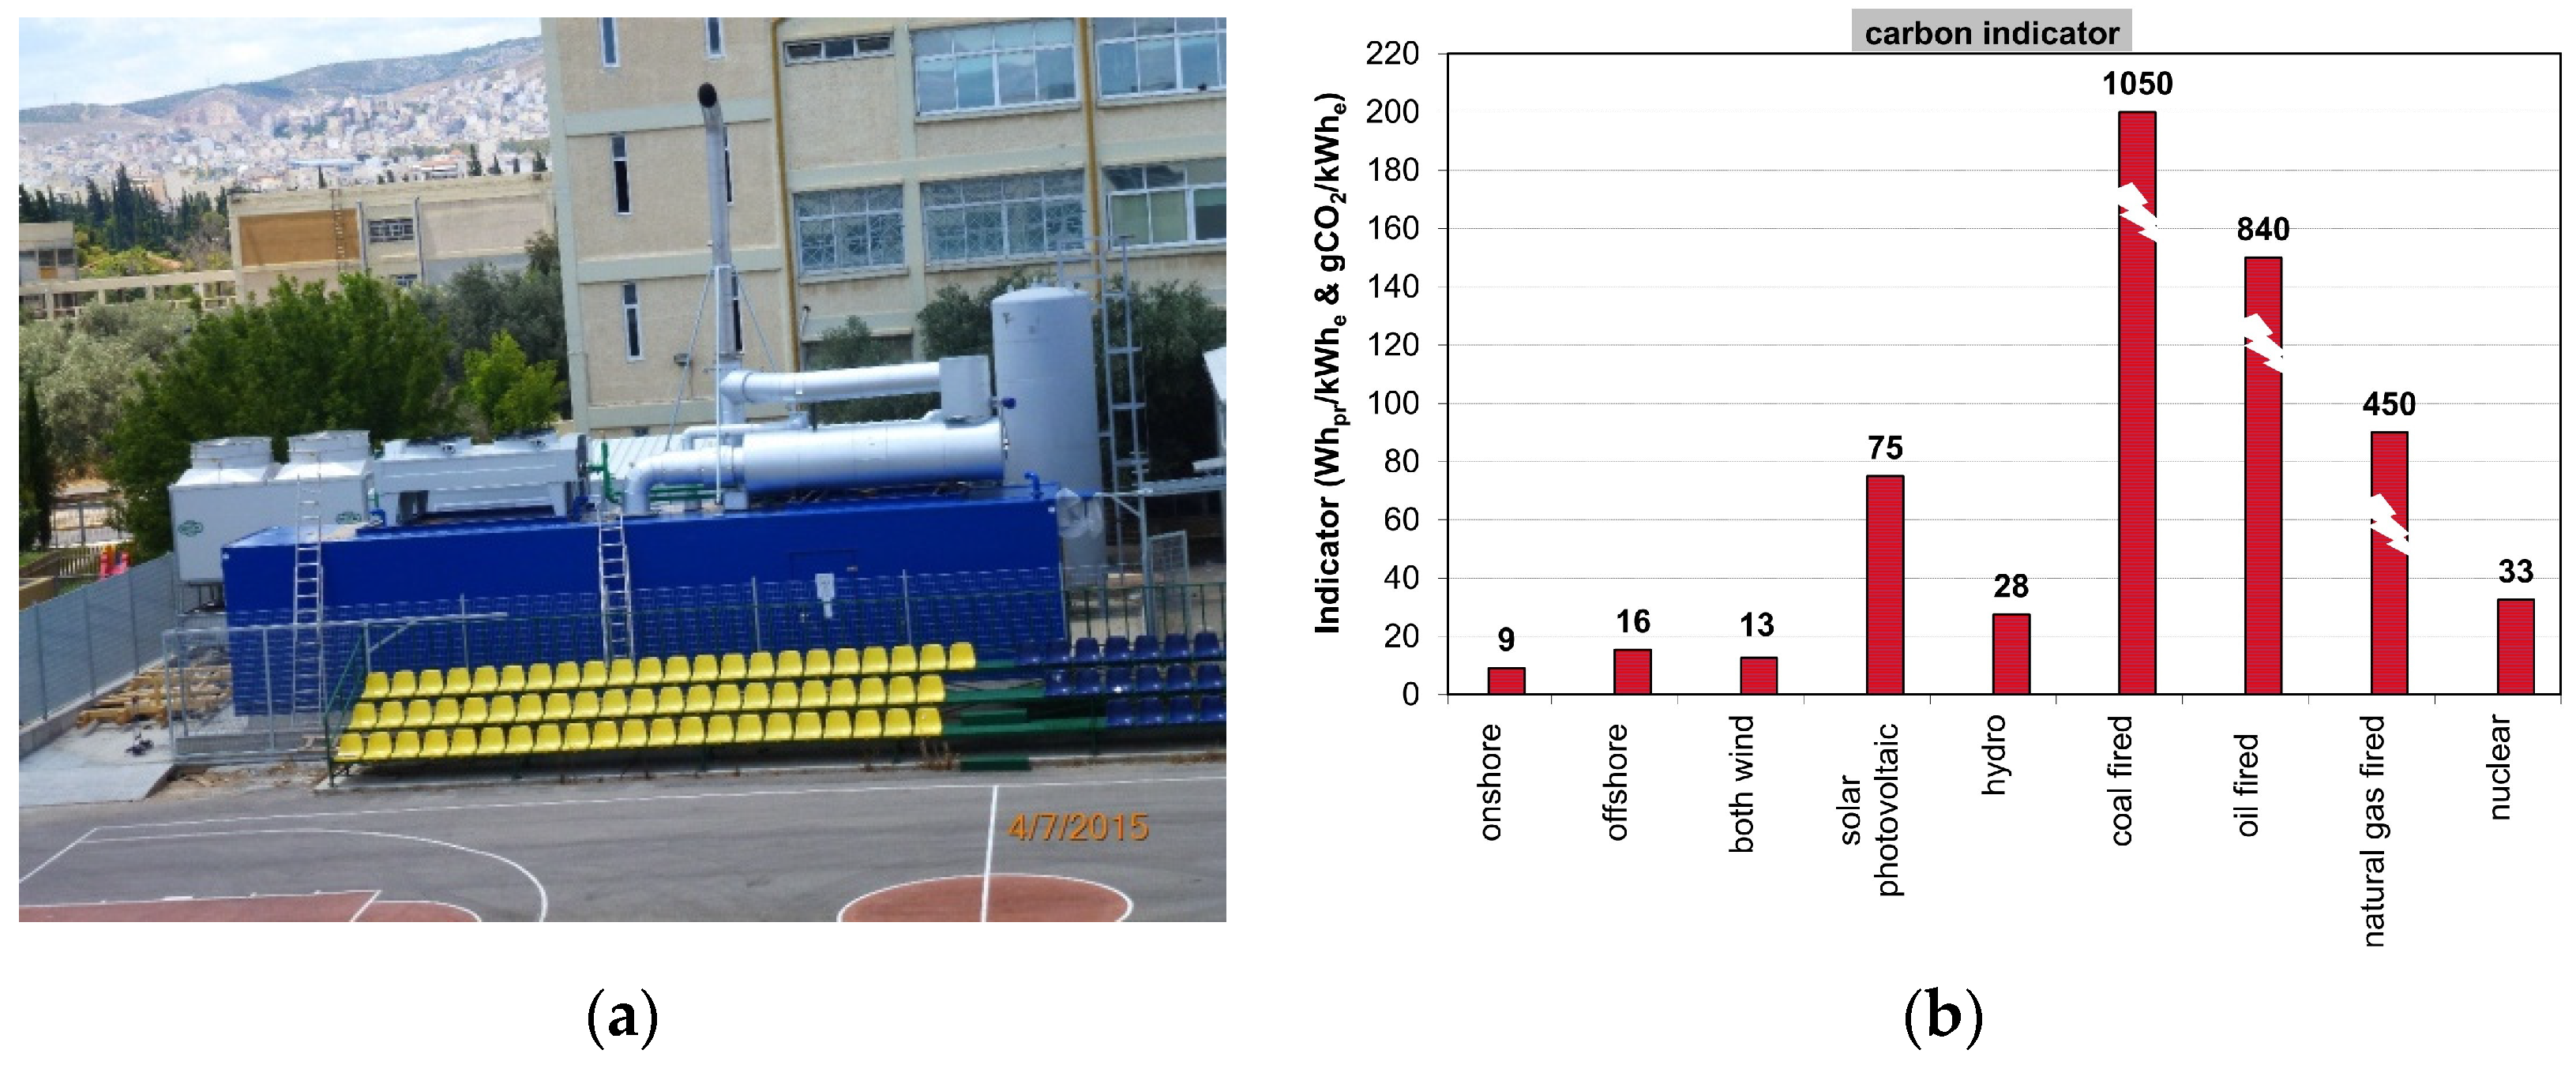
2.2. Combined Heat and Power Units of UNIWA

As already mentioned, the CHP installed in UNIWA (Figure 4) has a gross electrical power output equal to 600 kWe (net output ~560 kWe), using natural gas and including heat recovery strategies concerning the hot outgases and the hot water from the engine cooling subsystem. Any heat recovery is used to cover the heat load of the campus, mainly during the winter, while it can also be used for providing cold water for cooling purposes via the absorption technique. More precisely, on the basis of the complete energy analysis of the proposed CHP unit, the expected thermal output is approximately 650 kWth, while for cooling purposes, the corresponding max power is almost 850 kW. To this end, the electrical efficiency of the CHP is slightly less than 40%, while according to the engine manufacturer, the total thermal and electrical efficiency exceeds 85%.
Moreover, the selected installation has the ability to operate in collaboration with the national grid or autonomously in case of blackouts covering selected high priority loads of the campus. As one can see in Figure 4, the entire CHP has been installed in appropriate containers located in a free space of the Campus, without any other additional building to be erected. Only an additional container is necessary for the installation of the absorption chiller and the auxiliary water treatment system. The electricity produced by the CHP is offered at a medium voltage of 20 kV/50 Hz via the appropriate transformers and is connected to the proposed position of the control board of the Campus. Finally, the CHP unit is also integrated with a thermal storage tank of hot water, mainly used for feeding the boilers of the respective buildings in the case of extremely cold days.

3. Carbon Dioxide Emissions Quantification

Carbon dioxide is the product of a reaction between carbon and oxygen molecules during a complete combustion process. In this context, carbon dioxide is emitted during fossil fuel combustion. However, even in the case of RES-based applications, one may estimate a small amount of CO2 emissions due to the primary energy used during the relative equipment manufacturing process and due to the fuel consumed during the erection, manufacturing and decommissioning of all RES-based installations. As is obvious, the CO2 emissions depend on the fuel mix of an economy, as well as on the carbon dioxide specific emission factors of the various energy technologies used. For example, the CO2 emissions related to the production of one kWh of electricity in the local economy are given as:
ε g r i d = w l i g n ε l i g n + w n g ε n g + w w i n d ε w i n d + w h y d r o ε h y d r o + w o t h e r ε o t h e r
where “w” is the percentage contribution of the different energy resources (i.e., lignite, natural gas, wind energy, solar energy, hydropower and other) in the national electricity generation fuel mix, and “ε” represents the specific CO2 emissions factor for every energy technology used. Using the well-established analysis by the authors [7], based on a detailed literature review, one may provide (see also Figure 4b) the corresponding ranges for most technologies used, e.g., 400–500 gCO2/kWhe (mean value 450) from natural gas.
Judging from the values presented above, the carbon footprint of RES is significantly lower than that of fossil fuel power stations, while among fossil power generation technologies, natural gas presents the lowest values of specific CO2 emissions per kWhe [8] on life cycle analysis.

4. Problem Modeling

4.1. Conventional Demand Coverage

For the period up to 2016, the university’s electricity demand was exclusively covered by electricity supply by the Greek national grid (HEDNO), while its thermal demand was covered by natural gas-fueled boilers. Under these circumstances, the CO2 emissions can be calculated as follows:
e = e e l + e t h ,
This equation can be rewritten, presenting CO2 emissions related to electricity demand “Del” and thermal needs “Dth”, as follows:
e = ε g r i d · D e l + ε n g · D t h ,
As is obvious from Equation (3), the university’s CO2 emissions are linearly connected to the Greek national grid’s CO2 emissions coefficient, εgrid (see also Section 3).

4.2. Modeling of Suggested Solution

The proposed minimum carbon dioxide emissions model should fulfil a series of constraints, needs and limitations derived from its real-world application.
Primarily, the fundamental objective of the model is the minimization of CO2 emissions related to the coverage of electricity and heat demands, as described by Equation (2). After the introduction of the CHP to the university campus, emissions related to electricity demand will be equal to the sum of emissions by the electricity generation by the local CHP “Sel,chp” and the electricity imports by the national grid “Sel,grid”, using the corresponding emissions coefficients, i.e., “εgrid” and “εchp”. Regarding heating needs, given that thermal supply from CHP does not produce additional emissions other than those related to electricity production, emissions related to thermal demand (in case that the university boilers are used) will be equal to the product between the heat supply by the natural gas combustion engine “Dth,ng” and the natural gas combustion emission coefficient “εng”. As a result, total emissions related to electricity and heat demand coverage will be:
e = ε g r i d S e l , g r i d + ε n g S t h , n g + ε c h p S e l , c h p ,
which is the objective function of the model. Apart from the objective function, the described model will be subject to a series of constraints linked to the special needs of the applied operation of the system.
The total amount of electric demand has to be fully covered by the electric production of CHP and imported electricity by the national energy grid:
D e l = S e l , g r i d + S e l , c h p ,
Moreover, the campus’s thermal needs have to be met by the thermal energy supply, combining heating resulting from CHP operation and the natural gas boilers of the campus. However, thermal supply from CHP operation, not producing extra CO2 emissions and able to be released or transferred to nearby buildings, can exceed the system’s thermal needs, while heat supply from the natural gas combustion engine has to be limited to the level of actual demand. Finally, taking into account the CHP power-to-heat ratio “c” as provided by the engine manufacturer, ranging between 0.7 and 0.9, depending on the engine’s operational level, heat supply by CHP can be written with respect to CHP electricity production, leading to the following set of inequalities:
D t h S t h , n g + S e l , c h p c ,
S t h , n g D t h ,
Furthermore, the model has to take into consideration the physical limitations of electricity supply from the CHP unit, related to the maximum electric power of the engine, along with the number of its annual operating hours, leading to another constraint:
S e l , c h p S e l , c h p m a x = P e l , c h p · C F · 8760 ,
where “CF” is the utilization factor of the CHP installation, depending on the technical availability of the power station (maintenance, failures, etc.), as well as on the operation strategy of the unit.

4.3. The Model

Combining Equations (4)–(7), while restricting negativity to the model’s critical values, we conclude with the required model, describing the problem, as it is presented in Table 1, by the following matrix representation:
The model developed is able to calculate the optimum level of CHP operation (i.e., CF value) in order to achieve the minimum carbon dioxide emissions, while ensuring the full coverage of campus electricity and heat demand. For this purpose, the model requires inserting electricity and heat demand, CHP maximum power and cogeneration coefficient, along with carbon dioxide emission coefficients for grid power, natural gas combustion engine and cogeneration unit.

5. Application, Results and Discussion

5.1. Application

The developed model was applied to the case study of the University of West Attica. For this purpose, the variables needed for the calculation have been set to (Table 2):
By inserting the data listed in Table 2 above, the model outputs are presented in Table 3 below:
The outputs of the model suggest that, for the given set of data input, the CHP unit utilization rate should be:
C F c h p = S e l , c h p S e l , c h p m a x = 3,000,000 4,818,000 62.3 %
The CHP utilization rate should be CF ≈ 62%, operating at maximum power for 5455 h on an annual basis, while producing 3000 MWh of electricity and 3450 MWh of heat. According to this solution, an almost 55% reduction of carbon dioxide emissions may be achieved compared to the conventional operating mode. With this solution, the university campus will fully cover its electricity and heat demand using the CHP unit, while there is remarkable heat excess for auxiliary loads or even for export to nearby consumers.

5.2. Parametric Analysis of the Suggested Model

The input variables of the model can be separated into two different categories: the systemic (or internal) variables—remaining almost unchanged through time, and the external variables—that are subjected to changes that cannot be controlled, such as “Del”, “Dth” and “εgrid”. However, as suggested by the initial results, changes up to 25% in electricity and thermal demand are not expected to have an effect on the results, leading to a linear increase (of decrease) in the utilization rate of the CHP unit ( 46.7 % < C F < 77.9 % ). Thus, the parametric analysis will be focused on the sensitivity analysis of the model, related to changes in the national grid’s CO2 emission coefficient.
Changes in the carbon dioxide emission coefficient “εgrid” can occur over the course of time, due to the electricity fuel mix changes in the national electricity generation system. More specifically, as the Greek energy policy aims to achieve more RES-targeted energy production, the carbon footprint of the national electricity grid tends to decrease, lowering the carbon dioxide emissions coefficient, aiming to reach a level of 0.2 kgCO2/kWhe by 2030.
Taking this NEPC target into consideration, a parametric analysis for different levels of carbon dioxide emissions coefficient has been performed in order to present the effect of these different levels on the model output. The initial value of εgrid = 0.9 (valid up to 2015) has been lowered by a step of 0.05 until the level of 0.1 in order to indicate the sensitivity of the model outputs. The results of the model for these different inputs are presented in Figure 5:

5.3. Results Discussion

The results presented in Figure 5 indicate the major effect that brought the changes of the national energy grid fuel mixture to the optimum CHP capacity factor and the achieved carbon dioxide emission reduction. More specifically, for a national energy mixture with CO2 emissions coefficient of more than 0.45, full coverage of energy demands by CHP operation is the optimal solution, with a declining contribution to emission reduction. However, as it is shown in Table 4, for εgrid values between 0.45 and 0.16, the minimum emissions are achieved by electricity supply, mainly by the national grid, while the operation of CHP is limited, targeting its electricity production to the level of Dth,chp/c, in order to cover the thermal needs of the campus. Furthermore, for εgrid values less than 0.16, the optimal solution suggests the return to the conventional demand coverage method, which in this case produces the minimum CO2 emissions.

6. Discussion

Based on the results obtained above, the CHP unit proved to be the optimal solution for carbon dioxide emissions, back in the days of its installation, in 2015. Nowadays, the national energy grid emissions coefficient varies between 0.45 and 0.50 [9], allowing the energy production of the CHP engine to still offer a 10–18% reduction of CO2 emissions. Moreover, as the Greek national policy gradually shifts to a cleaner energy mixture (CO2 emissions coefficient less than 0.45), CHP operation shall be limited, aiming to mainly cover the thermal needs of the campus, in parallel with its electricity production, while the university is advised to embrace energy systems with an even smaller carbon footprint, such as PV solar systems (εPV = 0.075) that can further reduce the CO2 emitted by university operations.
The authors of this study suggest further investigation of the optimum level of CHP engine operation, using additional criteria for decision-making, including total energy costs, exploitation of excessive CHP thermal output, and stand-alone operation for the coverage of peak loads. In this context, the proposed innovative solution may be equally well applied on several other university campuses with similar positive results for the environment.

Author Contributions

Conceptualization, J.K.K.; methodology, K.K.; software, K.K.; validation, E.K. and J.K.K.; formal analysis, E.K. and J.K.K.; investigation, K.K.; resources, E.K. and J.K.K.; data curation, K.K. and E.K.; writing—original draft preparation, K.K.; writing—review and editing, J.K.K.; visualization, K.K.; supervision, J.K.K. All authors have read and agreed to the published version of the manuscript.

Funding

This research received no external funding.

Institutional Review Board Statement

Not applicable.

Informed Consent Statement

Not applicable.

Data Availability Statement

Unavailable due to privacy restrictions.

Conflicts of Interest

The authors declare no conflict of interest.

References

  1. Darabadi, Z.A.; Khoshbakhti, S.R.; Mirmasoumi, S.; Bahlouli, K. Extensive thermodynamic and economic analysis of the cogeneration of heat and power system fueled by the blend of natural gas and biogas. Energy Convers. Manag. 2018, 164, 329–343. [Google Scholar]
  2. Rosen, M.A. Energy, environmental, health and cost benefits of cogeneration from fossil fuels and nuclear energy using the electrical utility facilities of a province. Energy Sustain. Dev. 2009, 13, 43–51. [Google Scholar] [CrossRef]
  3. Stavropoulos, G.G.; Skordas, G. Energy and Environmental Benefits from Natural Gas Cogeneration: A Case Study; OPET Network; European Commission: Brussels, Belgium, 2005.
  4. Gambini, M.; Vellini, M. High Efficiency Cogeneration: Electricity from Cogeneration in CHP Plants. Energy Procedia 2015, 81, 430–439. [Google Scholar] [CrossRef]
  5. Kaldellis, J.K.; Vlachos, G.T.; Paliatsos, A.G.; Kondili, E. Detailed Examination of Greek Electricity Sector Nitrogen Oxides Emissions for the Last Decade. J. Environ. Sci. Policy 2005, 8, 502–514. [Google Scholar]
  6. U.S. DoE (U.S. Department of Energy); EPA (United States Environmental Protection Agency). Combined Heat and Power. A Clean Energy Solution. 2012. Available online: https://www.energy.gov/sites/prod/files/2013/11/f4/chp_clean_energy_solution.pdf (accessed on 5 June 2023).
  7. Kaldellis, J.K.; Apostolou, G. Life cycle energy and carbon footprint of offshore wind energy. Comparison with onshore counterpart. Renew. Energy 2017, 108, 72–84. [Google Scholar] [CrossRef]
  8. Arvesen, A.; Hertwich, E.G. Assessing the life cycle environmental impacts of wind power: A review of present knowledge and research needs. Renew. Sustain. Energy Rev. 2012, 16, 5994–6006. [Google Scholar] [CrossRef]
  9. IPTO Greece, Market Statistics. Generation per Fuel. Available online: https://www.admie.gr/en/market/market-statistics/key-data/generation-per-fuel (accessed on 20 June 2023).
Figure 1. Monthly variation of electricity consumption on the Ancient Grove Campus.
Environsciproc 26 00210 g001
Figure 2. Monthly variation of natural gas consumption for heating and electricity consumption for central cooling of Ancient Olive Campus.
Environsciproc 26 00210 g002
Figure 3. Comparison between a conventional generation system and a CHP system.
Environsciproc 26 00210 g003
Figure 4. (a) CHP installation on the Ancient Olive Campus; (b) Average values of CO2 emission specific factors [7].
Environsciproc 26 00210 g004
Figure 5. Effect of National Grid CO2 emissions coefficient on proposed model’s emissions reduction (compared to conventional method) and on electricity production by CHP engine.
Environsciproc 26 00210 g005
Table 1. Matrix representation of the model.
Sel,gridSth,ngSel,chpOperatorCriterion
101=Del
011/cDth
001CF * 8760 * Pel,chp
010Dth
1000
0100
0010
εgridεngεchp=Min(Z) = e
Table 2. Model input variables for the University of West Attica case study.
Variables (Input)ValuesUnits
Del3,000,000kWhe
Dth605,000kWhth
c0.85-
Pel,chpmax550kW
εgrid 10.9kgCO2/kWhe
εng0.25kgCO2/kWhth
εchp0.45kgCO2/kWhe
1 carbon dioxide emission coefficient for the national grid for 2015, has been set equal to 0.9 [9].
Table 3. Model results for the University of West Attica case study.
Variables (Output)ValuesUnits
Sel,grid0kWhe
Sth,grid0kWhth
Sel,chp3,000,000kWhe
Sth,chp3,450,000kWhth
e′ (model)1,350,000kgCO2
e (conventional)2,851,250kgCO2
Δe (emissions reduction)53%
Table 4. Suggested operating levels for εgrid values ranges under examination.
εgrid ValuesCHP Optimal Operating Level
[0.90, 0.45)Full electricity and heat production
[0.45, 0.15)Electricity production needed for full heat production
[0.15, 0.10]No production
Disclaimer/Publisher’s Note: The statements, opinions and data contained in all publications are solely those of the individual author(s) and contributor(s) and not of MDPI and/or the editor(s). MDPI and/or the editor(s) disclaim responsibility for any injury to people or property resulting from any ideas, methods, instructions or products referred to in the content.

