
Self-Consumption and Market Integration Balance Analysis for RES–Battery Electricity Prosumers in Greece †


Abstract
:1. Introduction
2. Materials and Methods
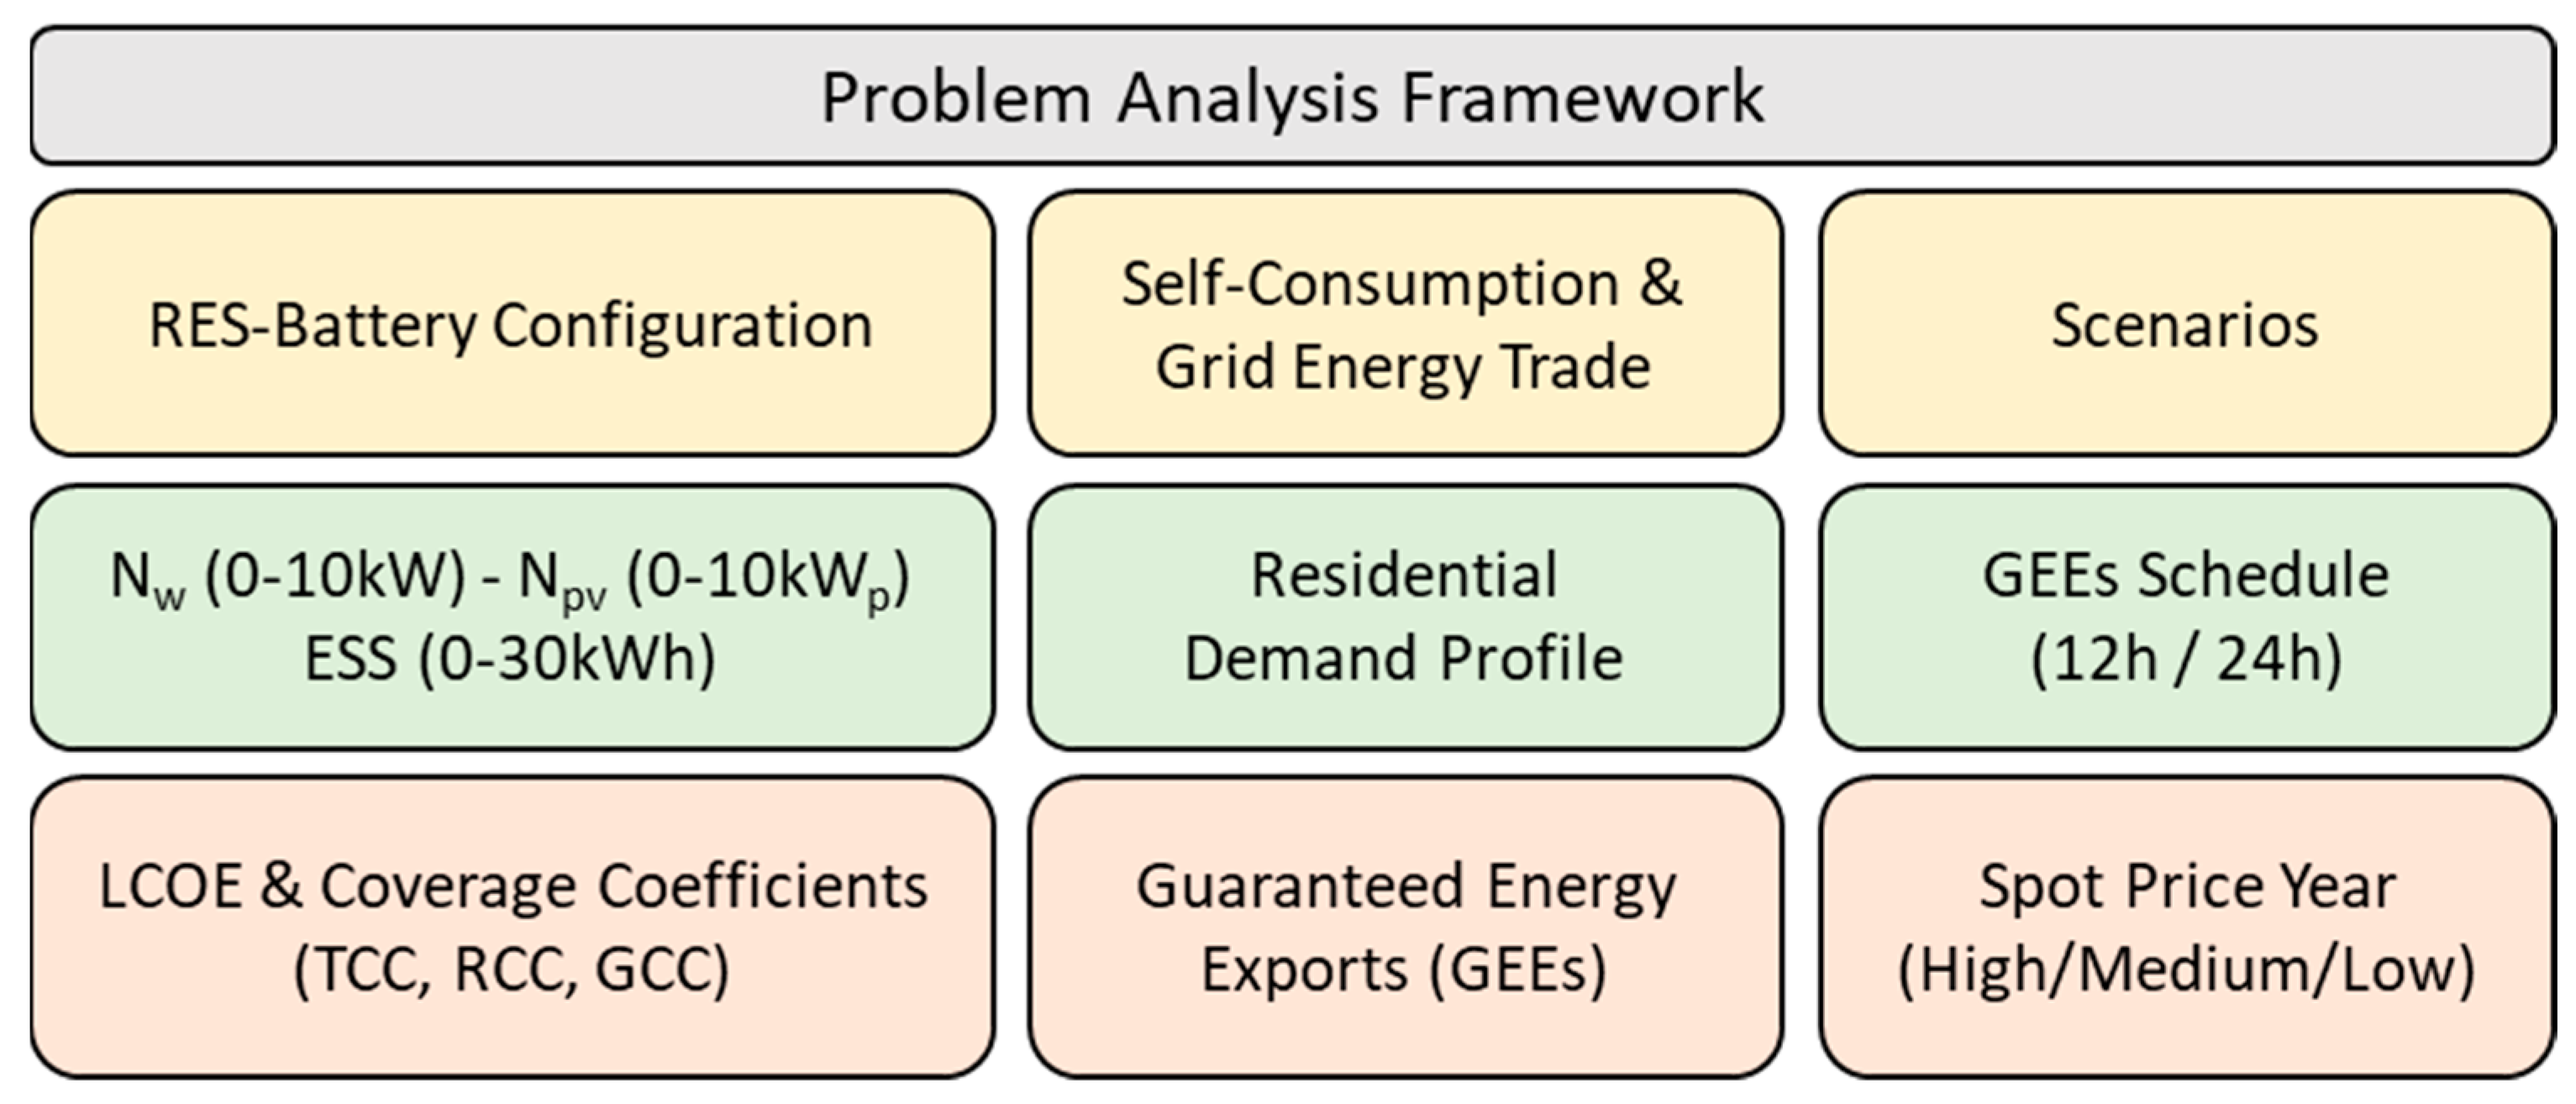
2.1. Problem Definition and Methods
2.2. Input Data
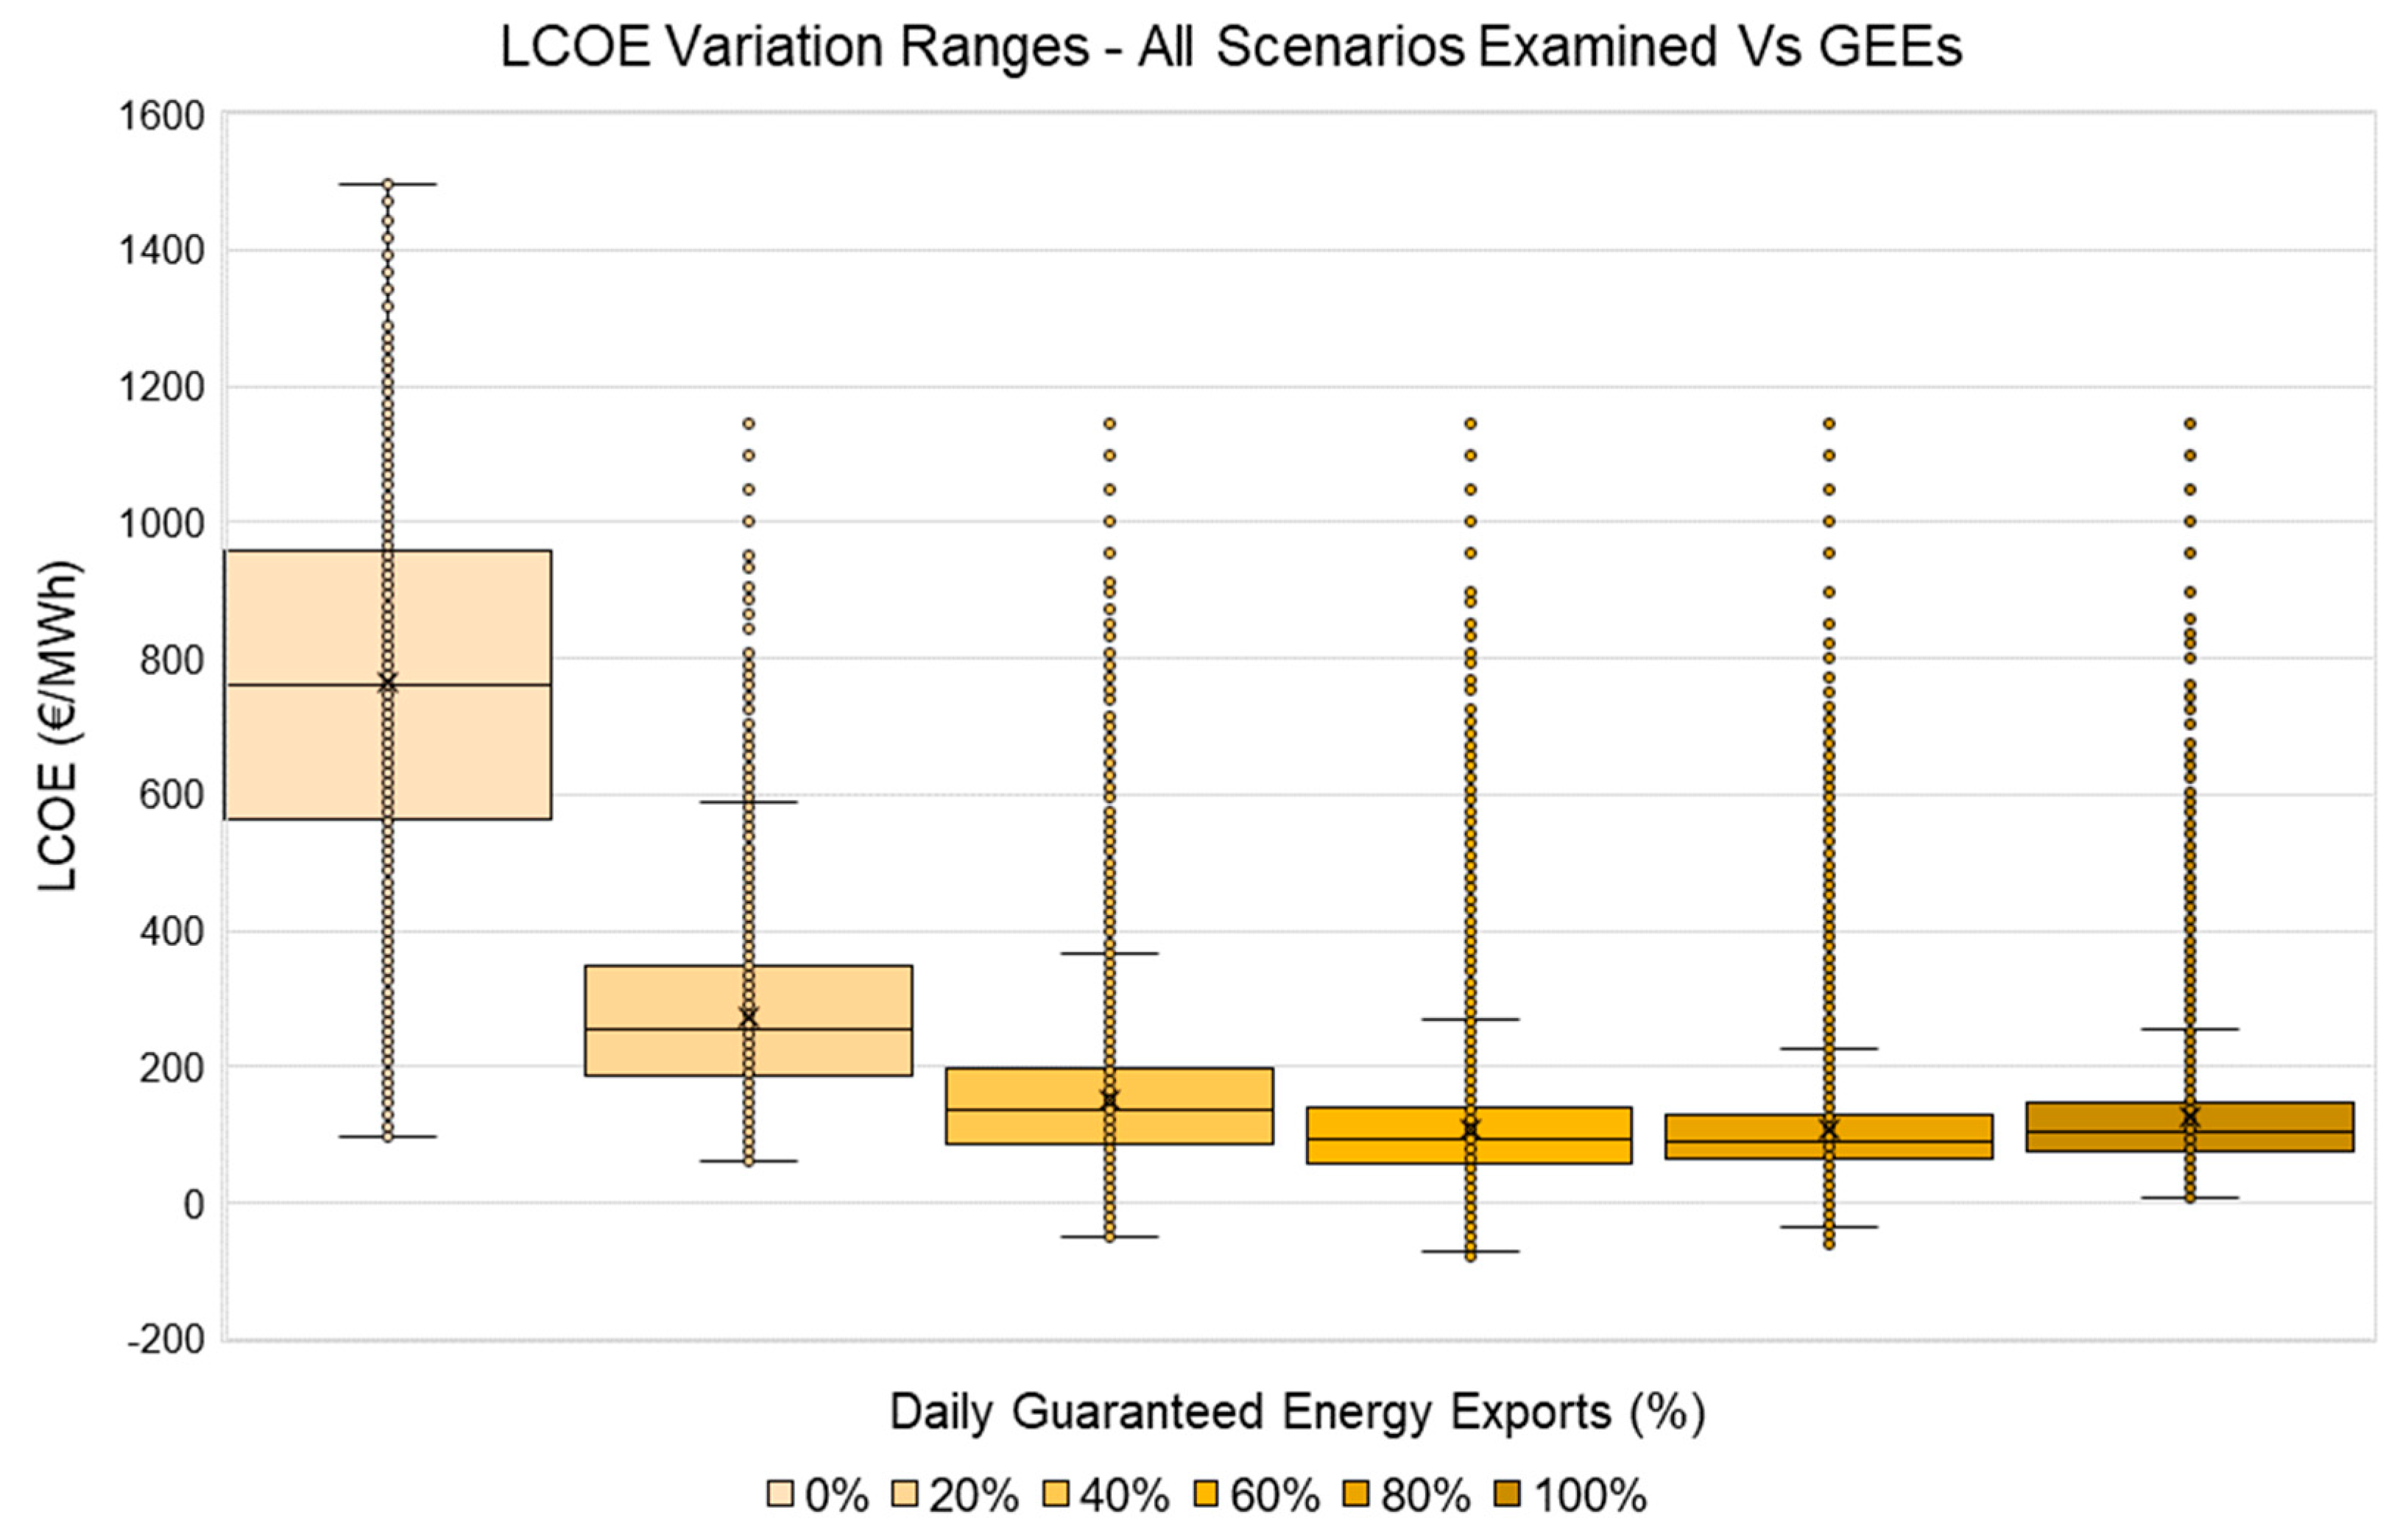
3. Results
4. Discussion and Conclusions
Author Contributions
Funding
Institutional Review Board Statement
Informed Consent Statement
Data Availability Statement
Conflicts of Interest
References
- Zheng, S.; Huang, G.; Lai, A.C.K. Techno-economic performance analysis of synergistic energy sharing strategies for grid-connected prosumers with distributed battery storages. Renew. Energy 2021, 178, 1261–1278. [Google Scholar] [CrossRef]
- Faraji, J.; Ketabi, A.; Hashemi-Dezaki, H. Optimization of the scheduling and operation of prosumers considering the loss of life costs of battery storage systems. J. Energy Storage 2020, 31, 101655. [Google Scholar] [CrossRef]
- Martin-Valmayor, M.A.; Gil-Alana, L.A.; Infante, J. Energy prices in Europe. Evidence of persistence across markets. Resour. Policy 2023, 82, 103546. [Google Scholar] [CrossRef]
- Hussain, S.A.; Razi, F.; Hewage, K.; Sadiq, R. The perspective of energy poverty and 1st energy crisis of green transition. Energy 2023, 275, 127487. [Google Scholar] [CrossRef]
- Parag, Y.; Fawcett, T.; Hampton, S.; Eyre, N. Energy saving in a hurry: A research agenda and guidelines to study European responses to the 2022–2023 energy crisis. Energy Res. Soc. Sci. 2023, 97, 102999. [Google Scholar] [CrossRef]
- Vezzoni, R. Green growth for whom, how and why? The REPowerEU Plan and the inconsistencies of European Union energy policy. Energy Res. Soc. Sci. 2023, 101, 103134. [Google Scholar] [CrossRef]


| Parameter | Description | Range | Step |
|---|---|---|---|
| Guaranteed Energy Exports (GEEs) | Fixed percentage of daily RES energy production, equally distributed over the given time schedule of selling power to the grid (guaranteed exports) | 0–100% | 20% |
| Guaranteed Penalty | Fees applying over time periods when the guaranteed energy export condition is violated. Fixed cap coefficient applying to the spot price of each given hour of violation. | 150% | 150% |
| Imported Energy Cap | Fees applying over time periods when the RES–battery system is unable to cover self-consumption needs. Fixed cap coefficient applying to the spot price of each given hour of non-coverage. | 150% | 150% |
| Metrics | Description |
|---|---|
| Residential Coverage Coefficient (RCC) | Annual coverage of self-consumption needs on the basis of energy supplied from the examined RES–battery system |
| Guaranteed Coverage Coefficient (GCC) | Annual coverage of guaranteed export needs on the basis of energy delivered from the examined RES–battery system |
| Total Coverage Coefficient (TCC) | Annual coverage of self-consumption and guaranteed energy needs on the basis of energy supplied from the examined RES–battery system |
| LCOE | Levelized cost of electricity, considering investment, maintenance and energy trading costs for a period of 20 years, as well as a discount rate of 5% |
Disclaimer/Publisher’s Note: The statements, opinions and data contained in all publications are solely those of the individual author(s) and contributor(s) and not of MDPI and/or the editor(s). MDPI and/or the editor(s) disclaim responsibility for any injury to people or property resulting from any ideas, methods, instructions or products referred to in the content. |
© 2023 by the authors. Licensee MDPI, Basel, Switzerland. This article is an open access article distributed under the terms and conditions of the Creative Commons Attribution (CC BY) license (https://creativecommons.org/licenses/by/4.0/).
Share and Cite
Christopoulos, K.; Stefanidi, I.; Kavadias, K.; Zafirakis, D. Self-Consumption and Market Integration Balance Analysis for RES–Battery Electricity Prosumers in Greece. Environ. Sci. Proc. 2023, 26, 182. https://doi.org/10.3390/environsciproc2023026182
Christopoulos K, Stefanidi I, Kavadias K, Zafirakis D. Self-Consumption and Market Integration Balance Analysis for RES–Battery Electricity Prosumers in Greece. Environmental Sciences Proceedings. 2023; 26(1):182. https://doi.org/10.3390/environsciproc2023026182
Chicago/Turabian StyleChristopoulos, Konstantinos, Iliana Stefanidi, Kosmas Kavadias, and Dimitrios Zafirakis. 2023. "Self-Consumption and Market Integration Balance Analysis for RES–Battery Electricity Prosumers in Greece" Environmental Sciences Proceedings 26, no. 1: 182. https://doi.org/10.3390/environsciproc2023026182
APA StyleChristopoulos, K., Stefanidi, I., Kavadias, K., & Zafirakis, D. (2023). Self-Consumption and Market Integration Balance Analysis for RES–Battery Electricity Prosumers in Greece. Environmental Sciences Proceedings, 26(1), 182. https://doi.org/10.3390/environsciproc2023026182