
Investigating the Impact of Cycling Aging on the Long-Term Performance of RES-Driven, Second-Life EV Battery Storage Configurations in Residential-Scale Applications †


 ,
,  and
and 
Abstract
:1. Introduction
2. Materials and Methods
2.1. Problem Definition and Methods
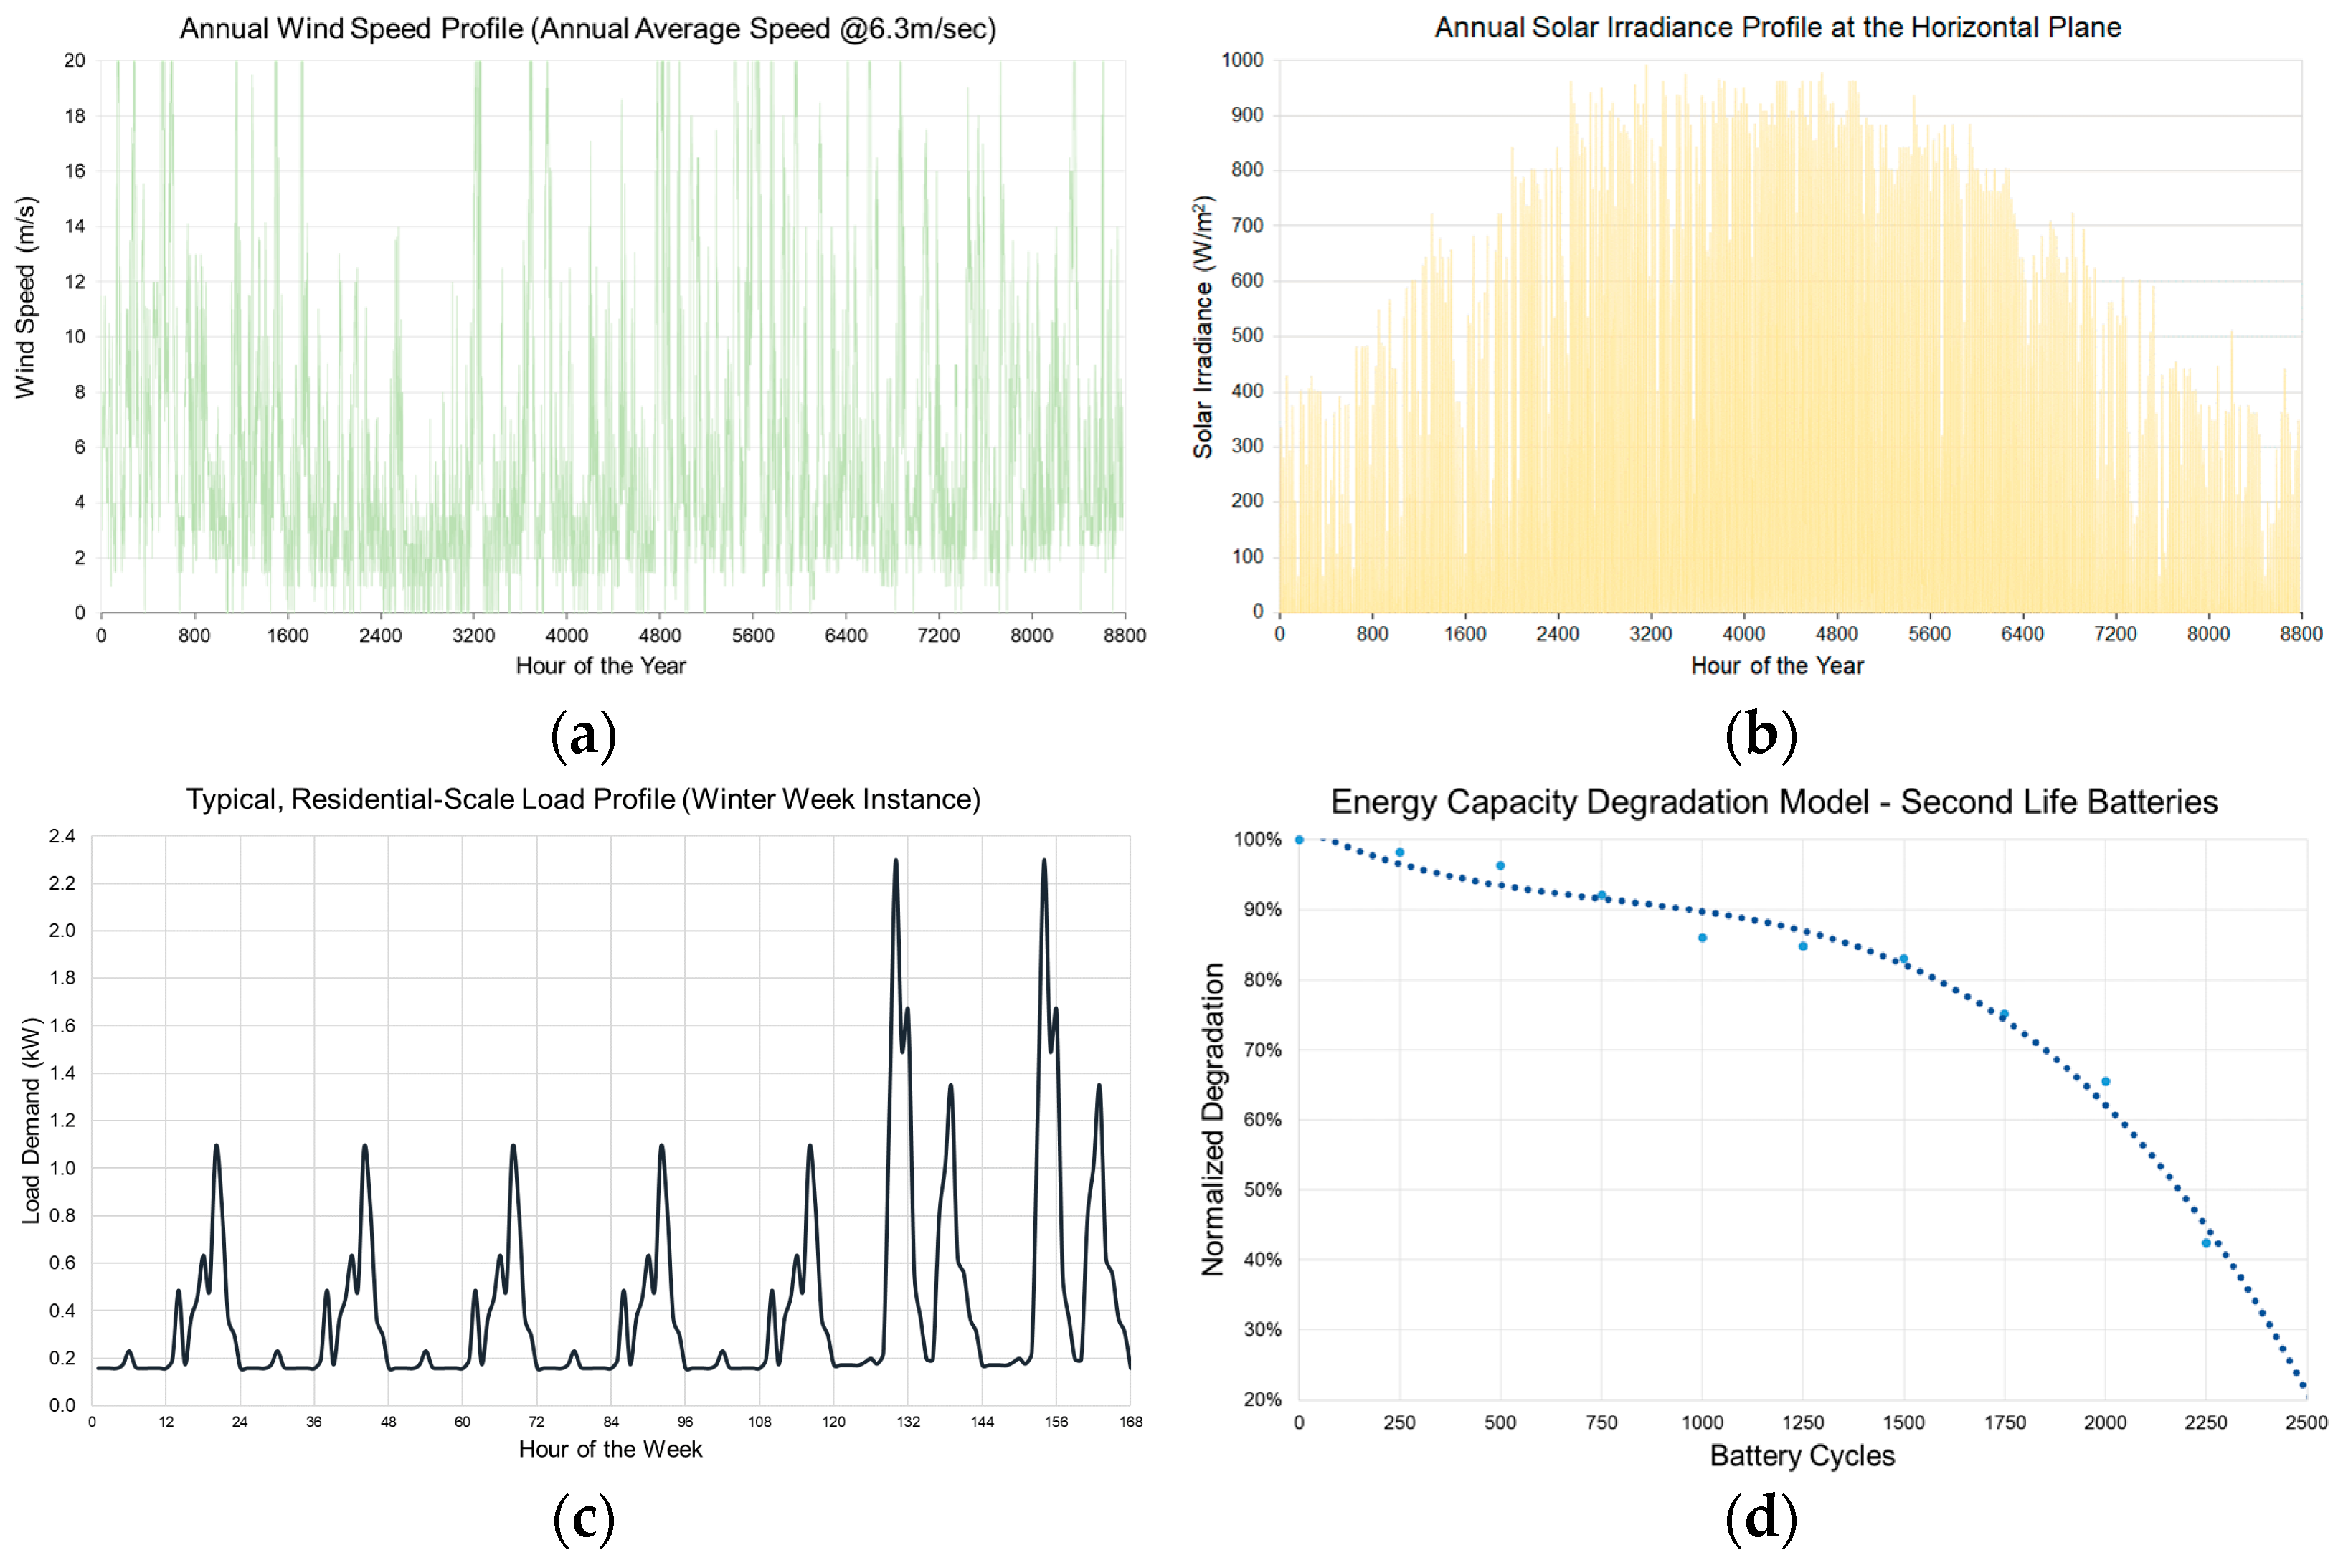
2.2. Input Data
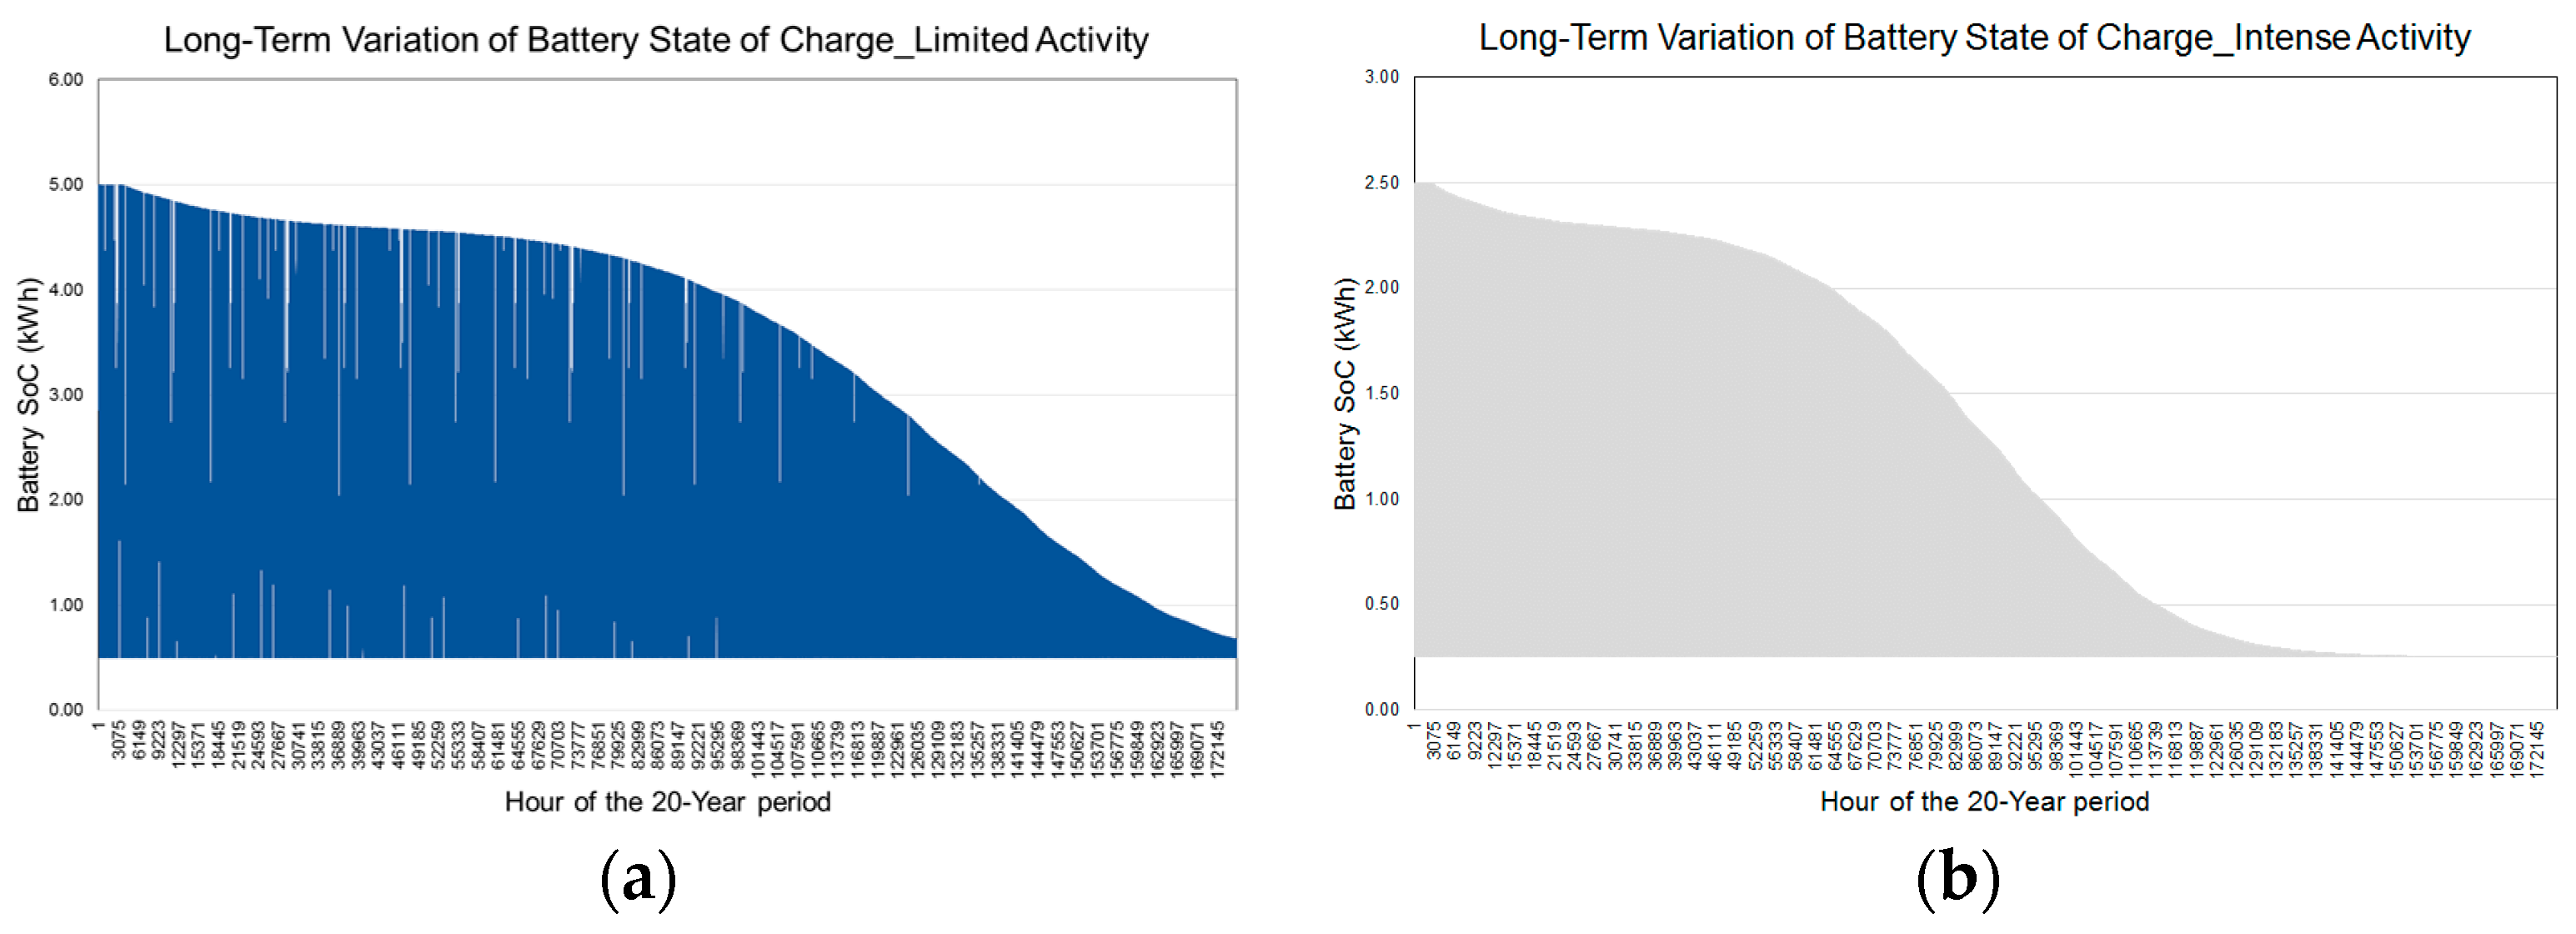
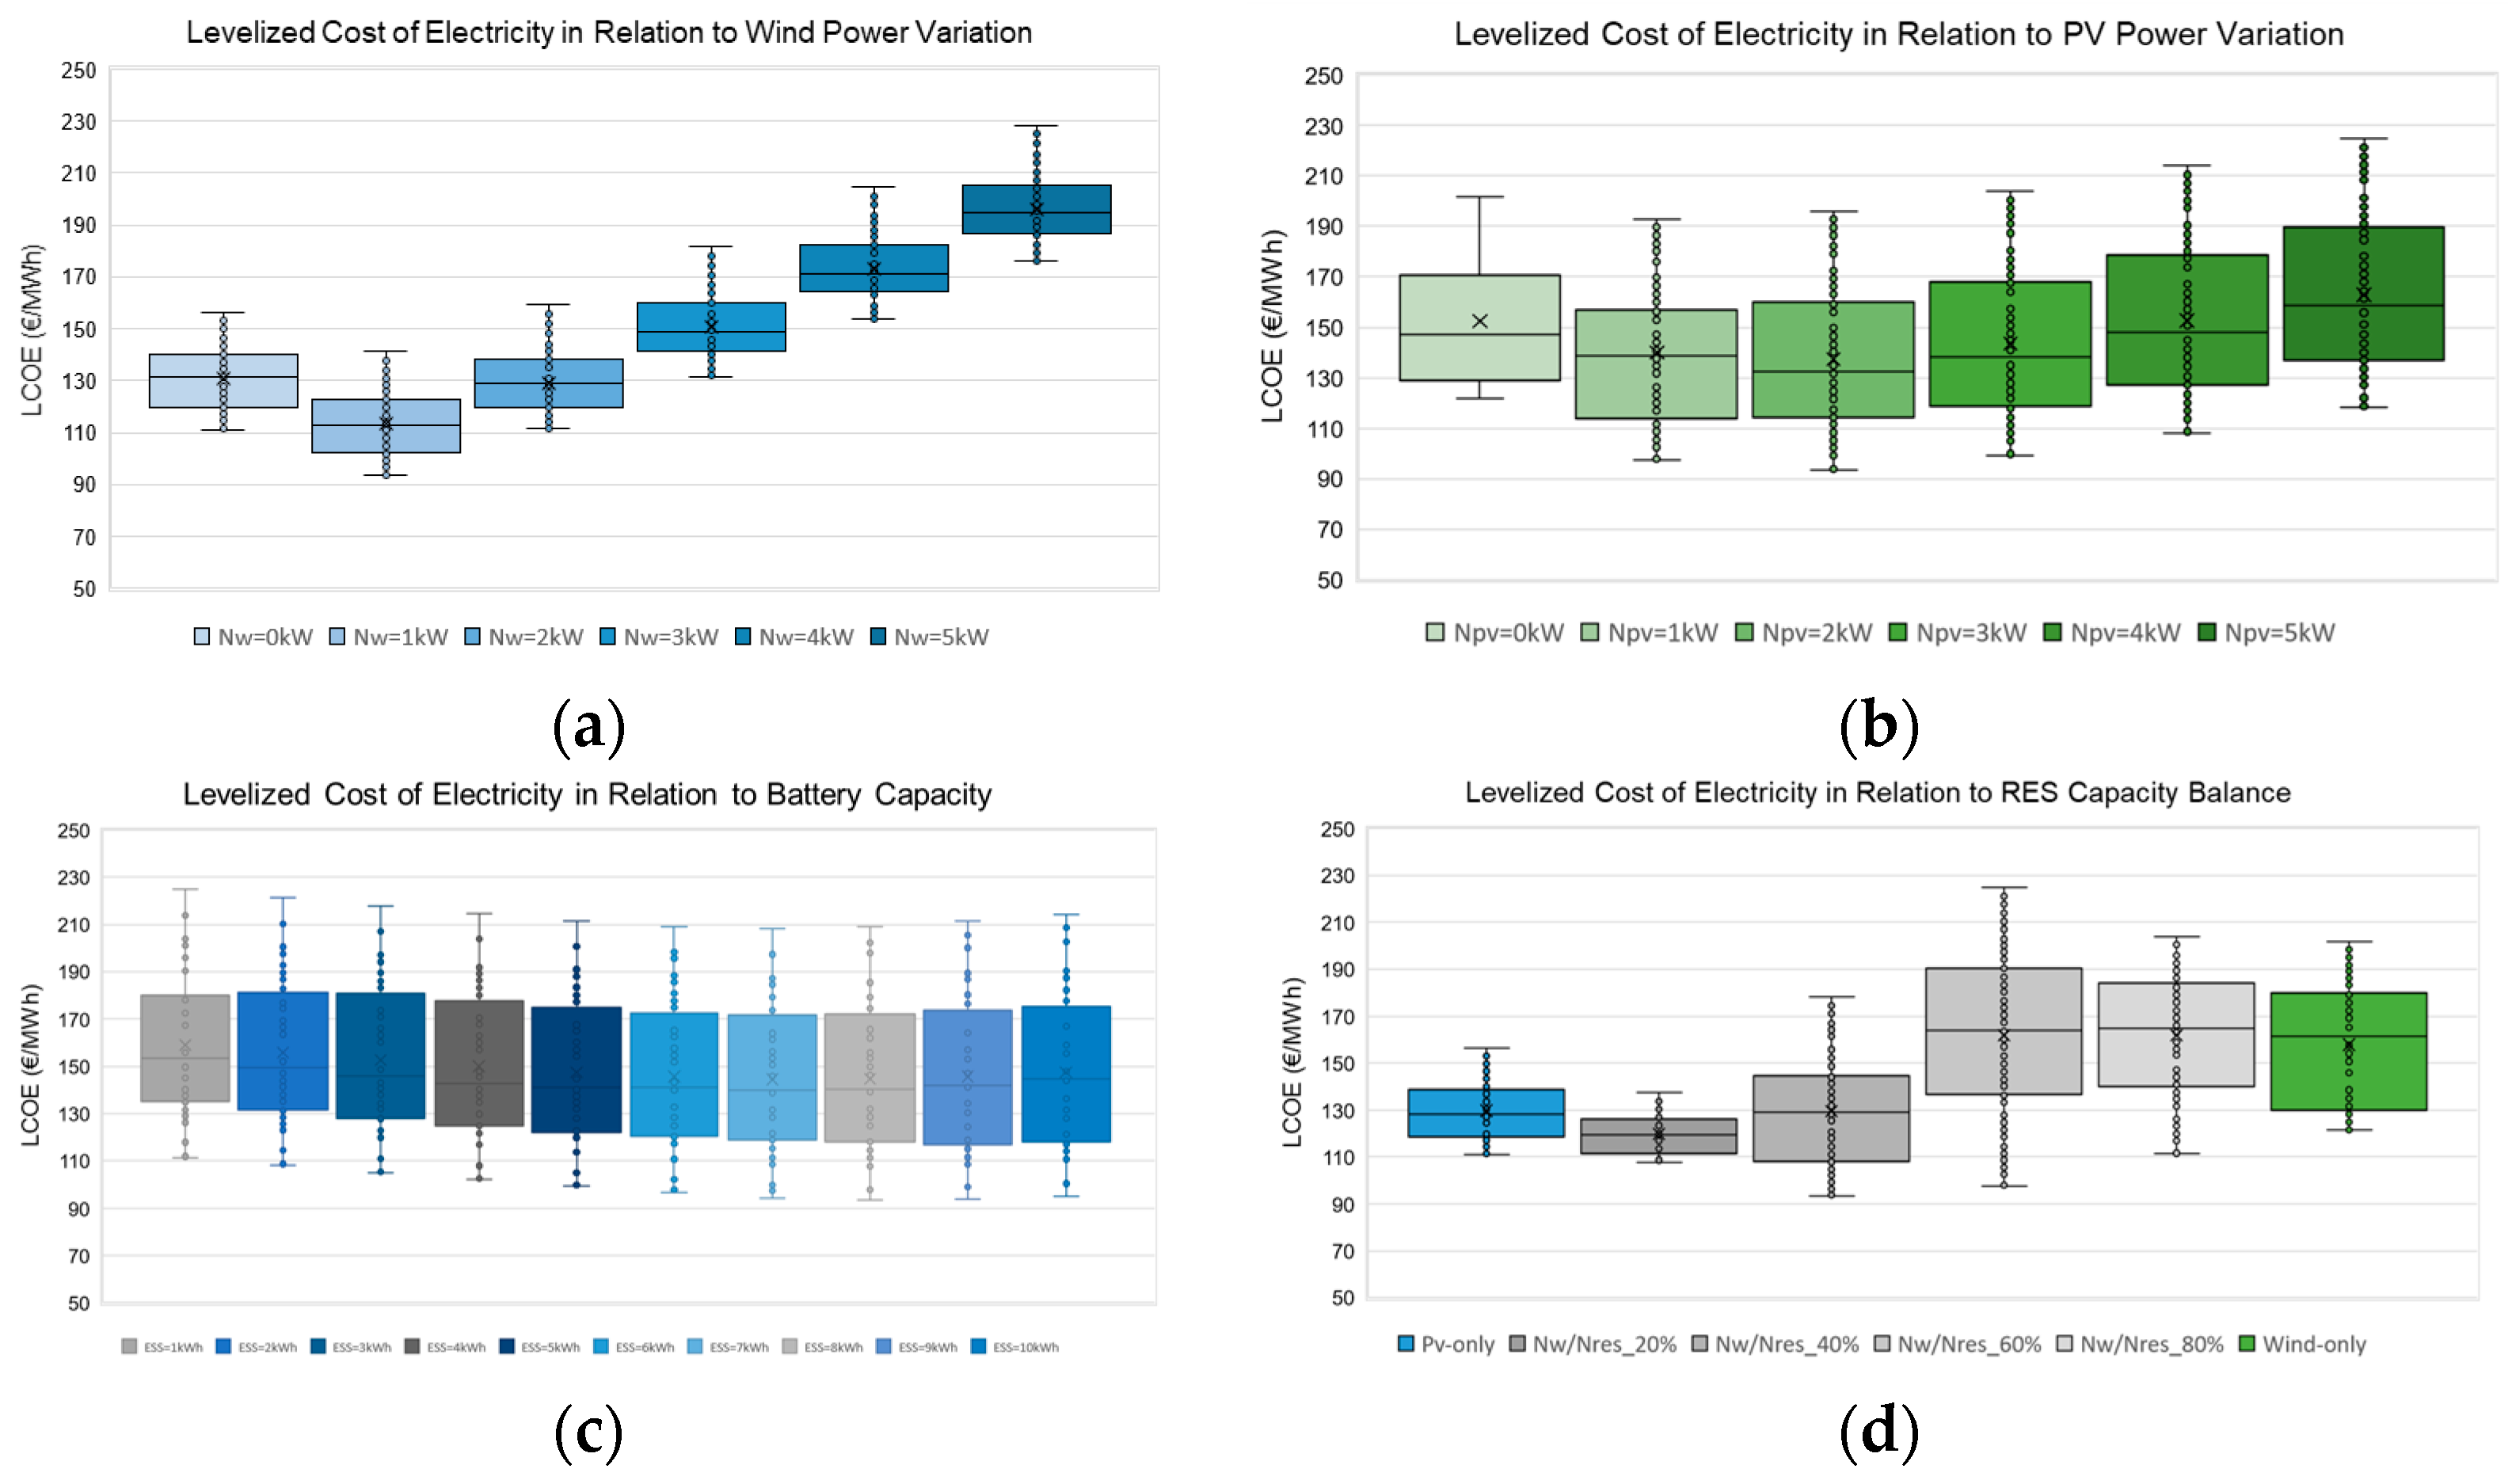
3. Results
4. Discussion and Conclusions
Author Contributions
Funding
Institutional Review Board Statement
Informed Consent Statement
Data Availability Statement
Conflicts of Interest
References
- Al-Wreikat, Y.; Attfield, E.K.; Sodré, J.R. Model for payback time of using retired electric vehicle batteries in residential energy storage systems. Energy 2022, 259, 124975. [Google Scholar] [CrossRef]
- Ntube, N.; Li, H. Stochastic multi-objective optimal sizing of battery energy storage system for a residential home. J. Energy Storage 2023, 59, 106403. [Google Scholar] [CrossRef]
- Abedi, S.; Kwon, S. Rolling-horizon optimization integrated with recurrent neural network-driven forecasting for residential battery energy storage operations. Int. J. Electr. Power Energy Syst. 2023, 145, 108589. [Google Scholar] [CrossRef]
- Thakur, J.; de Almeida, C.M.L.; Baskar, A.G. Electric vehicle batteries for a circular economy: Second life batteries as residential stationary storage. J. Clean. Prod. 2022, 375, 134066. [Google Scholar] [CrossRef]
- Braco, E.; San Martín, I.; Berrueta, A.; Sanchis, P.; Ursúa, A. Experimental assessment of cycling ageing of lithium-ion second-life batteries from electric vehicles. J. Energy Storage 2020, 32, 101695. [Google Scholar] [CrossRef]


| KPIs | Description |
|---|---|
| Battery Life Expectancy (Years) | Expected battery lifetime using an empirical cycling degradation model in accordance with the experimental findings in [5] (max period of 20 years). |
| End-User Energy Autonomy (%) | Annual coverage of residential electricity needs on the basis of energy delivered from the examined RES-battery system over a period of 20 years. |
| LCOE | Levelized cost of electricity considering investment, maintenance, and electricity import costs for a 20-year period at a discount rate of 5%. |
Disclaimer/Publisher’s Note: The statements, opinions and data contained in all publications are solely those of the individual author(s) and contributor(s) and not of MDPI and/or the editor(s). MDPI and/or the editor(s) disclaim responsibility for any injury to people or property resulting from any ideas, methods, instructions or products referred to in the content. |
© 2023 by the authors. Licensee MDPI, Basel, Switzerland. This article is an open access article distributed under the terms and conditions of the Creative Commons Attribution (CC BY) license (https://creativecommons.org/licenses/by/4.0/).
Share and Cite
Kaldellis, A.; Christopoulos, K.; Triantafyllopoulos, P.; Spyropoulos, G.; Kavadias, K.; Zafirakis, D. Investigating the Impact of Cycling Aging on the Long-Term Performance of RES-Driven, Second-Life EV Battery Storage Configurations in Residential-Scale Applications. Environ. Sci. Proc. 2023, 26, 179. https://doi.org/10.3390/environsciproc2023026179
Kaldellis A, Christopoulos K, Triantafyllopoulos P, Spyropoulos G, Kavadias K, Zafirakis D. Investigating the Impact of Cycling Aging on the Long-Term Performance of RES-Driven, Second-Life EV Battery Storage Configurations in Residential-Scale Applications. Environmental Sciences Proceedings. 2023; 26(1):179. https://doi.org/10.3390/environsciproc2023026179
Chicago/Turabian StyleKaldellis, Angelos, Konstantinos Christopoulos, Panagiotis Triantafyllopoulos, Georgios Spyropoulos, Kosmas Kavadias, and Dimitrios Zafirakis. 2023. "Investigating the Impact of Cycling Aging on the Long-Term Performance of RES-Driven, Second-Life EV Battery Storage Configurations in Residential-Scale Applications" Environmental Sciences Proceedings 26, no. 1: 179. https://doi.org/10.3390/environsciproc2023026179
APA StyleKaldellis, A., Christopoulos, K., Triantafyllopoulos, P., Spyropoulos, G., Kavadias, K., & Zafirakis, D. (2023). Investigating the Impact of Cycling Aging on the Long-Term Performance of RES-Driven, Second-Life EV Battery Storage Configurations in Residential-Scale Applications. Environmental Sciences Proceedings, 26(1), 179. https://doi.org/10.3390/environsciproc2023026179