
The Footprint of Road Transport Emissions: Electric Vehicles and Their Impact on Air Pollution Reduction in Greece †


Abstract
:1. Introduction
2. Materials and Methods
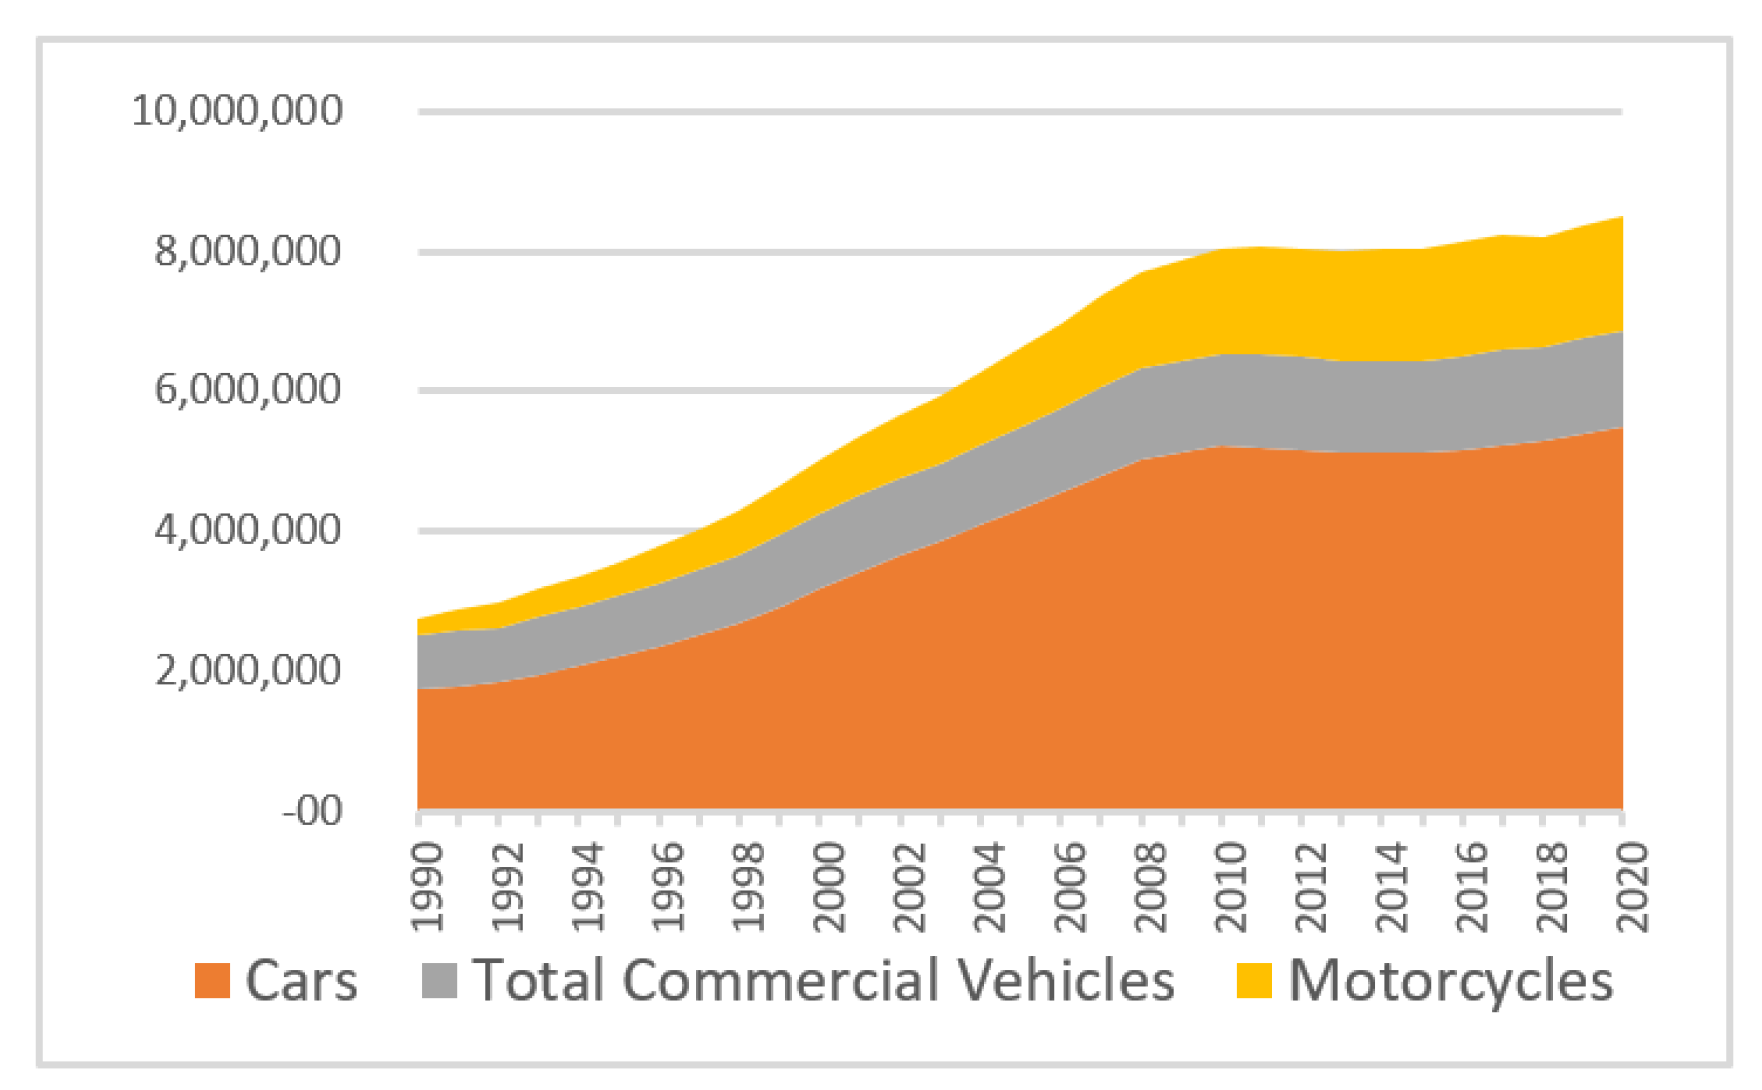
2.1. Fleet Registration 1990–2020
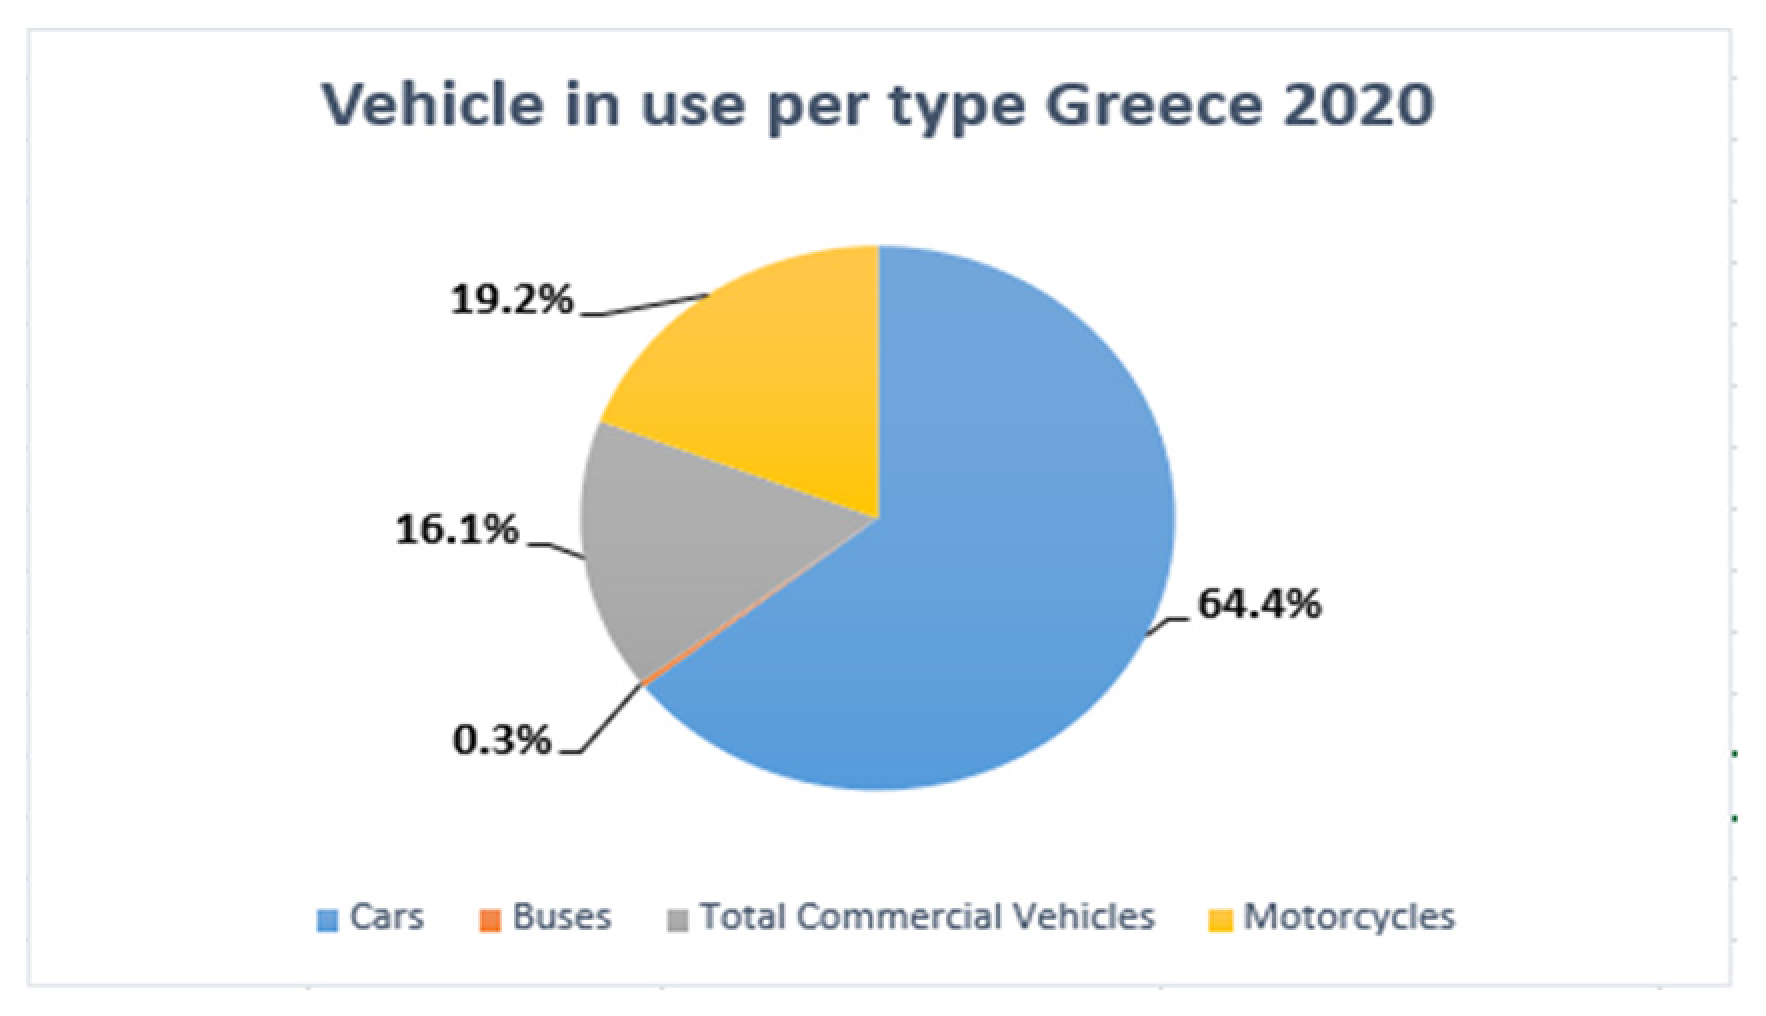
- The passenger car fleet numbered 5,492,176 vehicles in 2020, representing a 216.5% increase compared to 1990. Greece’s passenger car fleet is the largest and most polluting in the European Union, with an average age of 17 years, compared to the EU average of 12 years. In 2019, out of the 5,406,551 passenger cars, 84.27% were gasoline vehicles, 9.56% were diesel, 5.59% were dual-fuel, and about 0.5% used electric propulsion technologies (Hybrid, BEV, PHEV, etc.). The motorization rate in Greece was 496 passengers per 1000 inhabitants, which is lower than the EU average of 560 passengers per 1000 inhabitants.
- Trucks are the third-largest vehicle category, with 1,373,727 vehicles, accounting for 16.1% of the total fleet. The number of trucks in the fleet increased by 79.2%. A total of 80.4% of the truck fleet comprises LDVs (weight < 3 tn), while 19.6% comprises HDVs. In 2019, 58.3% of the truck fleet ran on diesel, 39.8% ran on petrol, and only 1.85% was dual-fuel. There were only 81 trucks with advanced technologies (Hybrid, BEV). The truck fleet in Greece has the highest average age in the EU, reaching 20.2 years for LDVs and 21.4 years for HDVs, compared to the EU averages of 11.9 and 13.9 years, respectively. The motorization rate for trucks is 110 vehicles per 1000 inhabitants, which is higher than the EU average of 81 vehicles per 1000 inhabitants.
- Motorcycles are the second-largest category of vehicles, with a total of 1,637,608 motorcycles in 2020, representing 19.2% of the fleet. The motorcycle fleet increased by 176.7% compared to 1990, while other vehicle categories experienced a decrease during the same period. Nearly the entire motorcycle fleet (99.9%) runs on gasoline, as of 2019.
2.2. Recording of Pollutant and CO2 Emissions from Road Transport 1990–2020
- Road transport accounted for 26.1% of the total CO2 emissions in 2020, 36.5% of the total CO emissions, 25% of the total NMVOC emissions, 6.7% of the total PM10 emissions, and 29.8% of NOX emissions.
- Passenger cars primarily contributed to CO2 emissions, representing 35.5% of the sector’s emissions in 2020. The corresponding percentages for other vehicle categories were 24.1% for HDVs (including buses), 14.3% for LDVs, and 5.6% for motorcycles.
- Passenger cars and motorcycles were the main contributors to CO emissions, accounting for 35.5% and 34.1%, respectively. LDVs also showed a significant contribution, at 24.1%, while HDVs accounted for only 6.2%.
- Passenger cars were the main source of NMVOC emissions, with a significant percentage (21.7%) coming from exhaust in the fuel system. LDVs accounted for 13.8%, motorcycles for 16.2%, and HDVs and buses for just 8.3%.
- HDVs were primarily responsible for NOx emissions, with 66% of the emissions in 2020. The contributions from other categories were much smaller: 18.3% from passenger cars, 13.3% from LDVs, and 2.3% from motorcycles.
- Passenger cars, and emissions from tires and brakes, were the two main sources of PM10 emissions, representing 37.7% and 34.9% of the emissions, respectively, in 2020.
2.3. Passenger Fleet Forecast Scenarios up to 2030
- Annual registrations of new passenger cars by fuel, 2006–2022.
- Annual registrations of used passenger cars by fuel, 2006–2022.
- Annual write-offs of vehicles.
2.4. Methodology for Calculating Air Pollution from Passenger Vehicles for 2030
- Ei = emissions of pollutant i [g],
- FCj,m = fuel consumption of vehicle category j using fuel m [kg],
- EFi,j,m = fuel-consumption-specific emission factor of pollutant i for vehicle category j and fuel m [g/kg].
3. Results
3.1. Passenger Fleet Forecast Scenarios for 2030
- Scenario 1: The share of BEVs in total new registrations (new passenger and used imports) is projected to reach 4.3% by 2030. This scenario was developed using exponential smoothing, based on the new registration data from 2006 to 2022.
- Scenario 2: The share of BEVs in total new registrations (new passenger and used imports) is expected to reach 12.3% by 2030. This scenario is based on the forecast from the National Energy and Climate Plan (NECP).
- Scenario 3: The share of BEVs in total new registrations (new passenger and used imports) is anticipated to reach 18.4% by 2030. This scenario is an extension of the NECP scenario, with a 50% increase.
- Scenario 4: The share of BEVs in total new registrations (new passenger and used imports) is projected to reach 2.2% by 2030. This scenario is derived from a reduction of 50% from Scenario 1.
3.2. Forecast Emissions from Passenger Cars in 2030
4. Conclusions
- The penetration of BEVs plays a crucial role in reducing emissions. However, significant results can only be achieved when this penetration is combined with a concurrent reduction in the conventional vehicle fleet.
- Hybrid vehicles can also contribute significantly to emission reduction, as demonstrated in Scenario 4. Despite a decrease in fully electric vehicles, and an increase in conventional vehicles, emissions remain at the same level as in Scenario 1.
- Even under the most optimistic scenario, it is not anticipated that CO2 emissions will fall below the 1990 levels.
- All pollutants are expected to experience a significant reduction, following the trend observed since 1990.
- The implementation of policies to address the COVID-19 pandemic in 2020 resulted in a substantial reduction in emissions. However, it is projected that emissions will reach and surpass the levels observed in 2020 after a radical fleet renewal.
Author Contributions
Funding
Institutional Review Board Statement
Informed Consent Statement
Data Availability Statement
Conflicts of Interest
References
- European Environment Agency. Annual European Union Greenhouse Gas Inventory 1990–2020 and Inventory Report 2022; European Environment Agency: Copenhagen, Denmark, 2022.
- European Environment Agency. European Union Emission Inventory Report 1990–2020 under the UNECE Air Convention; Publications Office of the European Union: Luxembourg, 2022.
- Spyropoulos, G.C.; Nastos, P.T.; Moustris, K.P. Performance of Aether Low-Cost Sensor Device for Air Pollution Measurements in Urban Environments. Accuracy Evaluation Applying the Air Quality Index (AQI). Atmosphere 2021, 12, 1246. [Google Scholar] [CrossRef]
- Ntourou, K.; Moustris, K.; Spyropoulos, G.; Fameli, K.-M.; Manousakis, N. Adverse Health Effects (Bronchitis Cases) Due to Particulate Matter Exposure: A Twenty-Year Scenario Analysis for the Greater Athens Area (Greece) Using the AirQ+ Model. Atmosphere 2023, 14, 389. [Google Scholar] [CrossRef]
- Papadimitriou, Y.; Mellios, G. ERTE2020 European Road Transport & Emissions Trends Report; Emisia: Thessaloniki, Greece, 2019. [Google Scholar]
- European Environment Agency. Air Quality in Europe—2018 Report; Publications Office of the European Union: Luxembourg, 2018.
- European Union. Council Directive 70/220/EEC of 20 March 1970 on the approximation of the laws of the Member States relating to measures to be taken against air pollution by gases from positive-ignition engines of motor vehicles. Off. J. Eur. Union 1970, 76, 1. [Google Scholar]
- European Union, Regulation (EU). No 1347/2017 of the European Parliament and of the Council of 13 July 2017 Correcting Directive 2007/46/EC of the European Parliament and of the Council, Text with EEA Relevance; EU: Brussels, Belgium, 2017. [Google Scholar]
- ACEA. Fact Sheet: ‘Euro’ Pollutant Emission Standards; ACEA: Brussels, Belgium, 2022. [Google Scholar]
- Georgios, M. Recording of the Vehicle Fleet in Attica and Its Contribution to Atmospheric Pollution. Master’s Thesis, University of West Attica, Athens, Greece, 2021. [Google Scholar]
- Valavanidis, A.; Vlachogianni, T.; Loridas, S.; Fiotakis, C. Atmospheric Pollution in Urban Areas of Greece and Economic Crisis; Department of Chemistry, University of Athens: Athens, Greece, 2015. [Google Scholar]
- HAS Hellenic Statistical Authority (HSA). Available online: https://www.statistics.gr/ (accessed on 8 May 2021).
- ACEA. Vehicles in Use—Europe 2017; European Automobile Manufacturers Association: Brussels, Belgium, 2017. [Google Scholar]
- ACEA. Vehicles in Use—Europe 2018; European Automobile Manufacturers Association: Brussels, Belgium, 2018. [Google Scholar]
- ACEA. Vehicles in Use—Europe 2019; European Automobile Manufacturers Association: Brussels, Belgium, 2019. [Google Scholar]
- ACEA. Vehicles in Use—Europe 2020; European Automobile Manufacturers Association: Brussels, Belgium, 2020. [Google Scholar]
- ACEA. Vehicles in Use—Europe 2021; European Automobile Manufacturers Association: Brussels, Belgium, 2021. [Google Scholar]
- Emisia, A. Spin-Off Company (EMISIA) of the Aristotle University of Thessaloniki. Available online: https://www.emisia.com (accessed on 8 May 2021).
- Ministry of Environment and Energy. National Inventory Report of Greece for Greenhouse and Other Gases for the Years 1990–2020; Ministry of Environment and Energy: Athens, Greece, 2022.
- CEIP. Data Viewer—Reported Emissions Data. Available online: https://www.ceip.at/data-viewer (accessed on 10 April 2023).
- Holt, C.C. Forecasting Seasonals and Trends by Exponentially Weighted Averages (O.N.R. Memorandum No. 52); Carnegie Institute of Technology: Pittsburgh, PA, USA, 1957. [Google Scholar]
- Spyropoulos, G.C.; Nastos, P.T.; Moustris, K.P.; Chalvatzis, K.J. Transportation and Air Quality Perspectives and Projections in a Mediterranean Country, the Case of Greece. Land 2022, 11, 152. [Google Scholar] [CrossRef]
- Ntziachristos, L.; Samaras, Z. EMEP/EEA Air Pollutant Emission Inventory Guidebook 2021—1.A.3.b.i-iv Road Transport 2019. EMEP/EEA. 2020. Available online: https://www.eea.europa.eu/publications/emep-eea-guidebook-2019/part-b-sectoral-guidance-chapters/1-energy/1-a-combustion/1-a-3-b-i/view (accessed on 10 February 2023).


| Year | Total | Petrol | Diesel | BiFuel | Hybrid | BEV |
|---|---|---|---|---|---|---|
| 2019 | 5,406,551 | 4,555,853 | 516,855 | 302,097 | 27,326 | 2336 |
| Scen.1 2030 | 7,153,494 | 4,916,522 | 978,361 | 365,849 | 802,466 | 64,922 |
| Scen.2 2030 | 7,153,494 | 4,980,397 | 833,916 | 365,849 | 802,466 | 145,492 |
| Scen.3 2030 | 7,153,494 | 4,976,470 | 769,289 | 365,849 | 802,466 | 214,046 |
| Scen.4 2030 | 7,153,494 | 4,942,503 | 980,650 | 365,849 | 802,466 | 36,652 |
| Year | CO2 (kt) | CO (kt) | NMVOC (kt) | PM10 (kt) | NOX (kt) |
|---|---|---|---|---|---|
| 1990 | 11,793.06 | 871.84 | 170.17 | 6.85 | 154.00 |
| 2020 | 6565.5 | 51.9 | 12.0 | 0.1 | 11.0 |
| Scen.1 2030 | 6563.01 | 54.77 | 1.84 | 0.017 | 8.57 |
| diff (%) 1990 | 16.88% | −90.81% | −97.89% | −98.21% | −84.48% |
| diff (%) 2020 | −0.04% | 5.53% | −84.69% | −70.94% | −21.86% |
| Sen.2 2030 | 6012.54 | 54.75 | 1.78 | 0.015 | 9.02 |
| diff (%) 1990 | 7.07% | −90.81% | −97.96% | −98.40% | −83.66% |
| diff (%) 2020 | −8% | 6% | −85% | −74% | −18% |
| Scen.3 2030 | 5755.00 | 54.55 | 1.75 | 0.00 | 8.23 |
| diff (%) 1990 | 2.49% | −90.85% | −97.99% | −100.00% | −85.09% |
| diff (%) 2020 | −12% | 5% | −85% | −100% | −25% |
| Scen.4 2030 | 6581.07 | 54.91 | 1.84 | 0.02 | 9.04 |
| diff (%) 1990 | 17.20% | −90.78% | −97.88% | −98.20% | −83.62% |
| diff (%) 2020 | 0.24% | 5.82% | −84.67% | −70.87% | −17.57% |
Disclaimer/Publisher’s Note: The statements, opinions and data contained in all publications are solely those of the individual author(s) and contributor(s) and not of MDPI and/or the editor(s). MDPI and/or the editor(s) disclaim responsibility for any injury to people or property resulting from any ideas, methods, instructions or products referred to in the content. |
© 2023 by the authors. Licensee MDPI, Basel, Switzerland. This article is an open access article distributed under the terms and conditions of the Creative Commons Attribution (CC BY) license (https://creativecommons.org/licenses/by/4.0/).
Share and Cite
Maniotis, G.; Spyropoulos, G.; Christopoulos, K. The Footprint of Road Transport Emissions: Electric Vehicles and Their Impact on Air Pollution Reduction in Greece. Environ. Sci. Proc. 2023, 26, 146. https://doi.org/10.3390/environsciproc2023026146
Maniotis G, Spyropoulos G, Christopoulos K. The Footprint of Road Transport Emissions: Electric Vehicles and Their Impact on Air Pollution Reduction in Greece. Environmental Sciences Proceedings. 2023; 26(1):146. https://doi.org/10.3390/environsciproc2023026146
Chicago/Turabian StyleManiotis, Georgios, Georgios Spyropoulos, and Konstantinos Christopoulos. 2023. "The Footprint of Road Transport Emissions: Electric Vehicles and Their Impact on Air Pollution Reduction in Greece" Environmental Sciences Proceedings 26, no. 1: 146. https://doi.org/10.3390/environsciproc2023026146
APA StyleManiotis, G., Spyropoulos, G., & Christopoulos, K. (2023). The Footprint of Road Transport Emissions: Electric Vehicles and Their Impact on Air Pollution Reduction in Greece. Environmental Sciences Proceedings, 26(1), 146. https://doi.org/10.3390/environsciproc2023026146