Abstract
Climate change raises concerns over the sustainability of the outdoor thermal environment and its impacts on societies. This study aims to examine the thermal conditions in Athens metropolitan area, Greece. Hourly data from 15 stations of the Automatic Weather Station Network of the National Observatory of Athens (2010–2021) were used to estimate the Net Effective Temperature (NET) and the Universal Thermal Climate Index (UTCI). The NET and UTCI were higher within the Athens basin (NET: mean ± sd = 15.3 ± 7.1 °C; UTCI: mean ± sd = 18.9 ± 10.4 °C) than in the surrounding area (NET: mean ± sd = 11.2 ± 9.3 °C; UTCI: mean ± sd = 13.4 ± 13.4 °C; p < 0.001). The highest numbers of hours with unfavorable warm conditions were found in Faliro (28.6%, NET; 27.7%, UTCI), Neos Kosmos (28.6%, NET; 27.4%, UTCI) and Patissia (28.6%, NET; 27.2%, UTCI). With respect to unfavorable cool conditions, the highest number was in Spata (65.1%, NET; 28.4%, UTCI).
1. Introduction
Urban areas are key contributors to global warming and climate change because industries, transport and waste disposal are major sources of greenhouses gases [1]. On the other hand, global warming increases extreme weather events, making populations in cities vulnerable to several direct and indirect effects [2]. Heatwaves, droughts and storms change natural and social resources suddenly and unexpectedly and impose important costs on economies and societies. Water supplies, infrastructure and properties are seriously affected and often damaged, and human health is at great risk as morbidity and mortality increase [3].
The outdoor thermal environment is identified as a significant threat to well-being. It is the combined effect of several meteorological factors, which, however, may vary greatly between areas within an urban setting. These meteorological factors are frequently combined into a single kind of value, namely, a thermal index [4]. Thermal indices assess the thermal environment by quantifying human thermal perception. They assign their estimations (often measured in degrees Celsius) to a category of an assessment scale expressing the degree of human thermal sensation (e.g., very cold, cold, cool, neutral, warm, hot, very hot), discomfort (e.g., no, noticeable, evident, great, dangerous discomfort) or stress (e.g., slight, moderate, strong, very, extreme cold/warm stress).
The aim of this study was to examine the spatial variation of two thermal indices in the metropolitan area of Athens, Greece, in order to identify areas with unfavorable thermal conditions. In view of climate change, and given the rising concern over the sustainability of the thermal environment, the findings of this study could contribute to the development of strategies with which to address environmental impacts.
2. Data and Methodology
The data included hourly values of air temperature (Tair, °C), relative humidity (Rh, %) and wind speed (WS, m/s) recorded from 2010 to 2021 in 15 weather stations (8 within Athens basin and 7 in the surrounding area) of the Automatic Weather Station Network of the National Observatory of Athens (NOAAN). Hourly data of global solar radiation (SR, W/m2) were recorded in three stations (Ampelokipoi, Markopoulo and Spata). The stations were classified into two regions (Figure 1) with respect to their location, i.e., within Athens basin—the area bounded by the four large mountains of Athens metropolitan area: Mount Egaleo to the west, Mount Parnitha to the north, Mount Penteli to the northeast and Mount Hymettus to the east—and in the surrounding area of the Athens basin.
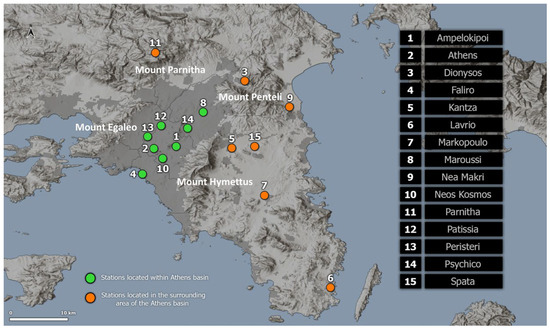
Figure 1.
Stations of the Automatic Weather Station Network of the National Observatory of Athens (NOAAN) in the Athens metropolitan area.
The thermal conditions were assessed using the Net Effective Temperature (NET, °C) and the Universal Thermal Climate Index (UTCI, °C). The NET and UTCI are calculated in degrees Celsius and can be assigned to a category of an assessment scale expressing the estimated degree of human thermal sensation or stress. The NET [5] is estimated by a simple statistical formula involving Tair, Rh and WS, and it assesses thermal sensation based on a 7-point scale ranging from ‘very cold’ (−3) to ‘very hot’ (+3) (Table 1). The UTCI [6] is a thermophysiological index calculated via Tair, Rh, WS and SR. The UTCI assesses the thermal stress using a 10-point scale ranging from ‘extreme cold stress’ (−5) to ‘extreme heat stress’ (+4) (Table 1).

Table 1.
Assessment scales of the Net Effective Temperature (NET, °C) and Universal Thermal Climate Index (UTCI, °C).
The NET and UTCI were calculated using hourly data and independently for each station. In lack of SR monitoring, data were used from the closest available station of NOAAN. In order to facilitate comparisons between indices’ estimations and the interpretation of results, the estimated category of perception (i.e., thermal sensation or stress) was assigned to a common numerical scale for both indices, ranging from −5 to +4 (i.e., the General Category column in Table 1). Additionally, the original assessment scales of the NET and UTCI were collapsed into three categories: ‘cool’, ‘neutral’ and ‘warm’ (three-point scales; Table 1).
Statistical Analysis
Statistics including mean, median, standard deviation, interquartile, maximum and minimum values were used to summarize the data and indices’ estimations. The frequency of indices’ categorical estimations, the hours of the day and the number of days in which warm/cold thermal conditions prevail were estimated in order to compare the spatial variation of the NET and UTCI. The number of days with unfavorable thermal conditions were considered using the mean values of the indices and when the corresponded perception was classified to the ‘cool’ or ‘warm’ categories of the three-point assessment scale.
The equality of means was examined using the t-test. The two-sample test of proportions was used to test the equality of proportions.
3. Results
The summary statistics of the hourly data showed that Tair ranged between −12 °C and 43.4 °C (mean ± sd = 18.1 ± 7.8 °C, median = 17.6 °C; Table 2), with the mean Tair to be higher in stations within the Athens basin (19.2 °C) than in the surrounding area (16.9 °C; p < 0.001). Similarly, the mean NET was estimated to be 15.3 °C in stations within the Athens basin and 11.2 °C in the surrounding area, both corresponding to the ‘cool’ (−1) category of the original NET assessment scale. The mean UTCI was 18.9 °C in the Athens basin and 13.4 °C in the surrounding area, corresponding to the ‘no thermal stress’ category (0).

Table 2.
Summary statistics of air temperature (Tair), thermal indices and thermal indices’ estimations according to their assessment scales.
In summer, the hourly mean Tair reached 31.5 °C at 14:00 (Local Standard Time—LST) in the Athens basin, while in the surrounding area, the maximum hourly mean was 28.5 °C at 13:00 and 14:00 LST (Figure 2). In the Athens basin, the ‘warm’ thermal conditions (three-point scales; i.e., NET > 21 °C and UTCI > 26 °C) prevail during the entire day according to the NET and from 7:00 to 19:00 LST according to the UTCI. In the surrounding area, ‘cool’ conditions (three-point scales; NET < 17 °C and UTCI < 9 °C) were found during the entire day according to the NET and from 16:00 to 9:00 according to the UTCI.
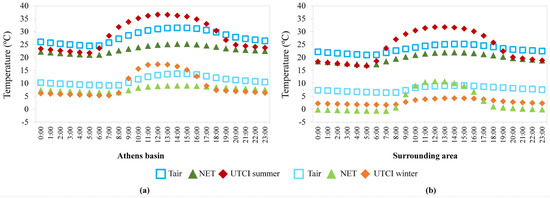
Figure 2.
Mean air temperature (Tair), Net Effective Temperature (NET) and Universal Thermal Climate Index in each hour of a day (LST) in summer and winter for the stations (a) within the Athens basin and (b) in the surrounding area.
The highest mean Tair over the years was found in the stations of Faliro (19.8 °C), Neos Kosmos (19.7 °C) and Patissia (19.6 °C) across the Athens basin and of Lavrio (19.1 °C) in the surrounding area (Figure 3). The highest mean of the indices was found in the stations of Faliro (NET, 16.2 °C; UTCI, 19.9 °C) and Patissia (NET, 16.1 °C; UTCI, 19.9 °C). In the surrounding area of Athens, the highest means of NET (14.7 °C) and UTCI (18.3 °C) were found in Kantza station (Figure 3).
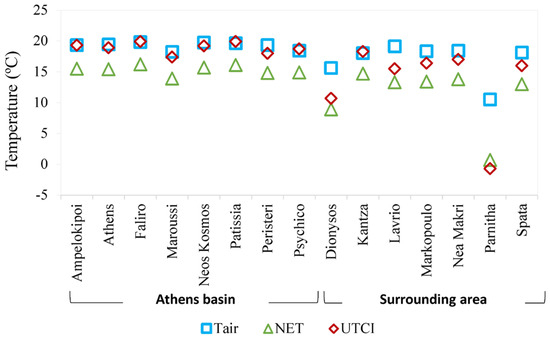
Figure 3.
Mean air temperature (Tair), Net Effective Temperature (NET) and Universal Thermal Climate Index over the period of study for the 15 stations of the Automatic Weather Station Network of the National Observatory of Athens (NOAAN) in the Athens metropolitan area.
The NET and UTCI estimations extend over the entire range of their assessment scale (Figure 4). The highest frequency of NET estimations in categories 1 (10.4%) and 2 (16.5%) was found in Faliro, and in category 3 in Neos Kosmos (3.1%). Similarly, UTCI estimations in categories 1 (15%) and 2 (9.6%) were more frequent in Faliro, whereas those in category 3 were more frequent in Patissia (4.5%). The highest frequency of NET estimations in categories −2 (20.6%) and −3 (5.1%) was found in Maroussi, whereas according to the UTCI, the Maroussi station showed the highest frequency of estimations in categories −1 (18%) and −2 (4.4%).
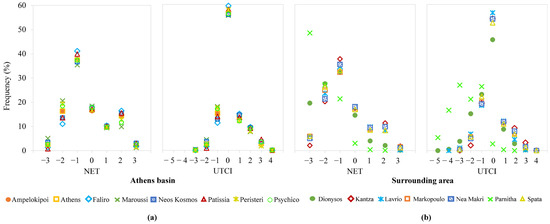
Figure 4.
Frequency of hours classified into the categories of thermal perception according to the Net Effective Temperature (NET) and Universal Thermal Climate Index (UTCI) in 15 stations (a) within Athens basin and (b) in the surrounding area of Athens.
Focusing on the three-point assessment scale of thermal perception, NET classifications were more frequent in the negative categories than the UTCI. The NET classified 63.1% of its estimations to the ‘cool’ (−1 to −3) and 20.7% to ‘warm’ (1 to 3) categories of the three-point scale, while the UTCI classified 25.8% to the ‘cool’ (−1 to −5) and 21.1% to the ‘warm’ categories (1 to 4). In the Athens basin (Figure 5a), the highest frequency of estimations in the ‘warm’ categories of the three-point scale was found in Faliro (28.6%, NET; 27.7%, UTCI), Neos Kosmos (28.6%, NET; 27.4%, UTCI) and Patissia (28.6%, NET; 27.2%, UTCI). Considering the ‘cool’ categories, the highest frequency was found in Maroussi (61.1%,NET; 22.8%, UTCI). In the surrounding area (Figure 5b), the highest frequency of indices’ estimations in the ‘warm’ category was in Kantza (22.6%, NET; 24.2%, UTCI), and in the ‘cool’ category, in Parnitha (96.5%-NET; 70.6%-UTCI). Excluding Parnitha and Dionysos stations (altitudes over 500 m), the highest frequency in the ‘cool’ categories was found in Spata (65.1%, NET; 28.4%, UTCI).
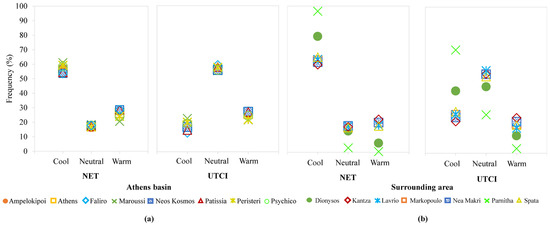
Figure 5.
Distribution of hours classified in the ‘cool’, ‘neutral’ or ‘warm’ categories of the three-point assessment scale according to the Net Effective Temperature (NET) and Universal Thermal Climate Index (UTCI) (a) within Athens basin and (b) in the surrounding area of Athens.
About 28% of the days (daily mean values) were classified in the ‘warm’ category in the warmest areas of Athens basin (Faliro: 28.4% (NET), 28.3% (UTCI); Neos Kosmos 28.5% (NET), 27.3% (UTCI); Patissia 28.8% (NET), 28.5% (UTCI)) and 23% in the surrounding area (Kantza 23% (NET), 22.4% (UTCI); Figure 6). In the coolest areas—Parnitha, Dionysos and Spata—the frequency of ‘cool’ days was over 70% for Parnitha (98%, NET; 72.5%, UTCI), over 40% for Dionysos (80.2%, NET; 40.7%, UTCI) and 22% for Spata (65.5%, NET; 22.8%, UTCI).

Figure 6.
Distribution of days with the Net Effective Temperature (NET) and Universal Thermal Climate Index (UTCI) estimations classified in categories ‘cool’ and ‘warm’ according to the three-point assessment scale.
4. Conclusions
This study assessed the thermal conditions in the metropolitan area of Athens in order to examine variations in thermal load and to identify areas with unfavorable conditions. Warmer thermal conditions were identified within the Athens basin compared to the surrounding area. Unfavorable warm conditions were the most frequent in Faliro, Neos Kosmos and Patissia within the Athens basin and in Kantza in the surrounding area. Unfavorable cool conditions were most often estimated in Maroussi within the Athens basin and in Spata in the surrounding area.
The thermal environment is an important environmental hazard that, combined with other environmental variables such as air pollution, may affect human health and quality of life. Assessing urban thermal conditions could assist in selecting useful policies for health, tourism, urban planning and energy efficiency.
Author Contributions
Conceptualization, V.K. and K.L.; methodology, K.P., V.K. and K.L.; formal analysis, K.P.; resources, V.K. and K.L.; data curation, K.P.; writing—original draft preparation, K.P.; writing—review and editing, K.P., V.K. and K.L.; supervision, V.K. and K.L.; project administration, V.K. and K.L.; funding acquisition, V.K. All authors have read and agreed to the published version of the manuscript.
Funding
This research work was funded by project BIOCLIMATE (Grant Agreement: G-2212-65296, European Climate Foundation).
Institutional Review Board Statement
Not applicable.
Informed Consent Statement
Not applicable.
Data Availability Statement
The data presented in this study can be available on reasonable request from Dr K. Lagouvardos.
Conflicts of Interest
The authors declare no conflict of interest.
References
- Kennedy, C.; Steinberger, J.; Gasson, B.; Hansen, Y.; Hillman, T.; Havránek, M.; Pataki, D.; Phdungsilp, A.; Ramaswami, A.; Mendez, G.V. Greenhouse gas emissions from global cities. Environ. Sci. Technol. 2009, 43, 7297–7302. [Google Scholar] [CrossRef] [PubMed]
- European Commission (EC) Consequences of Climate Change. Available online: https://ec.europa.eu/clima/climate-change_en (accessed on 8 March 2023).
- Environmental Protection Agency (EPA) Climate Change. Available online: https://www.epa.gov/climate-change (accessed on 8 March 2023).
- de Freitas, C.R.; Grigorieva, E.A. A comparison and appraisal of a comprehensive range of human thermal climate indices. Int. J. Biometeorol. 2017, 61, 487–512. [Google Scholar] [CrossRef] [PubMed]
- Li, P.W.; Chan, S.T. Application of a weather stress index for alerting the public to stressful weather in Hong Kong. Meteorol. Appl. 2000, 7, 369–375. [Google Scholar] [CrossRef]
- Błazejczyk, K.; Jendritzky, G.; Bröde, P.; Fiala, D.; Havenith, G.; Epstein, Y.; Psikuta, A.; Kampmann, B. An introduction to the Universal thermal climate index (UTCI). Geogr. Pol. 2013, 86, 5–10. [Google Scholar] [CrossRef]
Disclaimer/Publisher’s Note: The statements, opinions and data contained in all publications are solely those of the individual author(s) and contributor(s) and not of MDPI and/or the editor(s). MDPI and/or the editor(s) disclaim responsibility for any injury to people or property resulting from any ideas, methods, instructions or products referred to in the content. |
© 2023 by the authors. Licensee MDPI, Basel, Switzerland. This article is an open access article distributed under the terms and conditions of the Creative Commons Attribution (CC BY) license (https://creativecommons.org/licenses/by/4.0/).