Abstract
Based on the value of statistical life and the willingness to pay methods, we estimated the economic cost resulting from premature mortality associated with fine particulate matter and ground-level ozone exposure across Greece during 2004–2019 under a constant and changing income elasticity scenario. The spatiotemporal trends of the economic burden were also investigated. The total economic burden attributable to premature mortality due to exposure to PM2.5 and O3 for the 16-year period was estimated at EUR 66.34 billion under the constant scenario and at EUR 273.65 billion under the changing scenario. A dramatic decline of the mortality cost was observed from 2009 to 2019 in the changing scenario, as opposed to a less profound downward trend under the constant scenario, where the annual gross domestic product and the consumer price index were not taken into account.
1. Introduction
It is well established that poor air quality adversely affects public health, especially in low- and middle-income countries [1]. A large body of the international literature has demonstrated that exposure to particles with an aerodynamic diameter ≤2.5 μm (PM2.5) is strongly related to increased risk of morbidity and mortality from a wide spectrum of causes, with cardiovascular and respiratory diseases being the most frequently reported [2]. In addition, ground-level ozone (O3), which is formed in the atmosphere through photochemical reactions of other pollutants (i.e., NOx and VOCs), is associated with respiratory disorders, as well as all-cause and cause-specific mortality [3].
Apart from its impact on public health, air pollution causes major economic losses resulting from the costs related to lower labor productivity, hospitalization, mortality and loss of welfare [4]. The global welfare losses attributed to exposure to PM2.5, household air pollution, and ground-level O3 increased from USD 2.6 trillion in 1990 to USD 5.1 trillion in 2013, while the equivalent forgone labor income increased from USD 162 billion in 1990 to USD 225 billion in 2013 [5]. According to the World Bank, in 2019, the economic loss associated with exposure to fine particulates ranged between 1.7% of North America’s gross domestic product (GDP) and 10.3% of South Asia’s GDP, causing a total economic damage of USD 8.1 trillion globally.
This work focuses on Greece, where exceedances of the EU air quality standards and the WHO recommendations are frequently reported, despite the decreasing trends observed in the emission of air pollutants during the last two decades. Nevertheless, studies assessing the economic loss attributed to air pollution in Greece are sparse. The existing literature mostly focuses on specific Greek regions and/or emissions from specific activities [6] or examines the costs for specific years exclusively [7]. However, a holistic approach covering the whole country and examining the evolution of the relevant burden throughout the years is missing. This study aims to fill this literature gap by quantifying the economic burden of premature mortality related to long-term exposure to PM2.5 and ground-level O3, examining both the country as a whole and its various sub-regions separately for sixteen years, from 2004 to 2019.
2. Materials and Methods
2.1. Data Sources
The datasets used in this study cover the period 2004 to 2019. In order to investigate the economic loss caused by exposure to PM2.5 and O3, data describing air pollution exposure, all-cause mortality rates, economic parameters and population counts were used. The PM2.5 and O3 concentrations were derived from the Copernicus Atmospheric Monitoring Service (CAMS) global reanalysis (EAC4), which covers the period 2003–2022 [8]. Specifically, 3 h surface PM2.5 and O3 concentrations (μg/m3) were used, with a 0.75° × 0.75° spatial resolution for the 16-year time period (2004–2019), covering the domain 34°N–42°N, 19°Ε–28°E. The mortality and economic data were obtained from the Hellenic Statistical Authority. The mortality data included daily all-cause casualties per region (13 regions in total), while the economic data included the GDP per capita for each region and the consumer price index (CPI), for the period 2004–2019. The region-level and age-specific population data were obtained from the demographic censuses of 2011 and 2021.
2.2. Estimation of Premature Mortality
In order to estimate the health burden resulting from PM2.5 and O3 exposure, the AirQ+ software was used. AirQ+ is a tool developed by the WHO Regional Office for Europe for quantifying the health impacts of air pollution. All calculations performed with AirQ+ are based on methodologies and concentration–response functions established by previous epidemiological studies [9]. For this study, we calculated the premature mortality attributed to long-term exposure to PM2.5 and O3 (number of attributable cases per region), from 2004 to 2019, using annual averages of the air quality data, population-at-risk data (number of adults at ≥30 years of age), baseline rates of health outcomes per region, the cut-off value of 10 μg/m3 for PM2.5, as recommended by WHO [10], and the AirQ+ default relative risk values (RR) from a meta-analysis of 13 cohort studies.
2.3. Estimation of Economic Burden
To evaluate the economic burden from premature mortality associated with PM2.5 and O3 exposure, the value of a statistical life (VSL) was used. VSL represents the willingness of people to sacrifice wealth (willingness to pay—WTP) in order to achieve lower death rates in various aspects of their daily lives. Consequently, VSL is the local tradeoff rate between fatality risk and money and has been widely applied in many sectors (environment, transportation, medicine, etc.) in order to develop relevant policies [11].
To investigate the temporal and spatial patterns, as well as the trends of the economic loss resulting from premature mortality due to PM2.5 and O3 exposure, two scenarios were applied. The first one is a constant scenario, in which we assume that the income elasticity is constant and equal across all regions of Greece. In this scenario, the VSL is also constant, with 2005 being the standardized year for all regions and for the whole time period (2004–2019). The year 2005 was selected as the reference year, as the OECD base value of USD 3 million in 2005 has been the starting point for calculating VSL values both for the OECD and other countries. The second is a changing scenario, with the VSL following the annual change in GDP and CPI per region. Therefore, in the changing scenario, not only the population, the mortality rate and the air pollutants’ concentrations constitute driving forces for the changes in economic loss, but the changes in GDP and CPI are also important. For this study, we calculated the VSL per region for the period 2004–2019 and per scenario using Equations (1) and (2) [12]:
where VSLconstant and VSLchanging are the VSL values per region and year, and VSL2005 is the base value for the OECD countries. Y2005 is the GDP per capita in Greece for 2005, and YC is the GDP per capita in each region for 2005. β denotes the income elasticity of the VSL. All VSL values were calculated using an income elasticity of 0.8, following the OECD recommendation for transfers of the VSL between OECD (and EU) member countries (OECD, 2012). %∆P and %∆Y are the percentage changes in CPI and GDP per capita growth in each region from 2004 to 2019 [13].
VSLconstant = VSL2005*(Yc/Y2005)β
VSLchanging = VSL2005*(Yc/Y2005)β*(1 + %ΔP + %ΔY)β
The economic burden (loss) caused by the premature mortality M attributed to PM2.5 and O3 exposure per region and year was calculated as follows:
where M was calculated with the AirQ+ software.
Economic Burden = VSLconstant/changing*M
2.4. Trend Analysis
In order to identify positive or negative trends (and their statistical significance) in the PM2.5 and O3 concentrations throughout the period 2004–2019, the annual means were subjected to the Mann–Kendall test and Sen’s slope estimation [14]. Using the Mann–Kendall test, we calculated the p value, which determines the significance of the trend or the rejection of the null hypothesis, according to which the significance level α is considered. The magnitude of the trend was estimated using Sen’s slope.
3. Results
3.1. Trends of PM2.5 and O3, and Attributable Mortality over Greece from 2004 to 2019
Considering the whole period 2004–2019, the annual concentration of PM2.5 showed a statistically significant decline. Specifically, it showed small fluctuations on a national level, remaining almost stable until 2010, and followed a declining trend afterwards, reflecting the great financial crisis that started in late 2009, during which private transportation, energy consumption and heating oil combustion were significantly reduced. On the other hand, no statistically significant trend was observed for O3 during the period 2004–2016. Nevertheless, during the years that followed the fiscal recession, an increase in the annual mean O3 concentrations was observed, but rarely exceeded the WHO recommended threshold (100 μg/m3, daily maximum 8 h mean), resulting in very low mortality. Comparing the contributions of the two pollutants studied, O3 was found to have an almost negligible impact on death counts, while premature mortality was primarily driven by the levels of PM2.5.
3.2. Trends of the Economic Burden Resulting from Premature Mortality Attributed to PM2.5 and O3 Exposure from 2004 to 2019
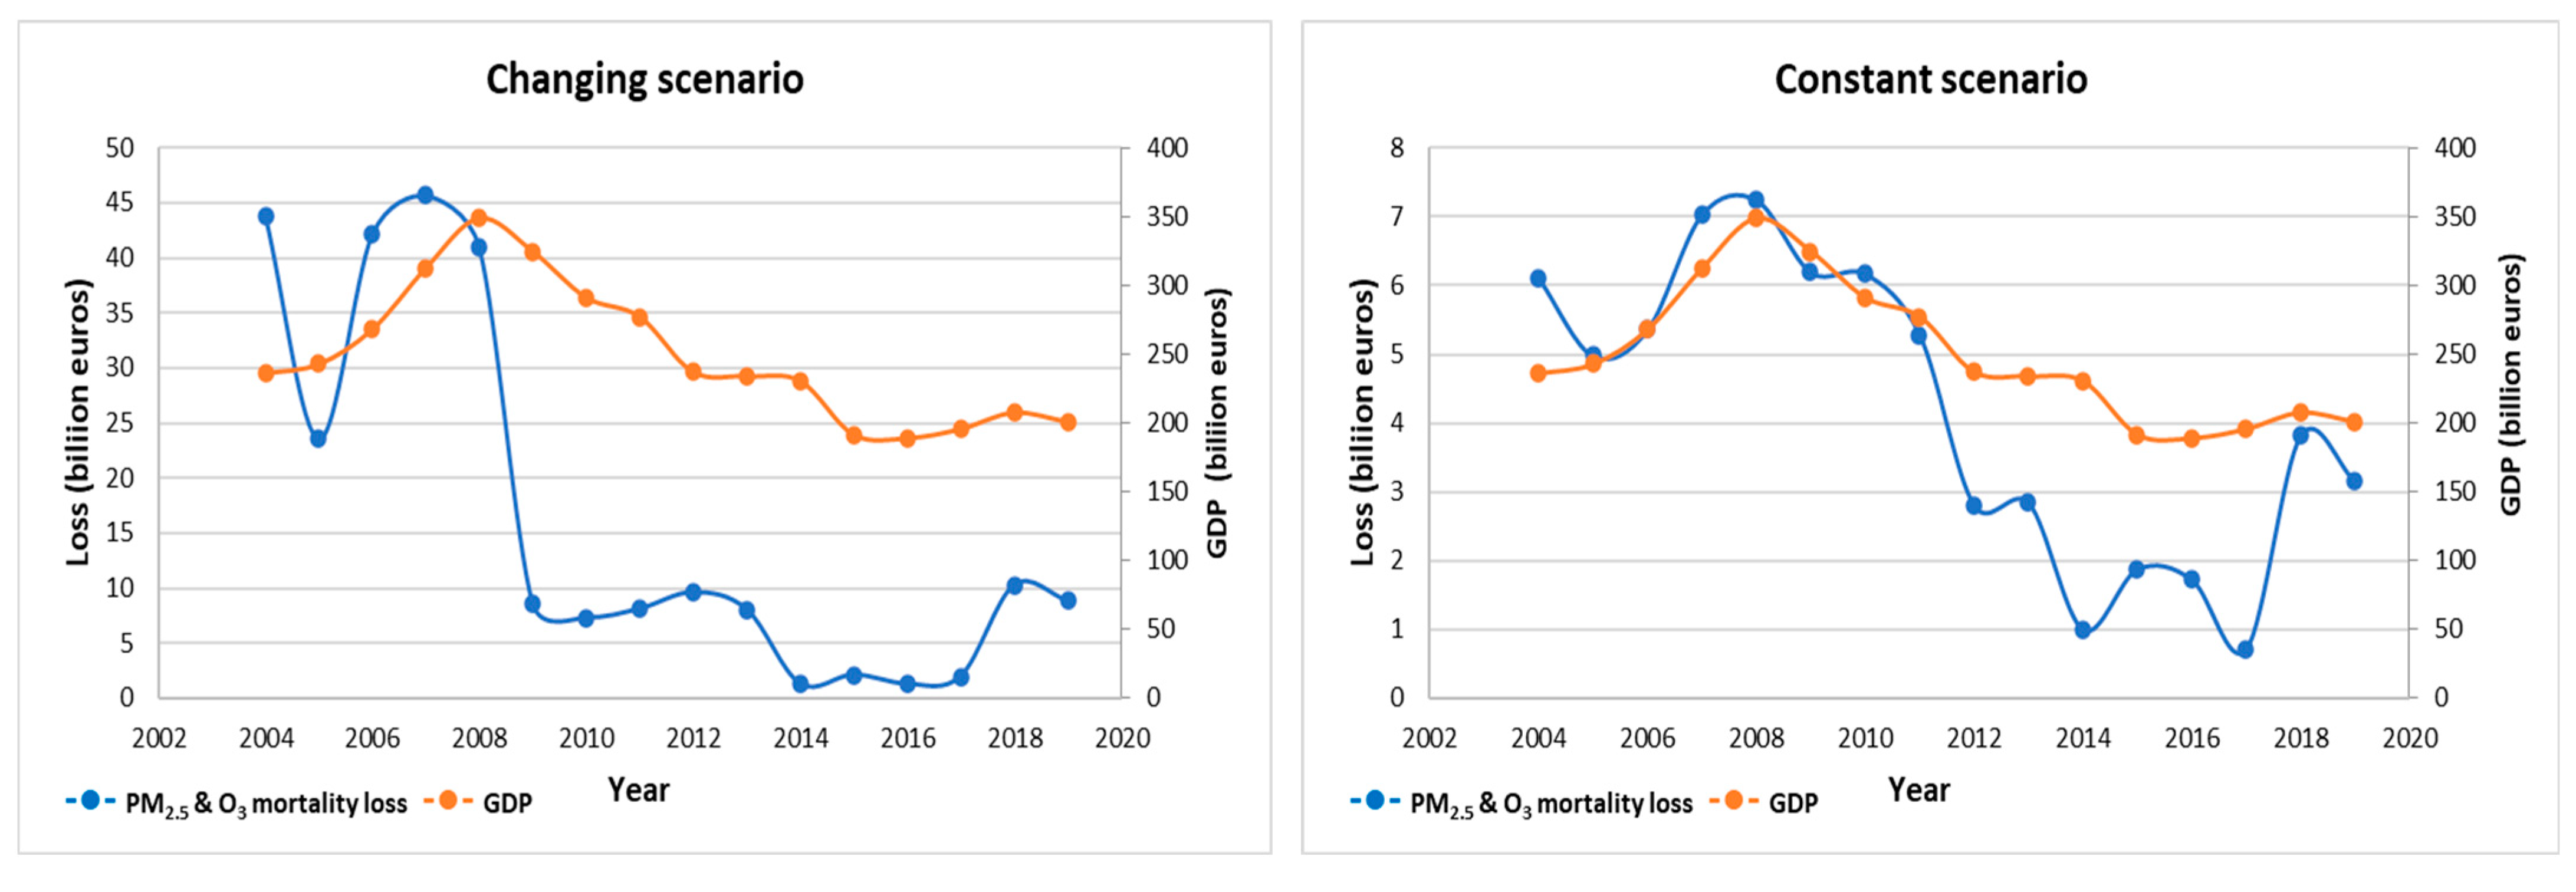
In the changing scenario, the cost resulting from mortality due to exposure to PM2.5 and O3 ranged between EUR 45.6 billion in 2007 and EUR 1.3 billion in 2014, or 14.5% and 0.56% of the national GDP, respectively (Figure 1). A dramatic decline was observed after 2008. Comparing the two pollutants, the contribution of PM2.5 to the total economic loss ranged 98.7–99.8%, while the relative figures for O3 were 0.09–1.2%. In the constant scenario, the costs were considerably lower. Specifically, the economic loss from premature mortality declined from EUR 6 billion in 2004 to EUR 3 billion in 2019, corresponding to 2.58% and 1.57% of the GDP, respectively (Figure 1). These results do not come as a surprise, as the annual changes in GDP and CI per region were not taken into account in this scenario. Nevertheless, the contribution of PM2.5 was dominant in both scenarios, compared to O3, which had a relatively negligible impact.
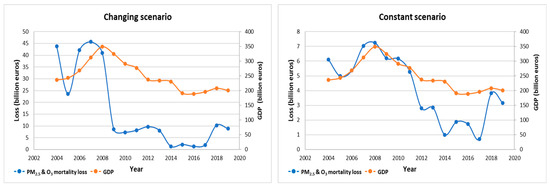
Figure 1.
Trends of the economic losses resulting from premature mortality due to PM2.5 and O3 exposure for the two scenarios examined.
3.3. Spatial Characteristics of the Economic Burden from Premature Mortality Attributed to PM2.5 and O3 Exposure
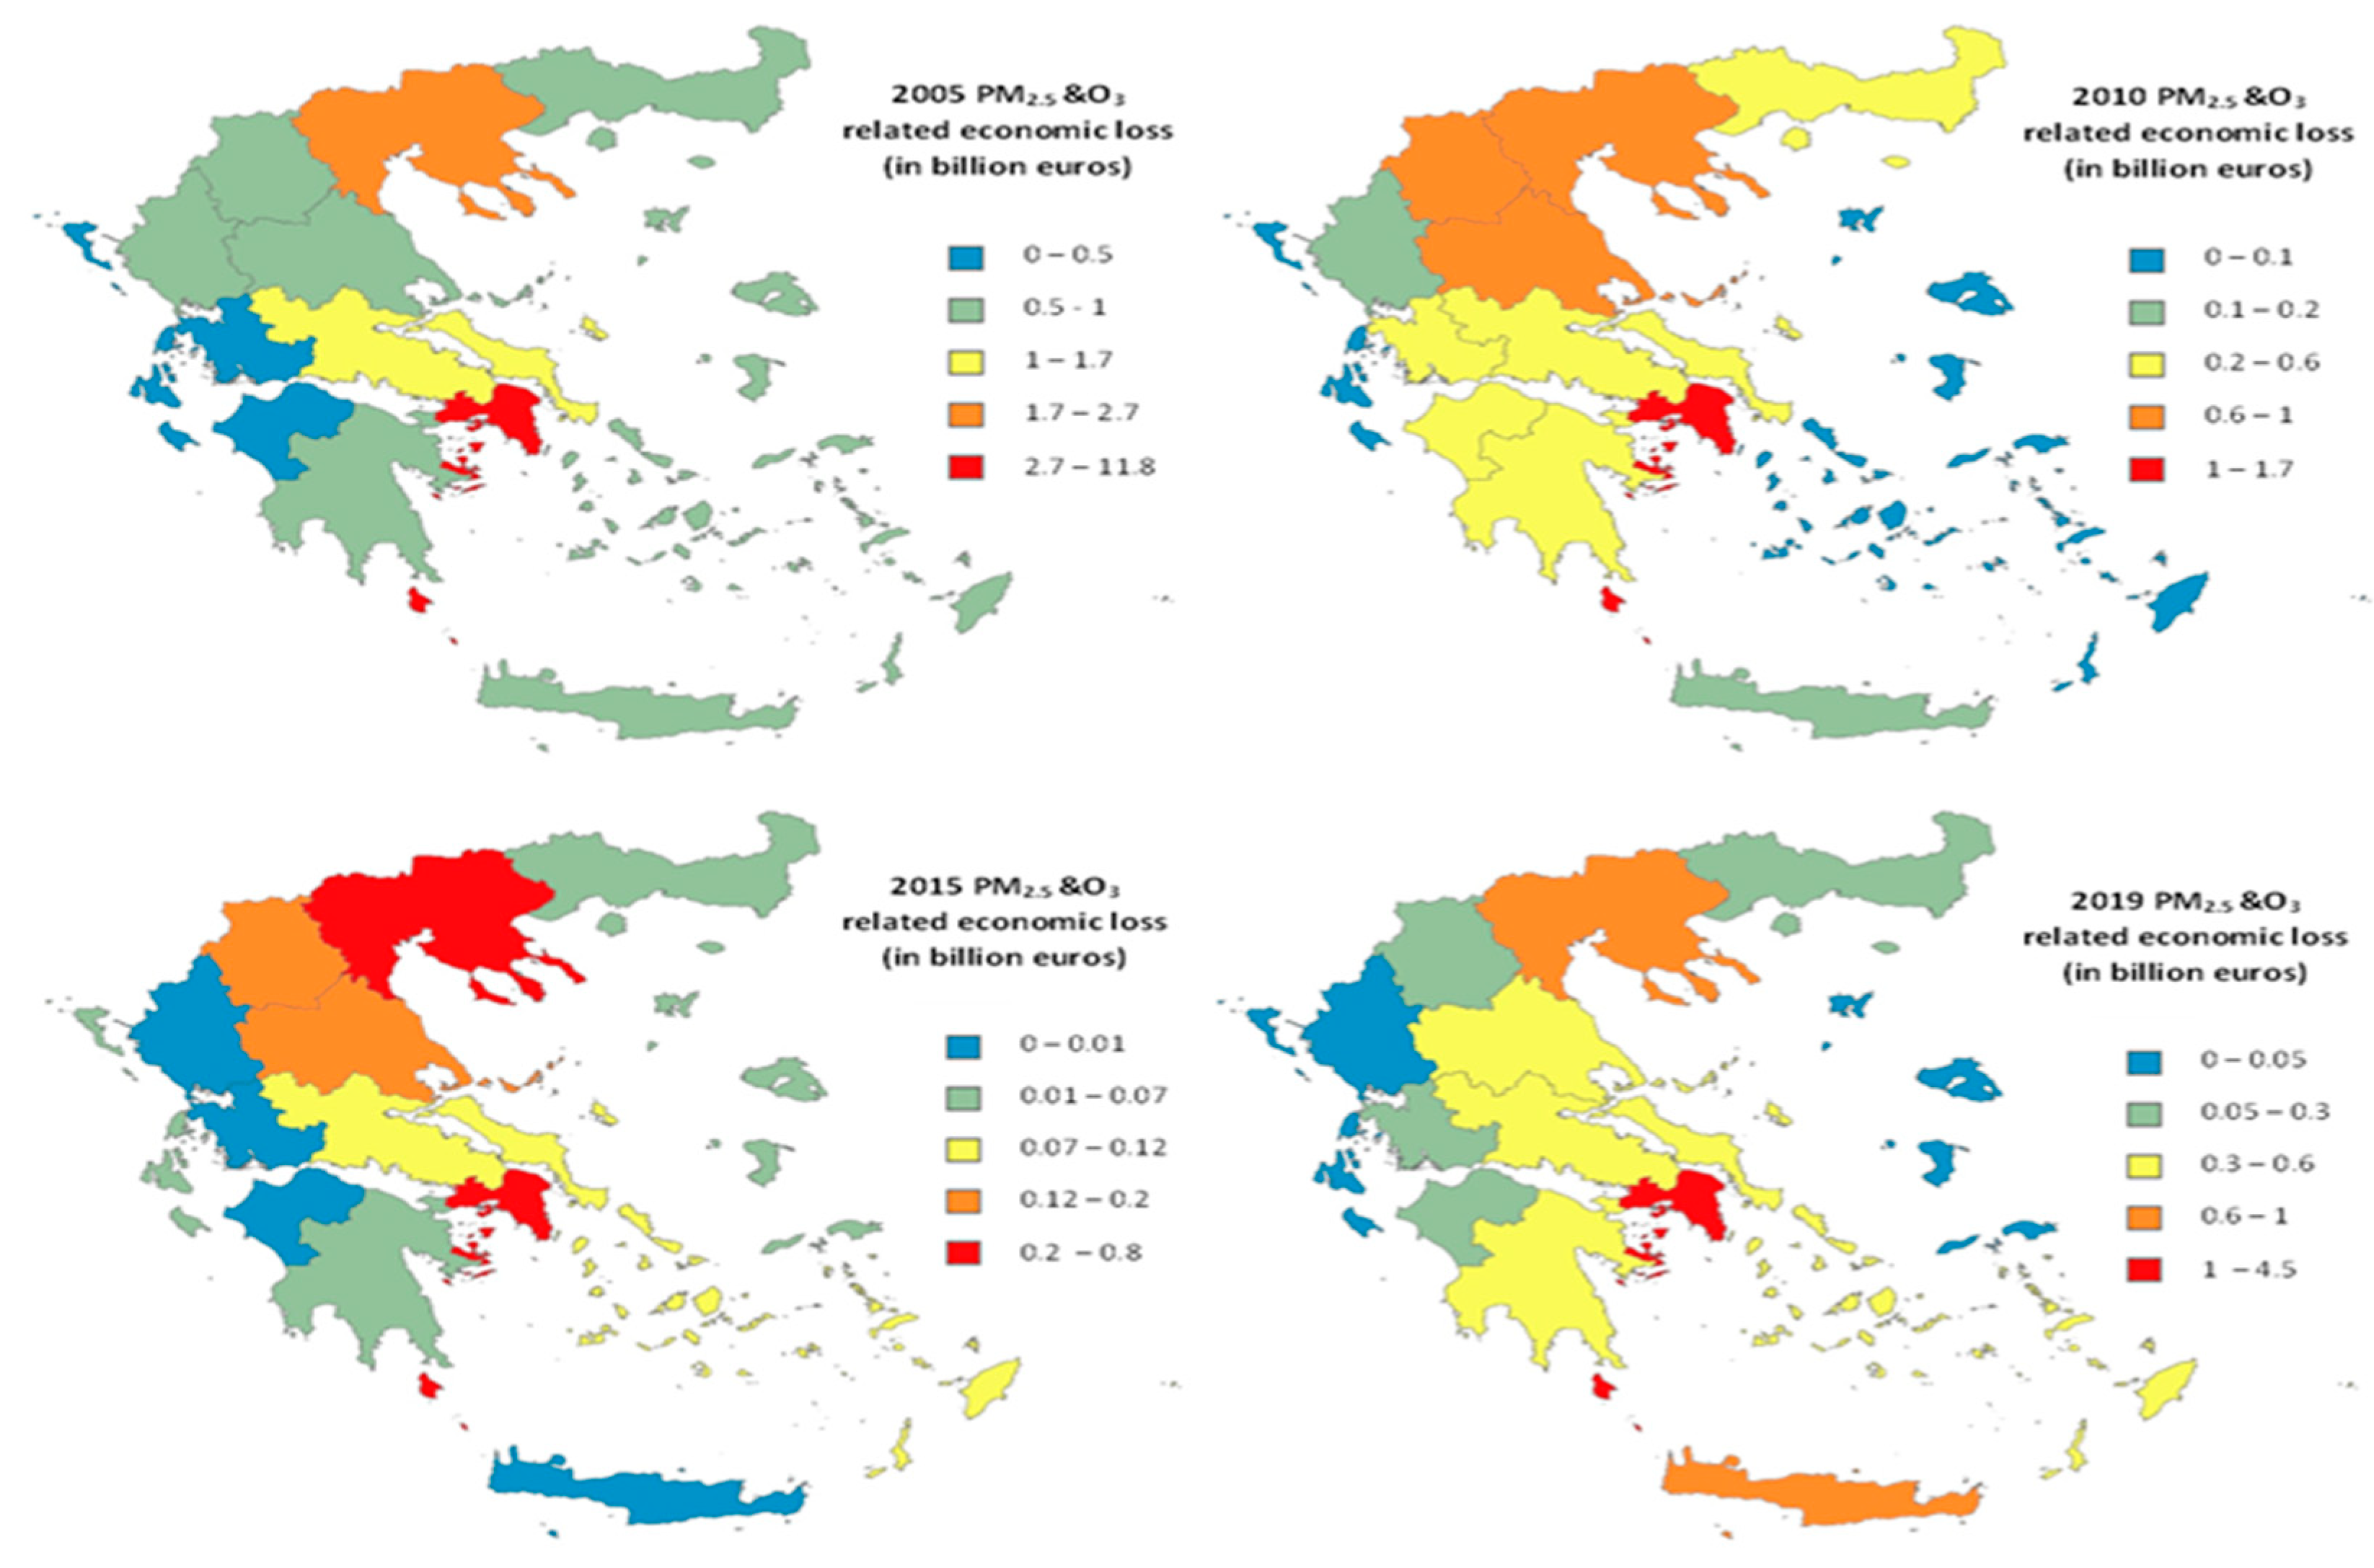
The spatial patterns of the economic burden resulting from premature mortality due to ambient PM2.5 and O3 exposure are illustrated in Figure 2 for the changing scenario. Specifically, four characteristic years (2005, 2010, 2015 and 2019), representing periods before and after the peak of the major Greek fiscal recession of 2009, are shown.

Figure 2.
Spatial patterns of the economic burden (EUR billion) resulting from premature mortality due to ambient PM2.5 and O3 exposure in 2005, 2010, 2015 and 2019 for the changing scenario.
In most cases, the highest values of economic loss were observed in regions with relatively high PM2.5/O3 concentrations. In addition, increased economic damage was generally observed in regions with high GDP per capita, such as Attica, which encompasses the entire metropolitan area of Athens, the country’s capital and largest city. On the other hand, lower economic losses were found in regions with relatively low GDP per capita, such as Epirus and the North Aegean. The lowest economic burden was found in the Ionian Islands and Western Greece (EUR 0–0.5 billion). From 2010 to 2015, the number of regions where the economic burden was estimated to be low (EUR 0–0.12 billion) increased, including Epirus, Crete, North/South Aegean, Eastern Macedonia and Thrace, Peloponnese and Central Greece. A slight increase in the economic burden (EUR 0.6–4.5 billion) was observed between 2015 and 2019, mainly in Attica, Central Macedonia and Crete. The lowest values of economic loss were found in Epirus, the Ionian Islands and the North Aegean in 2019.
4. Discussion
For the period 2004–2019, the total economic cost resulting from air pollution-related mortality was estimated at EUR 66.34 billion under the constant scenario and EUR 273.65 billion under the changing scenario. The difference between these results stemmed from the different assumptions adopted by each scenario, highlighting the strong impact of economic development and income on WTP. Remarkable was the dramatic decline in mortality costs from EUR 40.93 billion in 2008 to EUR 8.54 billion in 2009, when the major fiscal recession started. From 2008 to 2016, more than one fourth of the national GDP was lost, and the unemployment rate hit 30%, which was reflected in the low mortality costs during that period. Overall, the willingness of people to pay in order to reduce air pollution mortality appears to have followed the evolution of GDP, suggesting that air pollution mitigation could bring significant profits to countries with growing economies.
In respect of spatial analysis, the regional economic loss, expressed both in monetary value and in national GDP terms, followed the temporal trends of economic development, but interestingly, the regional GDP per capita was not always reflected in the magnitude of the economic burden. The latter was mainly driven by population size and PM2.5 concentrations. By far, the highest economic loss occurred in Attica, followed by Central Macedonia, accounting for 65.1% on average of the total annual national economic burden. As Attica and Central Macedonia host the capital (Athens) and the second-largest city (Thessaloniki) of Greece, respectively, they are the largest and most densely populated regions of the country, where almost 46% of the total population lives. Both regions were among the most polluted areas of the country, with a high PM2.5-related mortality burden. Regarding their economic growth, Attica featured the highest regional GDP per capita in the country, while Central Macedonia was ranked almost in the middle of the GDP ranking list. Previous studies (e.g., [15]) also associated high urbanization levels with poor air quality, mainly attributed to increased traffic volumes and industrial emissions, as well as with increased PM2.5-related health effects and economic losses.
On the other hand, the low economic burden in the North Aegean, Epirus and the Ionian Islands coincided with good air quality, a low mortality rate and a low population size. However, contrary to the North Aegean and Epirus, the Ionian Islands had a relatively high GDP per capita, suggesting that a high GDP does not always translate to increased economic loss. The latter might be due to the fact that the Greek economy is mainly based on the services sector, which contributes almost 68% to the national GDP. Therefore, high regional GDP does not necessarily coincide with increased PM2.5 levels.
5. Conclusions
This work was the first to assess temporally and spatially the monetary losses related to mortality caused by PM2.5 and O3 exposure in Greece. It was demonstrated that O3 had a rather negligible impact on mortality and economic burden compared to PM2.5. The annual change in economic losses was mainly driven by the annual changes in PM2.5 levels and the GDP per capita, suggesting that reducing particulate air pollution could result not only in improvements in public health but also in significant economic benefits. The spatial analysis revealed that, except for the concentrations of PM2.5, the population size highly affected the regional economic losses. On the other hand, the regional GDP per capita did not necessarily coincide with the magnitude of the economic burden, probably reflecting the high dependence of the Greek economy on the services sector (mainly tourism) rather than industrial production.
Author Contributions
Conceptualization, P.K.; methodology, I.P.; formal analysis, K.P. and I.P.; writing—original draft preparation, K.P. and I.P.; writing—review and editing, A.K.P.; supervision, A.K.P. All authors have read and agreed to the published version of the manuscript.
Funding
This research received no external funding.
Institutional Review Board Statement
Not applicable.
Informed Consent Statement
Not applicable.
Data Availability Statement
The authors do not have permission to share the data.
Acknowledgments
The authors are grateful to the Hellenic Statistical Service (ELSTAT) for providing the economic and mortality data.
Conflicts of Interest
The authors declare no conflict of interest.
References
- Manisalidis, I.; Stavropoulou, E.; Stavropoulos, A.; Bezirtzoglou, E. Environmental and health impacts of air pollution: A review. Front. Public Health 2020, 8, 14. [Google Scholar] [CrossRef] [PubMed]
- Christidis, T.; Erickson, A.C.; Pappin, A.J.; Crouse, D.L.; Pinault, L.L.; Weichenthal, S.A.; Brook, J.R.; van Donkelaar, A.; Hystad, P.; Martin, R.V.; et al. Low concentrations of fine particle air pollution and mortality in the Canadian Community Health Survey cohort. Environ. Health. 2019, 18, 84. [Google Scholar] [CrossRef] [PubMed]
- Orellano, P.; Reynoso, J.; Quaranta, N.; Bardach, A.; Ciapponi, A. Short-term exposure to particulate matter (PM10 and PM2.5), nitrogen dioxide (NO2), and ozone (O3) and all-cause and cause-specific mortality: Systematic review and meta-analysis. Environ. Int. 2020, 142, 105876. [Google Scholar] [CrossRef]
- WHO Global Air Quality Guidelines. Particulate Matter (PM2.5 and PM10), Ozone, Nitrogen Dioxide, Sulfur Dioxide and Carbon Monoxide; World Health Organization: Geneva, Switzerland, 2021. [Google Scholar]
- World Bank and Institute for Health Metrics and Evaluation. The Cost of Air Pollution: Strengthening the Economic Case for Action; World Bank: Washington, DC, USA, 2016. [Google Scholar]
- Sarigiannis, A.D.; Karakitsios, S.P.; Kermenidou, M.V. Health Impact and Monetary Cost of Exposure to Particulate Matter Emitted from Biomass Burning in Large Cities. Sci. Total Environ. 2015, 15, 319–330. [Google Scholar] [CrossRef] [PubMed]
- Panteli, M.; Delipalla, S. The Economic Cost of Ill Health Due to Air Pollution: Evidence from Greece. Int. J. Bus. Econ. Sci. Appl. Res. 2021, 98–113. [Google Scholar] [CrossRef]
- Inness, A.; Ades, M.; Agustí-Panareda, A.; Barré, J.; Benedictow, A.; Blechschmidt, A.M.; Dominguez, J.J.; Engelen, R.; Eskes, H.; Flemming, J.; et al. The CAMS reanalysis of atmospheric composition. Atmos. Chem. Phys. 2019, 19, 3515–3556. [Google Scholar] [CrossRef]
- Oliveri Conti, G.; Heibati, B.; Kloog, I.; Fiore, M.; Ferrante, M. A review of AirQ Models and their applications for forecasting the air pollution health outcomes. Environ. Sci. Pollut. Res. 2017, 24, 6426–6445. [Google Scholar] [CrossRef]
- WHO Regional Office for Europe, European Centre for Environment and Health. AirQ+: Software Tool for Health Risk Assessment of Air Pollution; WHO Regional Office for Europe: Bonn, Germany, 2019. [Google Scholar]
- Sweis, N.J. Revisiting the value of a statistical life: An international approach during COVID-19. Risk Manag. 2022, 24, 259–272. [Google Scholar] [CrossRef]
- Hammitt, J.K.; Robinson, L.A. The Income Elasticity of the Value per Statistical Life: Transferring Estimates between High- and Low-Income Populations. J. Benefit-Cost Anal. 2011, 2, 1–27. [Google Scholar] [CrossRef]
- Viscusi, W.; Masterman, C. Income Elasticities and Global Values of a Statistical Life. J. Benefit-Cost Anal. 2017, 8, 226–250. [Google Scholar] [CrossRef]
- Gilbert, R.O. Statistical Methods for Environmental Pollution Monitoring; Van Nostrand Reinhold: New York, NY, USA, 1987. [Google Scholar]
- Luo, G.; Zhang, L.; Hu, X.; Qiu, R. Quantifying public health benefits of PM2.5 reduction and spatial distribution analysis in China. Sci. Total Environ. 2020, 719, 137445. [Google Scholar] [CrossRef]
Disclaimer/Publisher’s Note: The statements, opinions and data contained in all publications are solely those of the individual author(s) and contributor(s) and not of MDPI and/or the editor(s). MDPI and/or the editor(s) disclaim responsibility for any injury to people or property resulting from any ideas, methods, instructions or products referred to in the content. |
© 2023 by the authors. Licensee MDPI, Basel, Switzerland. This article is an open access article distributed under the terms and conditions of the Creative Commons Attribution (CC BY) license (https://creativecommons.org/licenses/by/4.0/).