Proceeding Paper

The Evolution of the Seasonal Variation and the Summer Diurnal Variation of Primary and Secondary Photochemical Air Pollution in Athens †

1
Research Centre for Atmospheric Physics and Climatology, Academy of Athens, 10680 Athens, Greece
2
Biomedical Research Foundation, Academy of Athens, 11527 Athens, Greece
3
Navarino Environmental Observatory (N.E.O.), 24001 Messinia, Greece
4
Mariolopoulos-Kanaginis Foundation for the Environmental Sciences, 10675 Athens, Greece
*
Author to whom correspondence should be addressed.
Presented at the 16th International Conference on Meteorology, Climatology and Atmospheric Physics—COMECAP 2023, Athens, Greece, 25–29 September 2023.
Environ. Sci. Proc. 2023, 26(1), 122; https://doi.org/10.3390/environsciproc2023026122
Published: 29 August 2023

Abstract

:
The city of Athens has faced air pollution problems over the last few decades due to the high population density associated with an intense emission load constrained by the local topography causing poor ventilation. In addition, the high levels of solar irradiation, in combination with emissions of nitrogen oxides and hydrocarbons, have led to the formation of photochemical pollutants, especially ozone. In this study, the evolution of the seasonal variation of primary and secondary photochemical urban air pollution in Athens was examined for the 2001–2021 period. For this purpose, the monthly NOx (NO+NO2), ozone, and Ox (O3+NO2) averages for the Athens air pollution monitoring stations of Geoponiki, Liossia, Ag. Paraskevi, and Thrakomakedones in the selected periods of 2001–2004, 2010–2013, 2016–2019, and 2020–2021 were plotted. In addition, summer diurnal NOx, ozone, and Ox variations were examined. There was a clear reduction in NOx levels at all four examined stations, especially at the urban background site of Geoponiki, as well as at the most polluted peripheral site of Liossia, following a reduction in urban emissions, mainly from car traffic during the examined period. The ozone and Ox curves did not show the same patterns due to the complicated nature of local ozone photochemical production, in combination with the rural surface ozone background, which was particularly high over the area.

1. Introduction

Over the last few decades, the high air pollution levels in Athens, Greece, have become a priority issue for the authorities and have been the subject of many research studies. Scientists at the Research Centre for Atmospheric Physics and Climatology of the Academy of Athens actively participated in studies on urban photochemical pollution [1,2,3,4,5,6,7,8,9], regional rural surface ozone background [10,11,12,13], and vertical tropospheric ozone distribution [14,15,16,17,18,19,20].
In this study, the evolution of the interannual and seasonal variation of primary and secondary photochemical urban air pollution in Athens has been examined for the 2001–2021 period. For this purpose, the annual and monthly NOx (NO+NO2), ozone, and Ox (O3+NO2) averages for the urban background station of Geoponiki, as well as for the peripheral stations of Geoponiki, Liossia, Ag. Paraskevi, and Thrakomakedones, during the selected periods of 2001–2004, 2010–2013, 2016–2019, and 2020–2021 were plotted.

2. Results and Discussion

Figure 1 shows the average annual ozone and NOx concentrations at the stations of the Athens air pollution monitoring network, as approximately located at the NW-NE axis of the basin for the 2001–2021 period. The most polluted stations, specifically regarding primary pollution, were Patission (PAT), Athinas (ATH), and Peireas (PEI), while they showed the lowest ozone mean values. At the same time, the Ox concentrations were comparable at all stations, expectedly due to NO titration by ozone [7]. From the 11 presented stations, the peripheral stations of Liossia (LIO), Ag. Paraskevi (AGP), and Thrakomakedones (THR), as well as the urban background station of Geoponiki (GEO), were selected for further analysis.
In Figure 2, the evolution of annual NOx, O3, and Ox pollutant concentrations at the GEO, LIO, AGP, and THR stations of the Athens air pollution monitoring network is presented. There was a significant reduction in NOx concentrations at GEO and LIO stations during the 2001–2011 period (around 40–50%), while there was an increase in ozone concentrations at the same stations. For the AGP and THR stations, the NOx reductions and ozone increases were less significant. Finally, the annual Ox concentrations remained relatively stable throughout the examined period.
In Figure 3, seasonal variations in monthly average NOx concentrations at the stations of GEO, LIO, AGP, and THR during the periods of 2001–2004, 2010–2013, 2016–2019, and and 2020–2021, as well as the corresponding NO2 concentrations for the same time periods, are presented. Significant reductions in primary NOx pollution were observed at the urban background station of GEO, as well as at the peripheral station of LIO, located to the north of the basin, especially during the autumn and winter months and between the periods 2001–2004 and 2010–2013. During the summer months, the reductions were less significant, especially during the more recent periods, although an extra reduction was observed during the pandemic period (2020–2021) relatively to the previous period (2016–2019) during both autumn and winter months. Similar NO2 variations between the examined periods were observed, showing a smoother seasonal variation in summer.
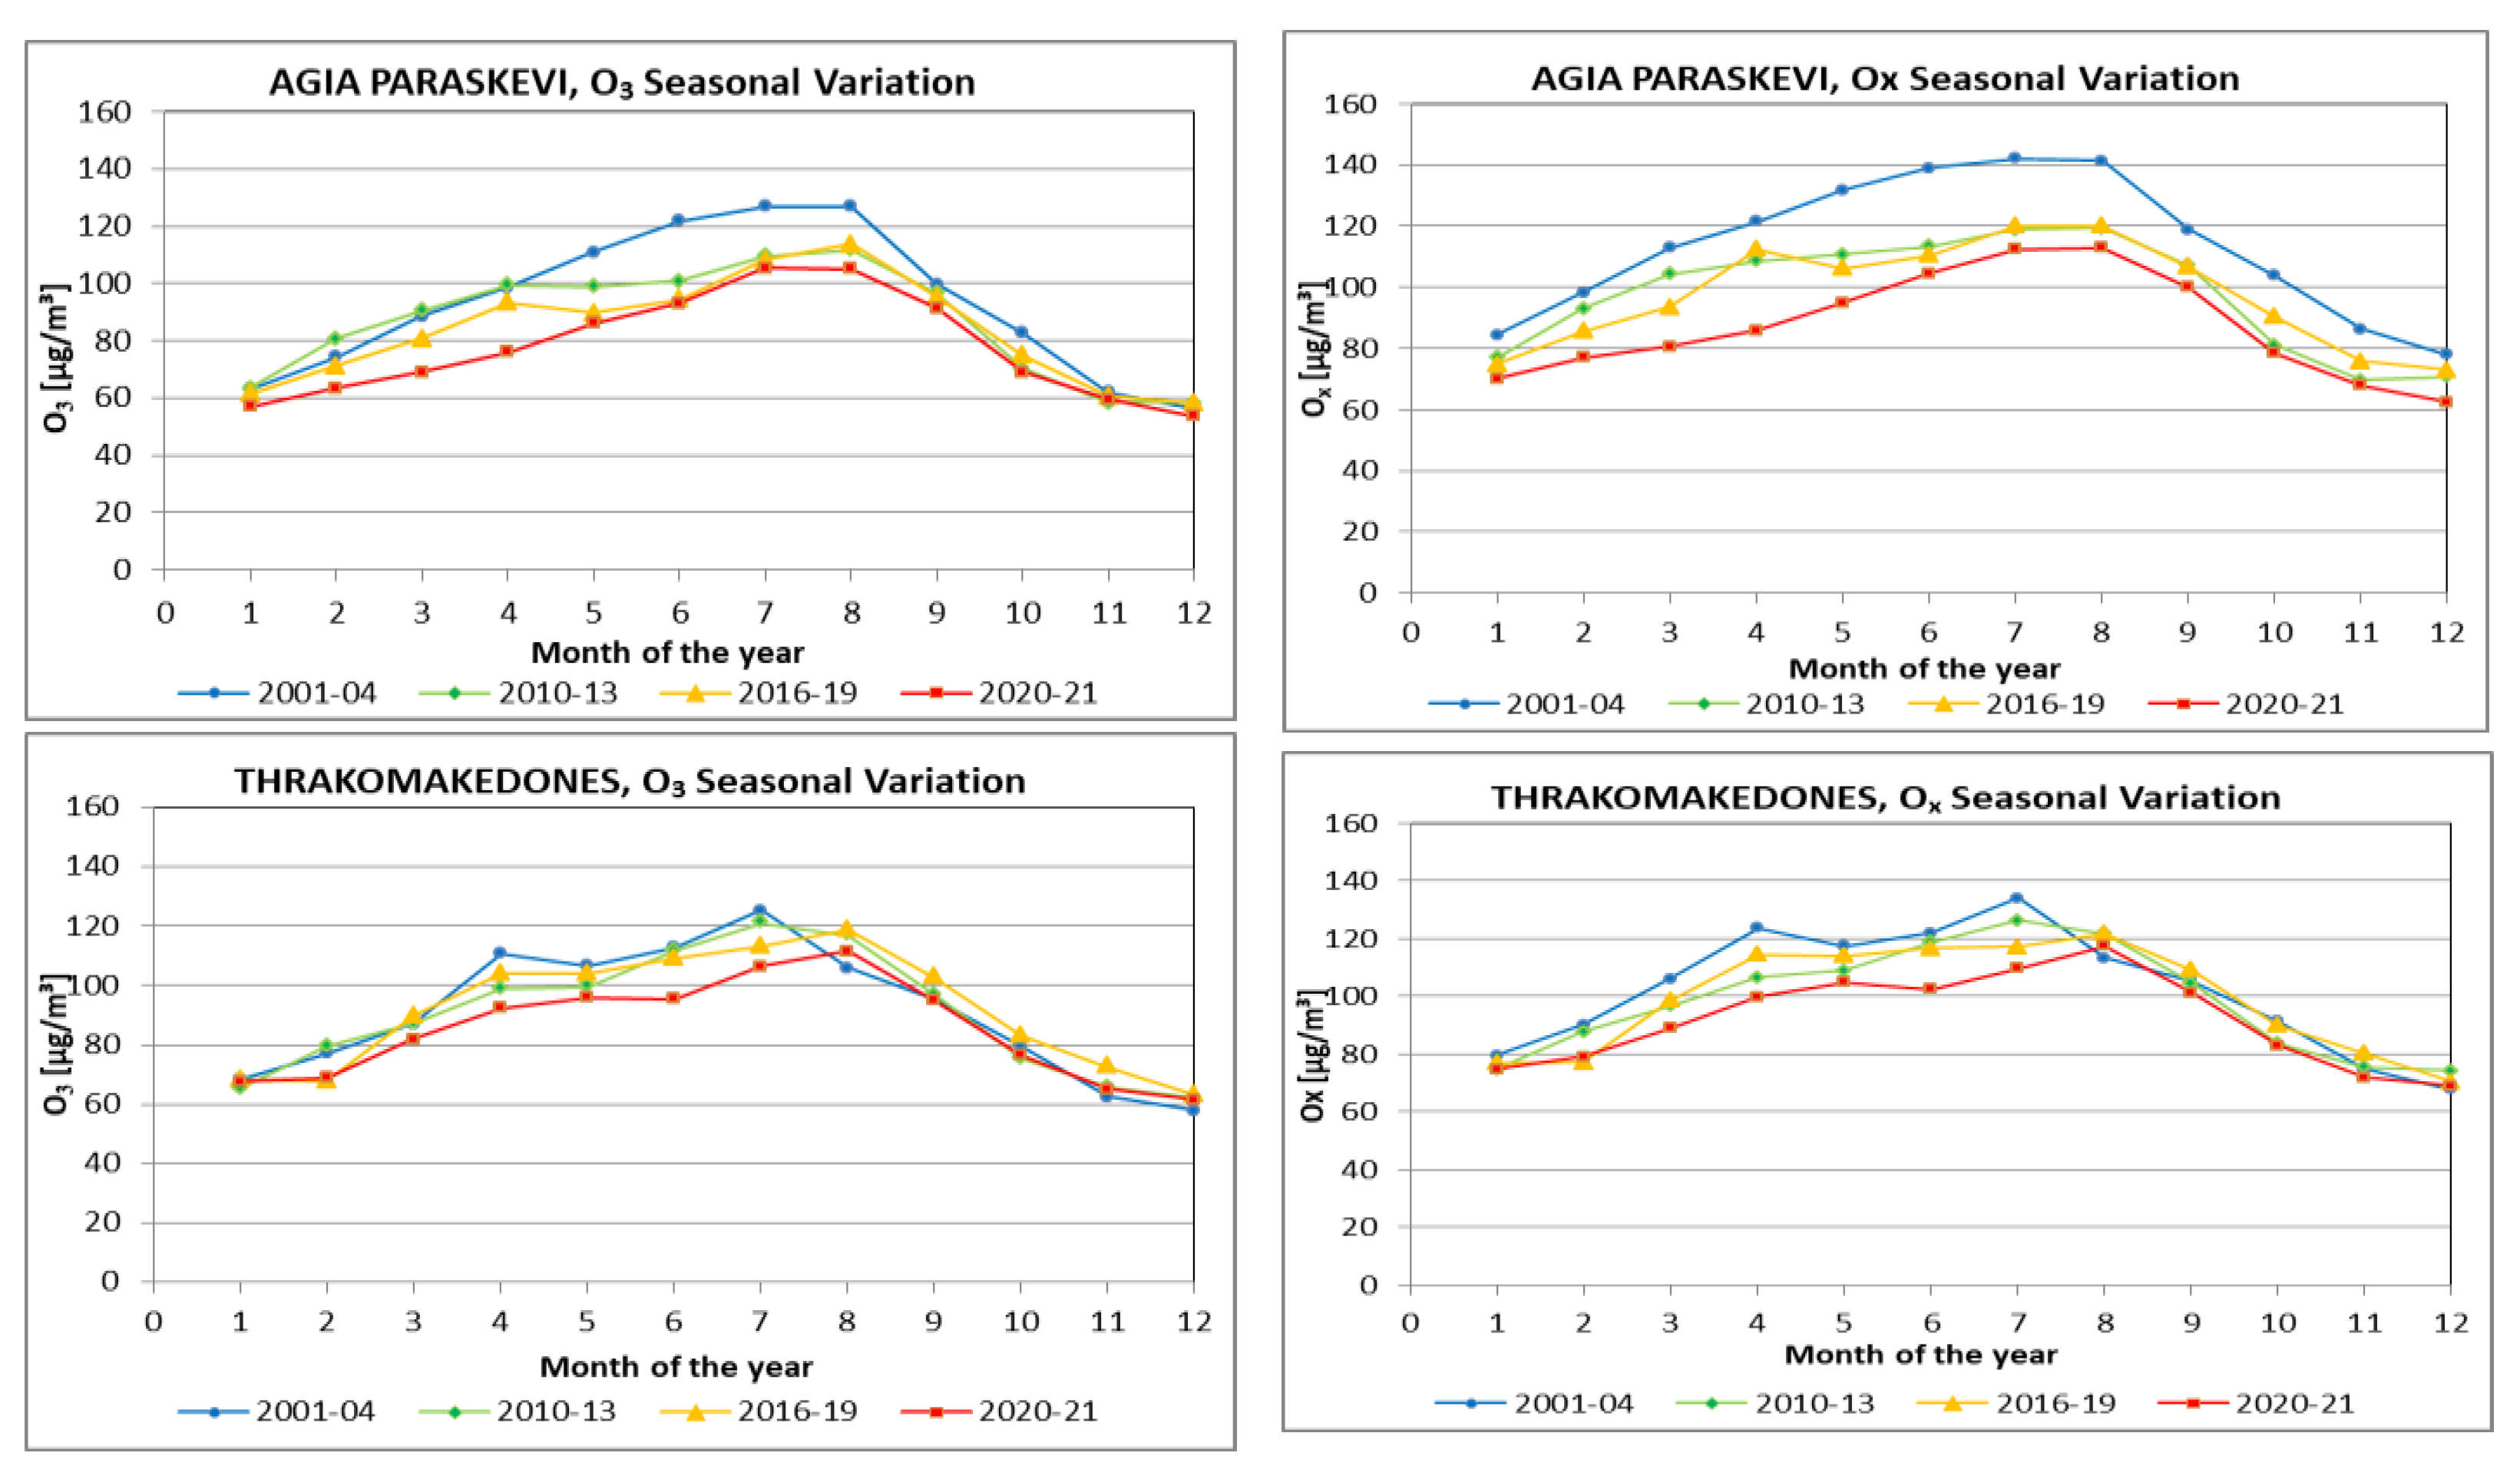
In Figure 4, seasonal variations in monthly average ozone concentrations at the stations of GEO, LIO, AGP, and THR during the periods of 2001–2004, 2010–2013, 2016–2019, and 2020–2021, as well as the corresponding Ox variations for the same time periods, are presented. Significant ozone and Ox reductions were observed at the AGP and THR stations, while at the LIO station, Ox shows the same pattern. On the contrary, significant ozone increases were observed at the GEO station.

3. Conclusions

Substantial reductions in NOx pollution levels (about 50%) occurred at the stations of GEO and LIO during the last two decades and weaker reductions in the stations of AGP and THR, which were even enhanced during the pandemic period, especially during the autumn and winter months. Consequently, ozone levels increased at GEO and LIO stations due to the reduced NO titration effect. On the other hand, at the peripheral stations of AGP and THR, ozone average levels showed a clear decrease, especially during the spring and summer months, indicating a corresponding decrease in regional ozone background levels. Nevertheless, there were still exceedances of air quality standards in some stations of the Athens air quality monitoring network, specifically regarding the photochemical NO2 and ozone pollutants.

Author Contributions

Conceptualization, P.K.; methodology, P.K. and T.S.; software, T.S. and J.K.; data curation, T.S. and J.K.; formal analysis, P.K.; writing, P.K. and A.P.; review, P.K., T.S., J.K., A.P. and C.Z. All authors have read and agreed to the published version of the manuscript.

Funding

The authors would like to acknowledge the support of the EU project, titled “Copernicus Atmosphere Monitoring Service CAMS2_82: Evaluation and quality control (EQA) of Global products”.

Institutional Review Board Statement

Not applicable.

Informed Consent Statement

Not applicable.

Data Availability Statement

Not applicable.

Conflicts of Interest

The authors declare no conflict of interest.

References

  1. Mantis, H.T.; Repapis, C.C.; Zerefos, C.; Ziomas, I. Assessment of the potential for photochemical air pollution in Athens: A comparison of emissions and air-pollutant levels in Athens with those in Los Angeles. J. Appl. Meteor. 1992, 31, 1467–1476. [Google Scholar] [CrossRef]
  2. Ziomas, I.; Suppan, P.; Rappengluck, B.; Balis, D.; Tzoumaka, P.; Melas, D.; Papayannis, A.; Fabian, P.; Zerefos, C. A contribution to the study of the photochemical smog in the greater Athens area. Beit. Phys. Atmos. 1995, 68, 191–203. [Google Scholar]
  3. Rappenglück, B.; Fabian, P.; Kalabokas, P.; Viras, L.G.; Ziomas, I.C. Quasi-continuous measurements of non-methane hydrocarbons (NMHC) in the greater Athens area during MEDCAPHOT-TRACE. Atmos. Environ. 1998, 32, 2103–2121. [Google Scholar] [CrossRef]
  4. Ziomas, I.C. The mediterranean campaign of photochemical tracers-transport and chemical evolution (MEDCAPHOT-TRACE): An outline. Atmos. Environ. 1998, 32, 2045–2054. [Google Scholar] [CrossRef]
  5. Kalabokas, P.D.; Viras, L.G.; Repapis, C.C.; Bartzis, J.G. Analysis of the 11-year record (1987–1997) of air pollution measurements in Athens; Greece. Part II: Photochemical pollutants. Glob. Nest Int. J. 1999, 1, 169–176. [Google Scholar]
  6. Kalabokas, P.D.; Viras, L.G.; Repapis, C.C. Analysis of the 11-year record (1987–1997) of air pollution measurements in Athens; Greece. Part I: Primary air pollutants. Glob. Nest Int. J. 1999, 1, 157–168. [Google Scholar]
  7. Kalabokas, P.D.; Viras, L.G.; Bartzis, J.G.; Repapis, C.C. Mediterranean rural ozone characteristics around the urban area of Athens. Atmos. Environ. 2000, 34, 5199–5208. [Google Scholar] [CrossRef]
  8. Kalabokas, P.D.; Repapis, C.C. A climatological study of rural surface ozone in central Greece. Atmos. Chem. Phys. 2004, 4, 1139–1147. [Google Scholar] [CrossRef]
  9. Kalabokas, P.; Repapis, C.C.; Mantis, H. A field study on the origins of surface ozone at the periphery of the urban area of Athens. Fresenius Environ. Bull. 2006, 8, 878–882. [Google Scholar]
  10. Zerefos, C.S.; Kourtidis, K.A.; Melas, D.; Balis, D.; Zanis, P.; Katsaros, L.; Mantis, H.T.; Repapis, C.; Isaksen, I.; Calpini, B.; et al. Photo-chemical Activity and Solar Ultraviolet Radiation (PAUR) Modulation factors: An overview of the project. J. Geophys. Res. 2002, 107, 8134. [Google Scholar] [CrossRef]
  11. Kourtidis, K.; Zerefos, C.; Rapsomanikis, S.; Simeonov, V.; Balis, D.; Perros, P.E.; Thompson, A.M.; Witte, J.; Calpini, B.; Sharobiem, W.M.; et al. Regional levels of ozone in the troposphere over Eastern Mediterranean. J. Geophys. Res. 2002, 107, 8140. [Google Scholar] [CrossRef]
  12. Kalabokas, P.D.; Mihalopoulos, N.; Ellul, R.; Kleanthous, S.; Repapis, C.C. An investigation of the meteorological and photochemical factors influencing the background rural and marine surface ozone levels in the Central and Eastern Mediterranean. Atmos. Environ. 2008, 42, 7894–7906. [Google Scholar] [CrossRef]
  13. Poupkou, A.; Melas, D.; Ziomas, I.C.; Symeonidis, P.; Lisaridis, I.; Gerasopoulos, E.; Zerefos, C. Simulated summertime regional ground-level ozone concentrations over Greece. Water Air Soil. Pollut. 2009, 196, 169–181. [Google Scholar] [CrossRef]
  14. Mariolopoulos, E.; Zerefos, C.S.; Bloutsos, A.; Repapis, C. Ozone and temperature balloon measurements during the annular solar eclipse of 29 April 1976. Proc. Acad. Athens 1977, 51, 636–645. [Google Scholar]
  15. Varotsos, C.; Kalabokas, P.; Chronopoulos, G. Atmospheric ozone concentration at Athens, Greece. Part II: Vertical ozone distribution in the troposphere. Atmos. Res. 1993, 30, 151–155. [Google Scholar] [CrossRef]
  16. Kalabokas, P.D.; Chronopoulos, G.; Varotsos, C.; Zerefos, C.; Repapis, C.C. Vertical tropospheric ozone characteristics over Athens, Greece. In Proceedings of the XX Quadrennial Ozone Symposium, Kos, Greece, 1–8 June 2004; pp. 191–192. [Google Scholar]
  17. Papayannis, A.; Balis, D.; Zanis, P.; Galani, E.; Wernli, H.; Zerefos, C.; Stohl, A.; Eckhardt, S.; Amiridis, V. Sampling of an STT event over the Eastern Mediterranean region by lidar and electrochemical sonde. Ann. Geophys. 2005, 23, 2039–2050. [Google Scholar] [CrossRef]
  18. Kalabokas, P.D.; Volz-Thomas, A.; Brioude, J.; Thouret, V.; Cammas, J.P.; Repapis, C.C. Vertical ozone measurements in the troposphere over the Eastern Mediterranean and comparison with Central Europe. Atmos. Chem. Phys. 2007, 7, 3783–3790. [Google Scholar] [CrossRef]
  19. Kalabokas, P.D.; Papayannis, A.D.; Tsaknakis, G.; Ziomas, I. Study on the atmospheric concentrations of primary and secondary air pollutants in the Athens basin performed by DOAS and DIAL measuring techniques. Sci. Total Environ. 2012, 414, 556–563. [Google Scholar] [CrossRef]
  20. Kalabokas, P.D.; Cammas, J.-P.; Thouret, V.; Volz-Thomas, A.; Boulanger, D.; Repapis, C.C. Examination of the atmospheric conditions associated with high and low summer ozone levels in the lower troposphere over the eastern Mediterranean. Atmos. Chem. Phys. 2013, 13, 10339–10352. [Google Scholar] [CrossRef]
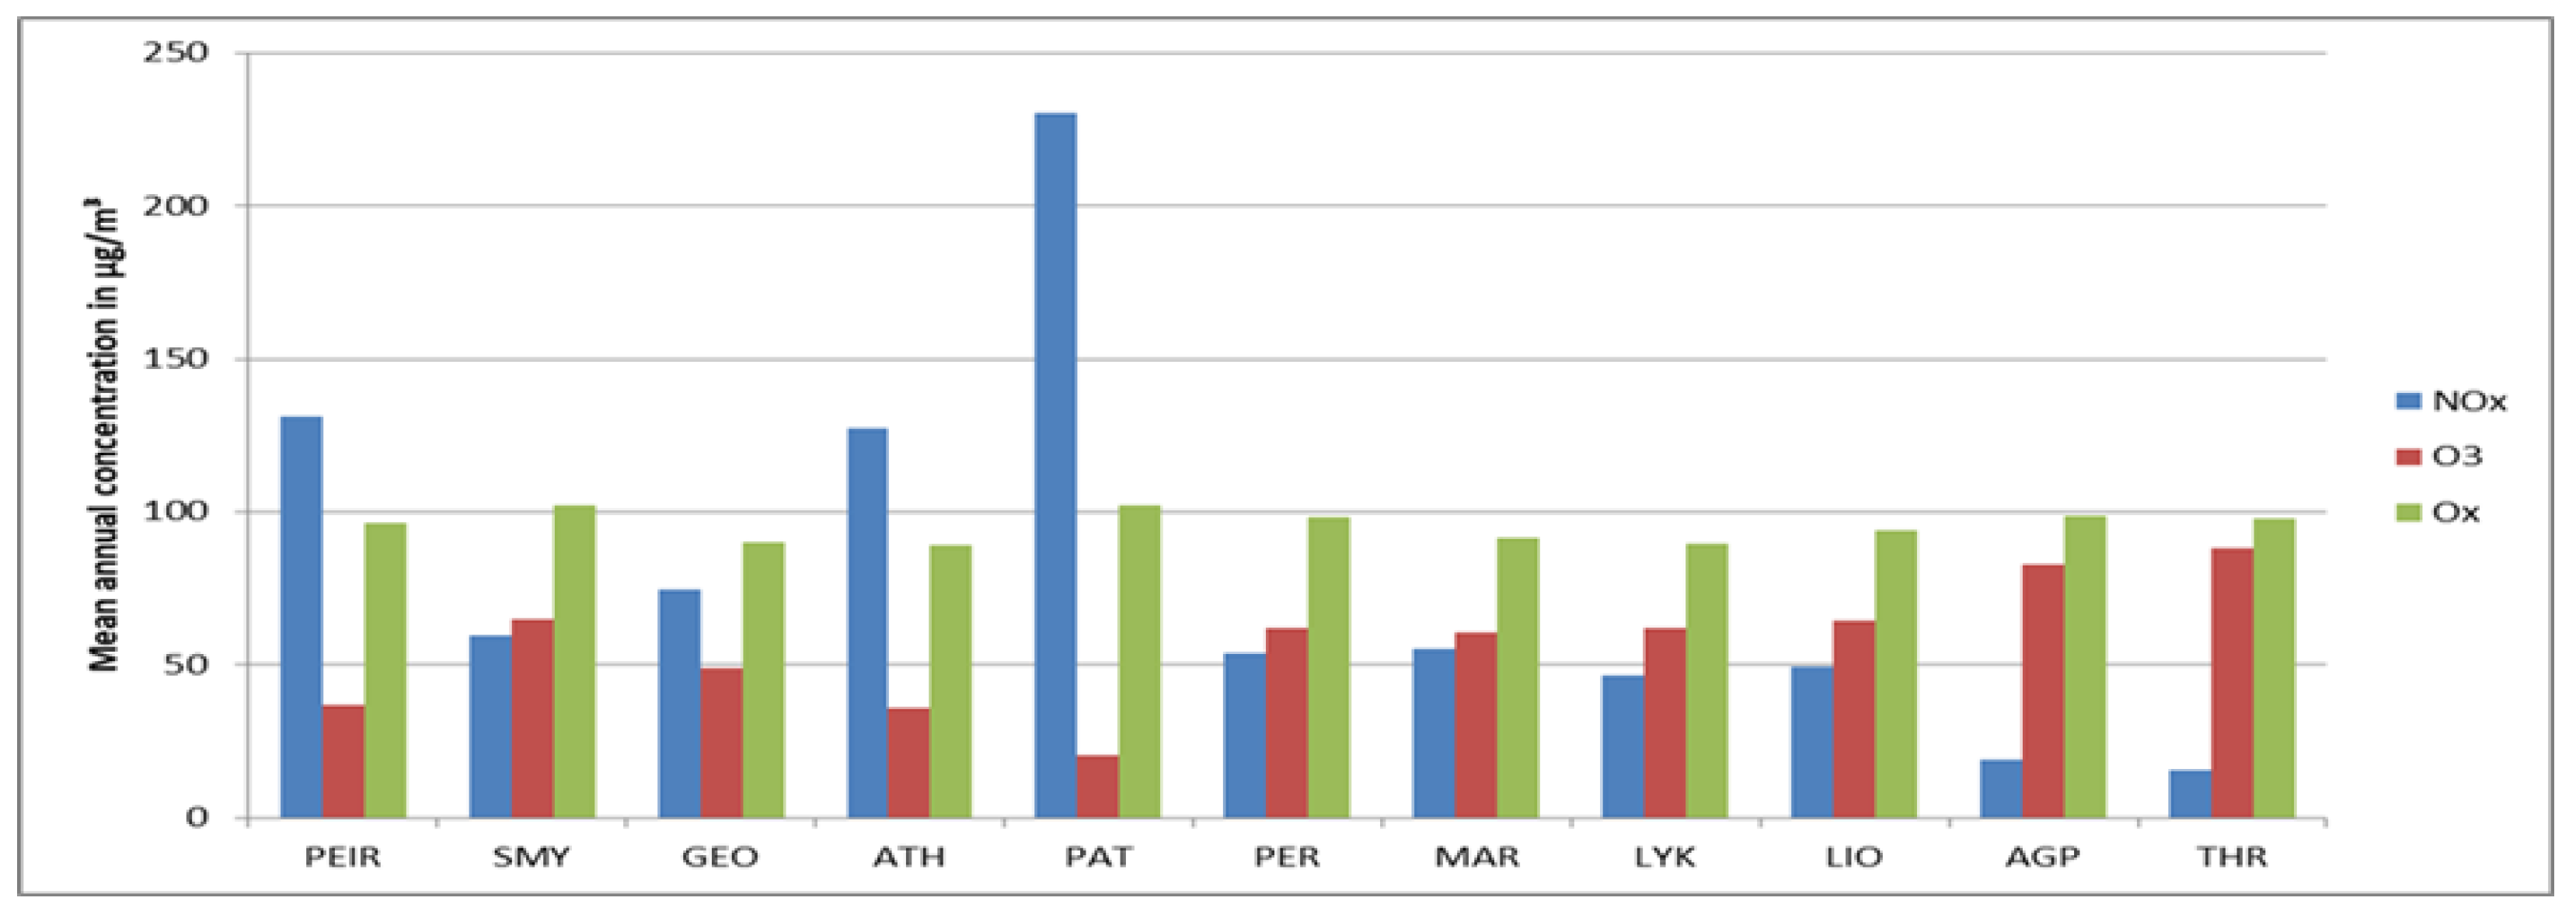
Figure 1. Average annual ozone and NOx concentrations at Athens air pollution monitoring network stations, as approximately located at the NW-NE axis of the basin for the 2001–2021 period.
Environsciproc 26 00122 g001
Figure 2. Evolution of annual pollutant concentrations at the GEO, LIO, AGP, and THR stations of the Athens air pollution monitoring network: NOx (upper panel), O3 (middle panel), and Ox (lower panel).
Environsciproc 26 00122 g002
Figure 3. Seasonal variations in monthly NOx (left column) and NO2 (right column) averages at GEO, LIO, AGP, and THR for 2001–2004, 2010–2013, 2016–2019, and 2020–2021.
Environsciproc 26 00122 g003aEnvironsciproc 26 00122 g003b
Figure 4. Seasonal variations in monthly O3 (left column) and Ox (right column) averages at GEO, LIO, AGP, and THR for 2001–2004, 2010–2013, 2016–2019, and 2020–2021.
Environsciproc 26 00122 g004aEnvironsciproc 26 00122 g004b
Disclaimer/Publisher’s Note: The statements, opinions and data contained in all publications are solely those of the individual author(s) and contributor(s) and not of MDPI and/or the editor(s). MDPI and/or the editor(s) disclaim responsibility for any injury to people or property resulting from any ideas, methods, instructions or products referred to in the content.