Proceeding Paper

Advance Ensemble Flood Warning System: A Case Study for Nullah Lai †

by
Muhammad Aamir Siddiqui
1,
Mudasser Muneer Khan
1,
Rabia Khan
2 and
Syyed Adnan Raheel Shah
3,*
1
Department of Civil Engineering, Bahauddin Zakariya University, Multan 66000, Pakistan
2
Department of Agriculture, Forest and Range Management, Bahauddin Zakariya University, Multan 66000, Pakistan
3
Department of Civil Engineering, NFC-Institute of Engineering & Technology, Multan 66000, Pakistan
*
Author to whom correspondence should be addressed.
Presented at the 7th International Electronic Conference on Water Sciences, 15–30 March 2023; Available online: https://ecws-7.sciforum.net.
Environ. Sci. Proc. 2023, 25(1), 96; https://doi.org/10.3390/ECWS-7-14197
Published: 14 March 2023
(This article belongs to the Proceedings of The 7th International Electronic Conference on Water Sciences)

Abstract

:
River flow forecasting is an essential tool to manage floods in the current era, especially for flash flooding scenarios in urban areas. This study focuses the flash flooding scenario in the Nullah Lai basin, which comprises the twin cities Islamabad and Rawalpindi. Steep slopes in the Margalla hills and Islamabad create high numbers of flash floods in the lower reaches of Rawalpindi, which are densely populated. When high-intensity rainfall occurs in the steep slopes of Margalla and Islamabad, high-volume floods with high velocity pour down, which instantaneously reaches the less-sloped Rawalpindi regions, which causes the raising of the water level in the stream, and flooding occurs. The section of the Nullah Lai Rawalpindi starting from the Qatarian bridge to the Gawalmandi bridge has always faced flash flooding over time. In the period of few hours, the water level reaches several fts in the nullah, which is why it is not possible to alert the people living on the banks in a timely manner, a problem that illuminates the need for a forecasting system at Nullah Lai. In the current research, the China Metrological Agency forecast center (CMA)’s ensemble forecast data have been utilized to achieve forecasts in the Nullah Lai. For this purpose, two initial objectives were set to achieve which basic needs are required process the data available in grib format from data centers. A digital model of the Nullah Lai was made using hydrology tools available in ArcGIS 10.3. A digital equation was obtained from gene expression modeling (GEP), which was later used to generate the ensemble stage forecast against the ensemble rainfall forecast. The results obtained show that the flash flooding phenomenon in Nullah Lai can, with some uncertainty, be predicted well in time. Using 3-days-ahead forecast data from CMA, the same floods were predicted 3 days before the event. This research also provides the procedure to use the ensemble forecast data in developing an automated model to generate the ensemble stage forecast for coming events. This study will help the administrative authorities better manage the upcoming floods and save lives and capital costs lost in the flash flooding phenomena which continuously happen in the basin of the Nullah Lai.

1. Introduction

The development and implementation of policies and procedures related to water management and transportation are influenced by climate forecasts. These forecasts can help decision-makers in various areas, such as farming, urban flooding, and transportation. In addition to helping manage the flow of water, they can also help disaster administration and supervisors keep track of the allocation of water to diverse users [1]. The occurrence of flash flooding is a major concern for scientists in normal risks and hydrologic studies due to its top-positioning in various categories of disasters [2]. In the event of a flash flood, people should anticipate the coming surges and prepare for the secure passage of the water flow. This is carried out through the process of de-terminating the stream flow. It is additionally essential for monitoring the water supplies for various purposes, such as the water system, route, mechanical and hydroelectric utilization, and natural watering [3]. The use of climate models is currently scheduled for various global forecasting centers. These models are utilized for the prediction of atmospheric and climate conditions [4]. The NWP system uses the laws of thermodynamics and material science to predict the long-term state of the climate by taking into account the various factors that affect its development. The EPS system is a collection of expectations that are generated by the model. These expectations are then used to generate forecasts [5,6,7,8,9]. A collection of realizations known as individuals’ members in an ensemble forecast is composed of various arrangements of similar parameter types. One of the most common realizations is the control estimate, which is based on the best available conditions in the atmosphere. This allows for a more reasonable depiction of the demonstration. An ensemble framework is a representation of the vulnerability of the forecast [10].
The TIGGE (THORPEX Interactive Grand Global Ensemble) network [11,12] was established in 2005 to create strategies that combine different weather-forecasting frameworks. Through its data accumulation centers, the public can access worldwide weather forecasts that are issued by various weather-forecasting organizations. The different frameworks utilized by different forecasting centers vary in their approach to forecasting. For instance, the Nullah Lai center is located in the twin cities of Islamabad and Rawalpindi. This region has been featured in hydrological modeling before [13]. During the monsoon season, heavy rainfalls can cause flash flooding in low-lying areas of the city of Rawalpindi. It is very difficult to remove the people from these areas due to the growing urban population. The penalty for forecasting high-climate events is based on their ability to predict such situations. Despite the increasing number of end users for weather forecasts, the majority of them are not focused on forecasting the exact weather conditions for the upcoming season [14].
This study was conducted to find out what kind of work needs to be conducted to improve the prediction capabilities for the Nullah Lai. There is currently no system that can precisely forecast the likelihood of a certain event happening. This study aims to provide a comprehensive analysis of the various aspects of the river’s flow and its development.

2. Procedural Background
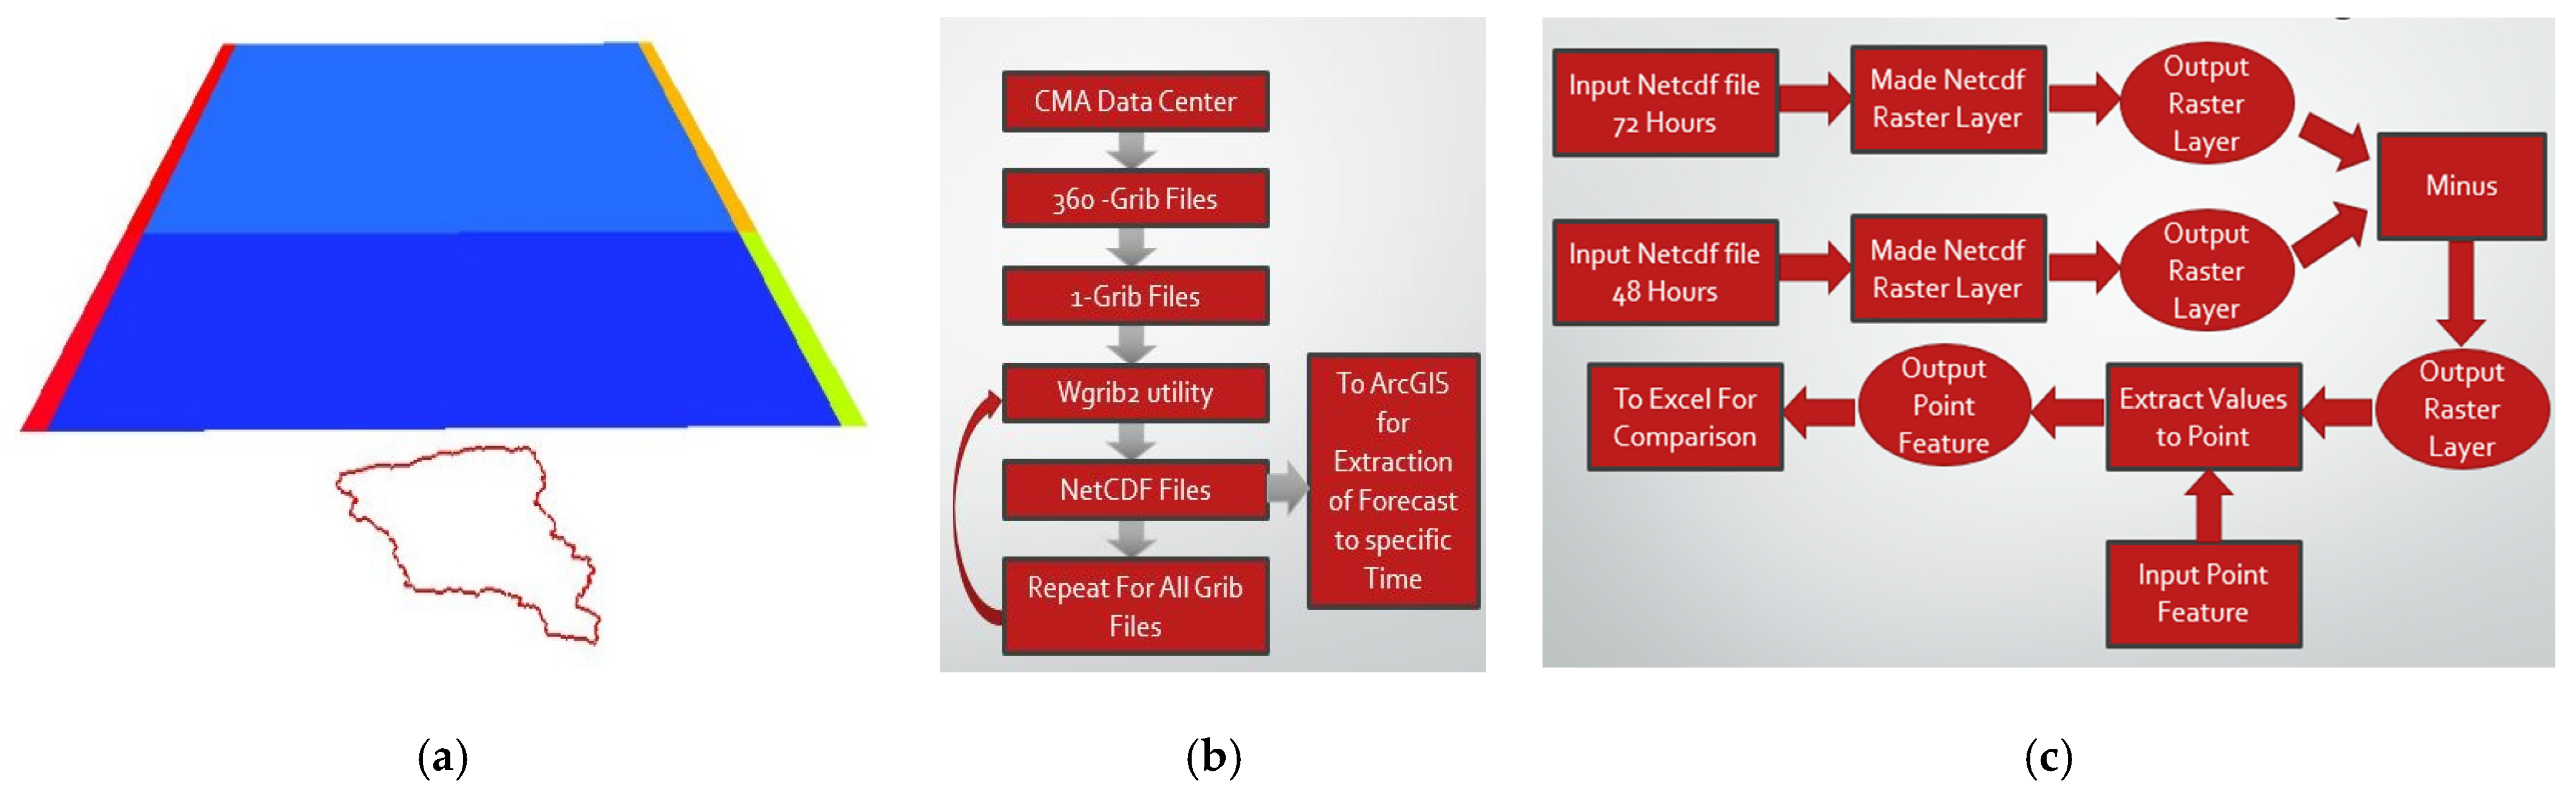
The research was based on statistical and digital modeling of the Nullah Lai, which was then utilized in the process of ensemble prediction. The first step for the modeling was to gather data from different data providers. The research was conducted using large datasets to establish a relationship between the rainfall and the stage of the Nullah Lai in the first phase. In the second phase, the data collected from different stations were linked to form a comprehensive analysis.

2.1. Forecast Data

Researchers use different models to predict the amount of rainfall that will occur in a given area. The predictions are then analyzed using data collected by the China Metrological Agency. For the study, the agency’s data were used to forecast the flow of water in the Nullah Lai stream. Over 500 forecasts have been made regarding the rainfall that will happen in the watershed of the Nullah Lai. These predictions were made using a format known as grib, which is a representation of the latitude and longitude network. Data on the precipitation were collected from the data center of the China Metrological Agency from 2017 to 2019. The data collected during the study were gathered by researchers using grib files, which were collected monthly. They only used this method for the predictions since they were only focused on extreme weather events that usually occur during the monsoon season. Each file was analyzed separately and used for forecasting the rainfall. Two separate files containing 48 h and 72 h worth of rainfall data were downloaded. These were then split into two grib files, one containing a forecast and the other a plot of the accumulated rainfall. The grib files were then processed using a utility known as wgrib2. The NetCDF file was then processed using the ARC-GIS 10.3 platform. This method generated a total of 48 h worth of forecast data. After that, a table extract tool was used to extract the data into a format that can be used to display the forecast. All 12 events’ data were then analyzed and processed in order to produce a graphical representation of the data.

2.2. Rainfall and Stage Data

The data collected by PMD included the daily total rainfall from various gauge stations located in Chaklala, Bokra, Golra, RAMC, Saidpur, and PMD. These measurements were taken from 2010 to 2020. Location shown in Figure 1.

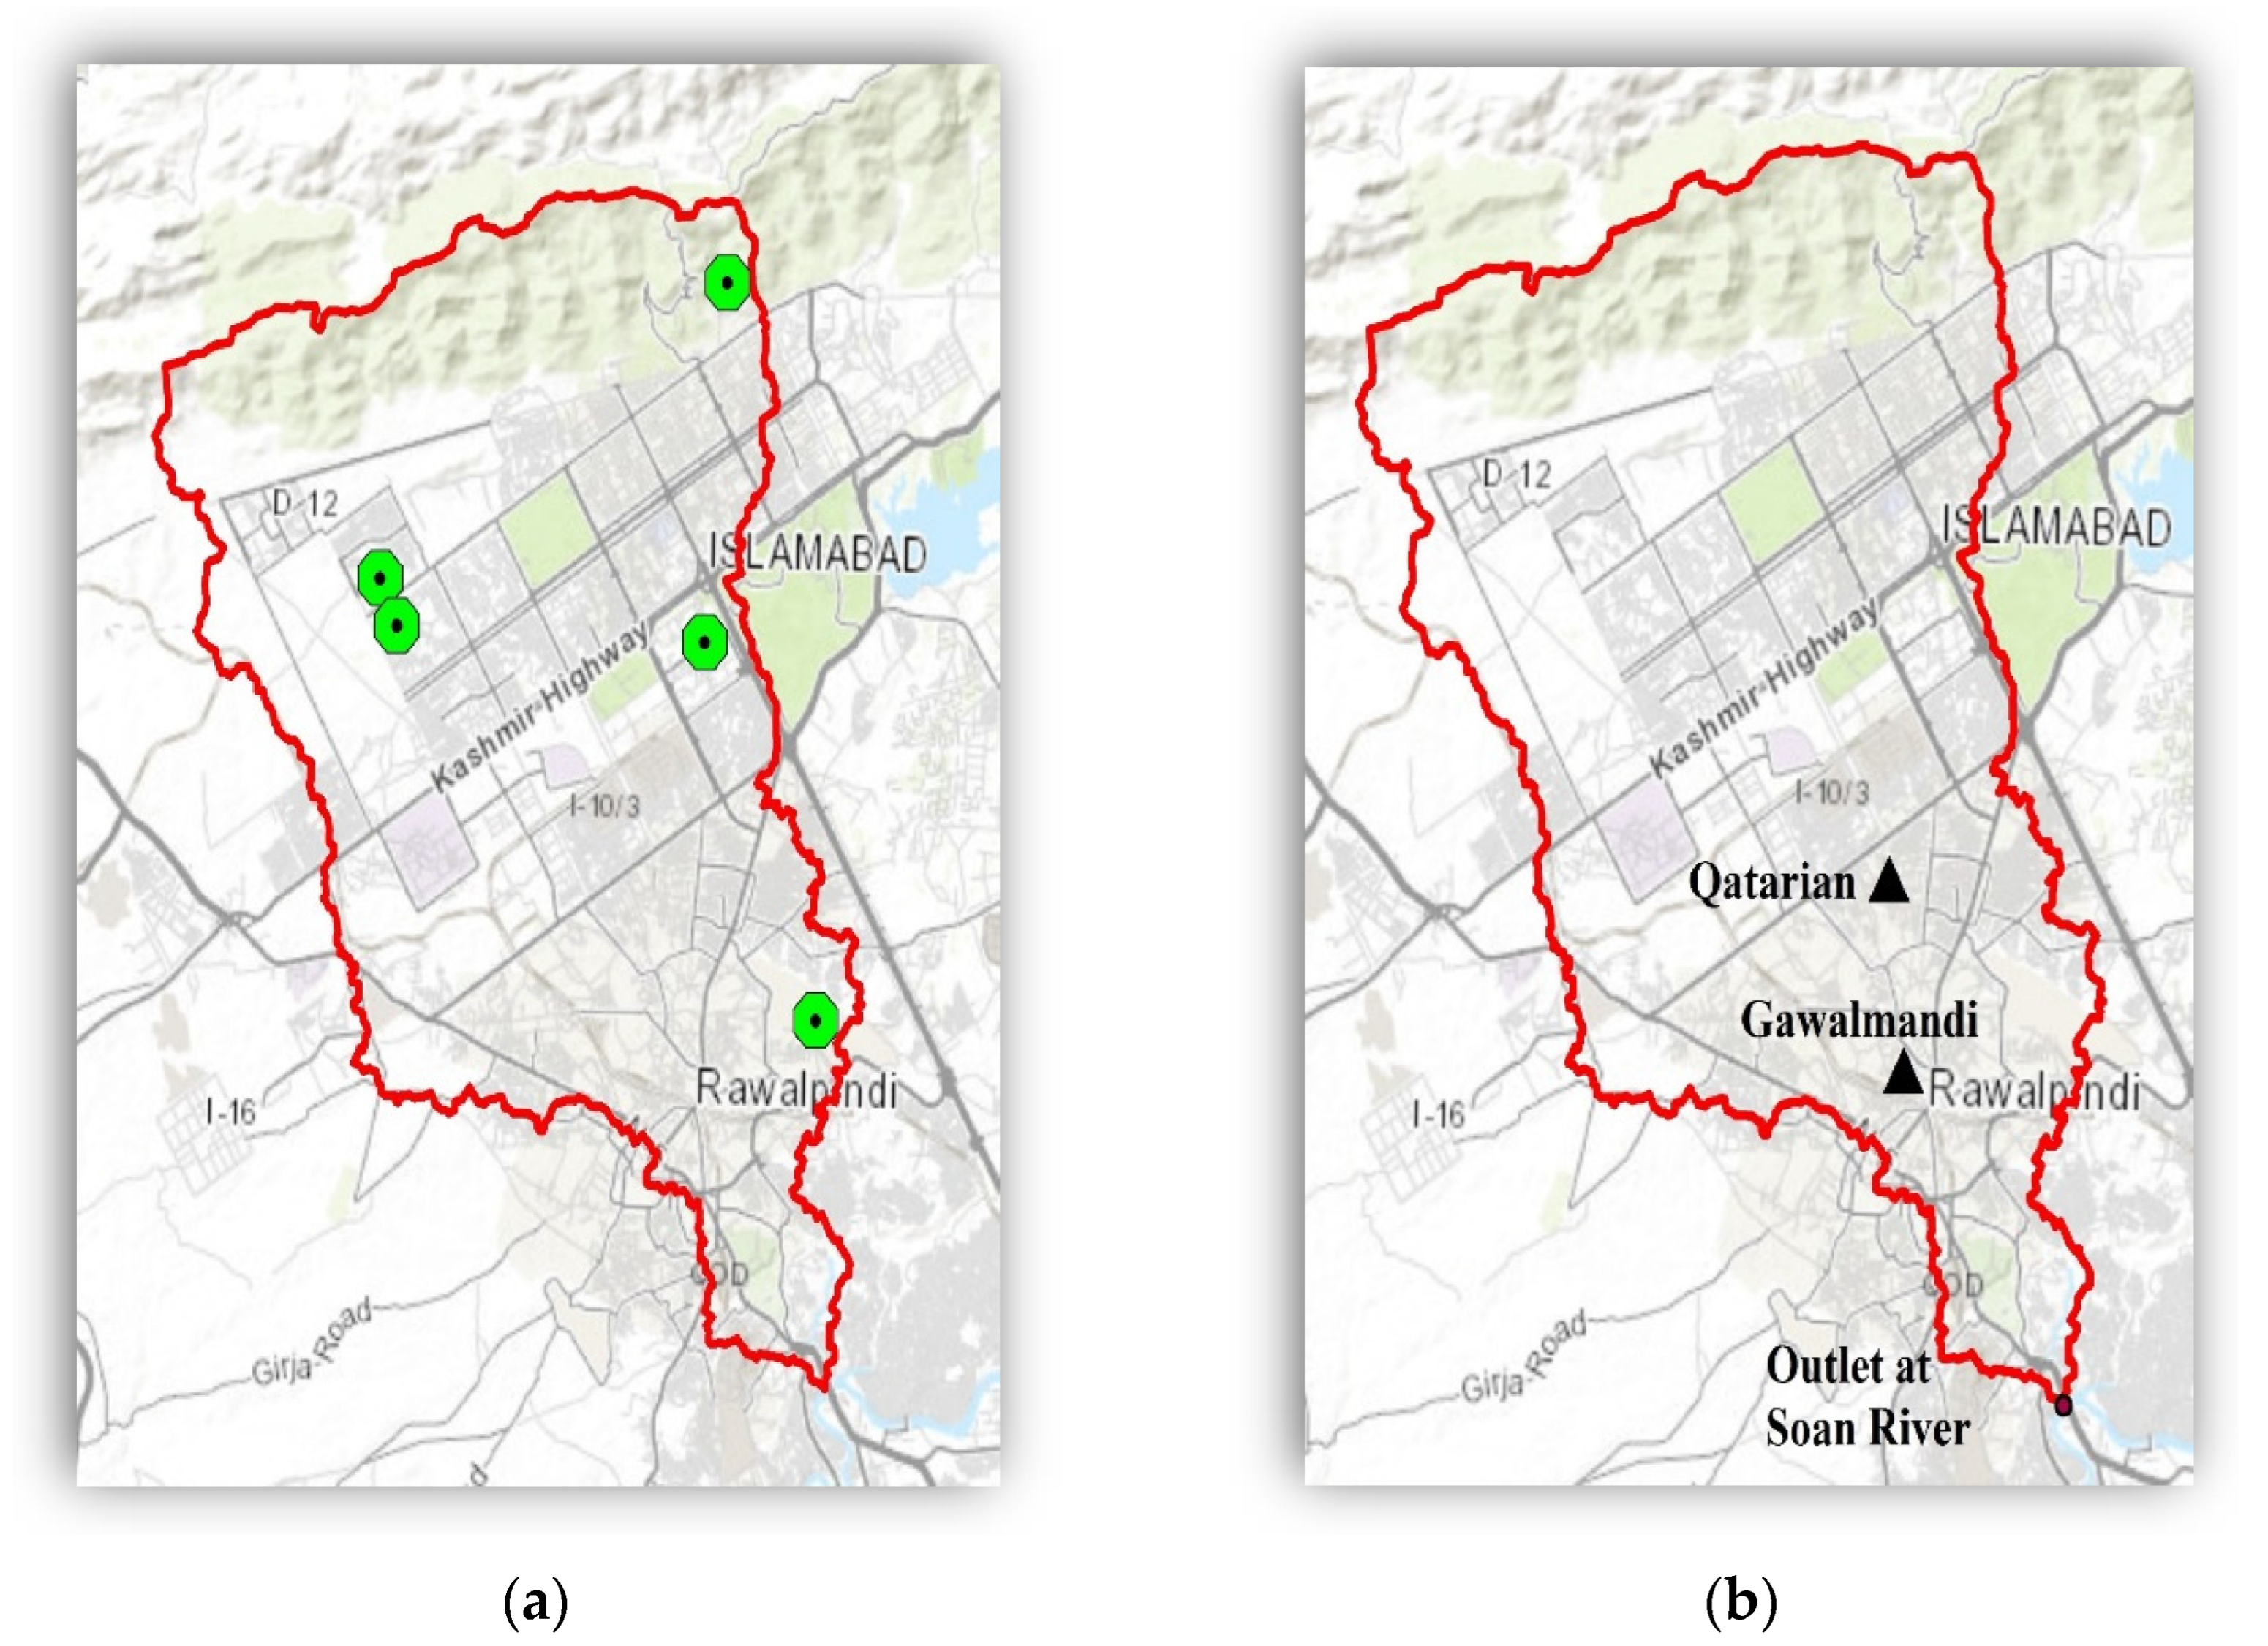
2.3. Digital Modelling of Nullah Lai Catchment

A catchment area is a region of land where rain falls and flows toward a common outlet. Without a digital modeling process, the drawing of a watershed area can be very time-consuming and challenging. This process can be carried out with the help of tools such as the ArcGIS software.
The following describes the steps in the process of digital modeling of Nullah Lai’s catchment area. After downloading the data from the USGS website, using the DEM format, the area’s digital elevation can be marked with the coordinates of its source. In addition, using the spatial analytic tool, a ‘‘fill’’ tool can be applied to the area.
The ‘‘flow direction’’ tool can be used to obtain a view of the flow directions in the water. The ‘‘basin tool’’ can also be used to delineate the various drainage basins. The conversion tool for the Raster-to-Polygon and Raster-to-Polygons conversions can be used to convert the image into a polygon. Finally, the ‘‘clip tool’’ can be used to clip the watershed from other areas.
The ‘‘flow accumulation’’ tool can be used to create a file that contains the water flow data. The ‘‘Raster Calculator’’ tool to can then be used to make a water stream network. In the conversion segment, the ‘‘Raster’’ tool can be used to transform the streams into polygons. Finally, the ‘‘clip’’ tool can be used to clip the steam lines from other areas.
The input outlet point coordinates can be used to draw the catchment area to a specific point. The ‘‘pour point’’ tool can also be used to create a watershed area that is respected by each outlet point. Finally, the “Theisen Polygons” tool can be used to create a representation of the rain gauge’s polygons.

2.4. Observed Rainfall—Stage Modelling

After collecting data about the rainfall and runoff in the area, a model was developed using the DTREG numerical modeling software. This tool was used to create a Gene Ex-pression Program, which was able to mimic the biological process of developing the phenomenon. The process of gene expression programming involves developing various types of systems, such as decision trees and networks of neural and polynomial concepts. In DTREG, this type of programming is referred to as symbolic regression.
The following relation was obtained by analyzing the 7 years of rainfall and stage data.
S = Sqrt(P − 6.2275699) + ((−26.983058)/P) + 1.8792162 + Sqrt(SqrtP))
  • Stage is denoted as “S”
  • Basin mean of rainfall is denoted as “P”.

3. Materials and Methods

The research utilized statistical and digital modeling techniques to develop a model of Nullah Lai catchment, shown in Figure 2. The data collected from various sources, such as TIGGI and PMD, were then processed using wgrib2, DTREG, MS Excel, and ArcGIS. The main objective of this study was to create a statistical model of the rainfall–runoff event and to relate this to the data collected by the CMA ensemble.

4. Results and Analysis

The results of this study are compared with the actual runoff and rainfall produced by the different ensembles. The twelve extreme events that occurred during the 2017 to 2019 monsoon season are discussed here to highlight the significant runoff in the Nullah Lai. Researchers are more likely to focus on the ensemble forecast due to the varying atmospheric conditions. Due to the varying topography and flow conditions of the Nullah Lai catchment area, it is difficult to predict the exact amount of rainfall that will occur. This section aims to provide a comprehensive analysis of the rainfall–runoff and provides a comparison with the ensemble forecast.

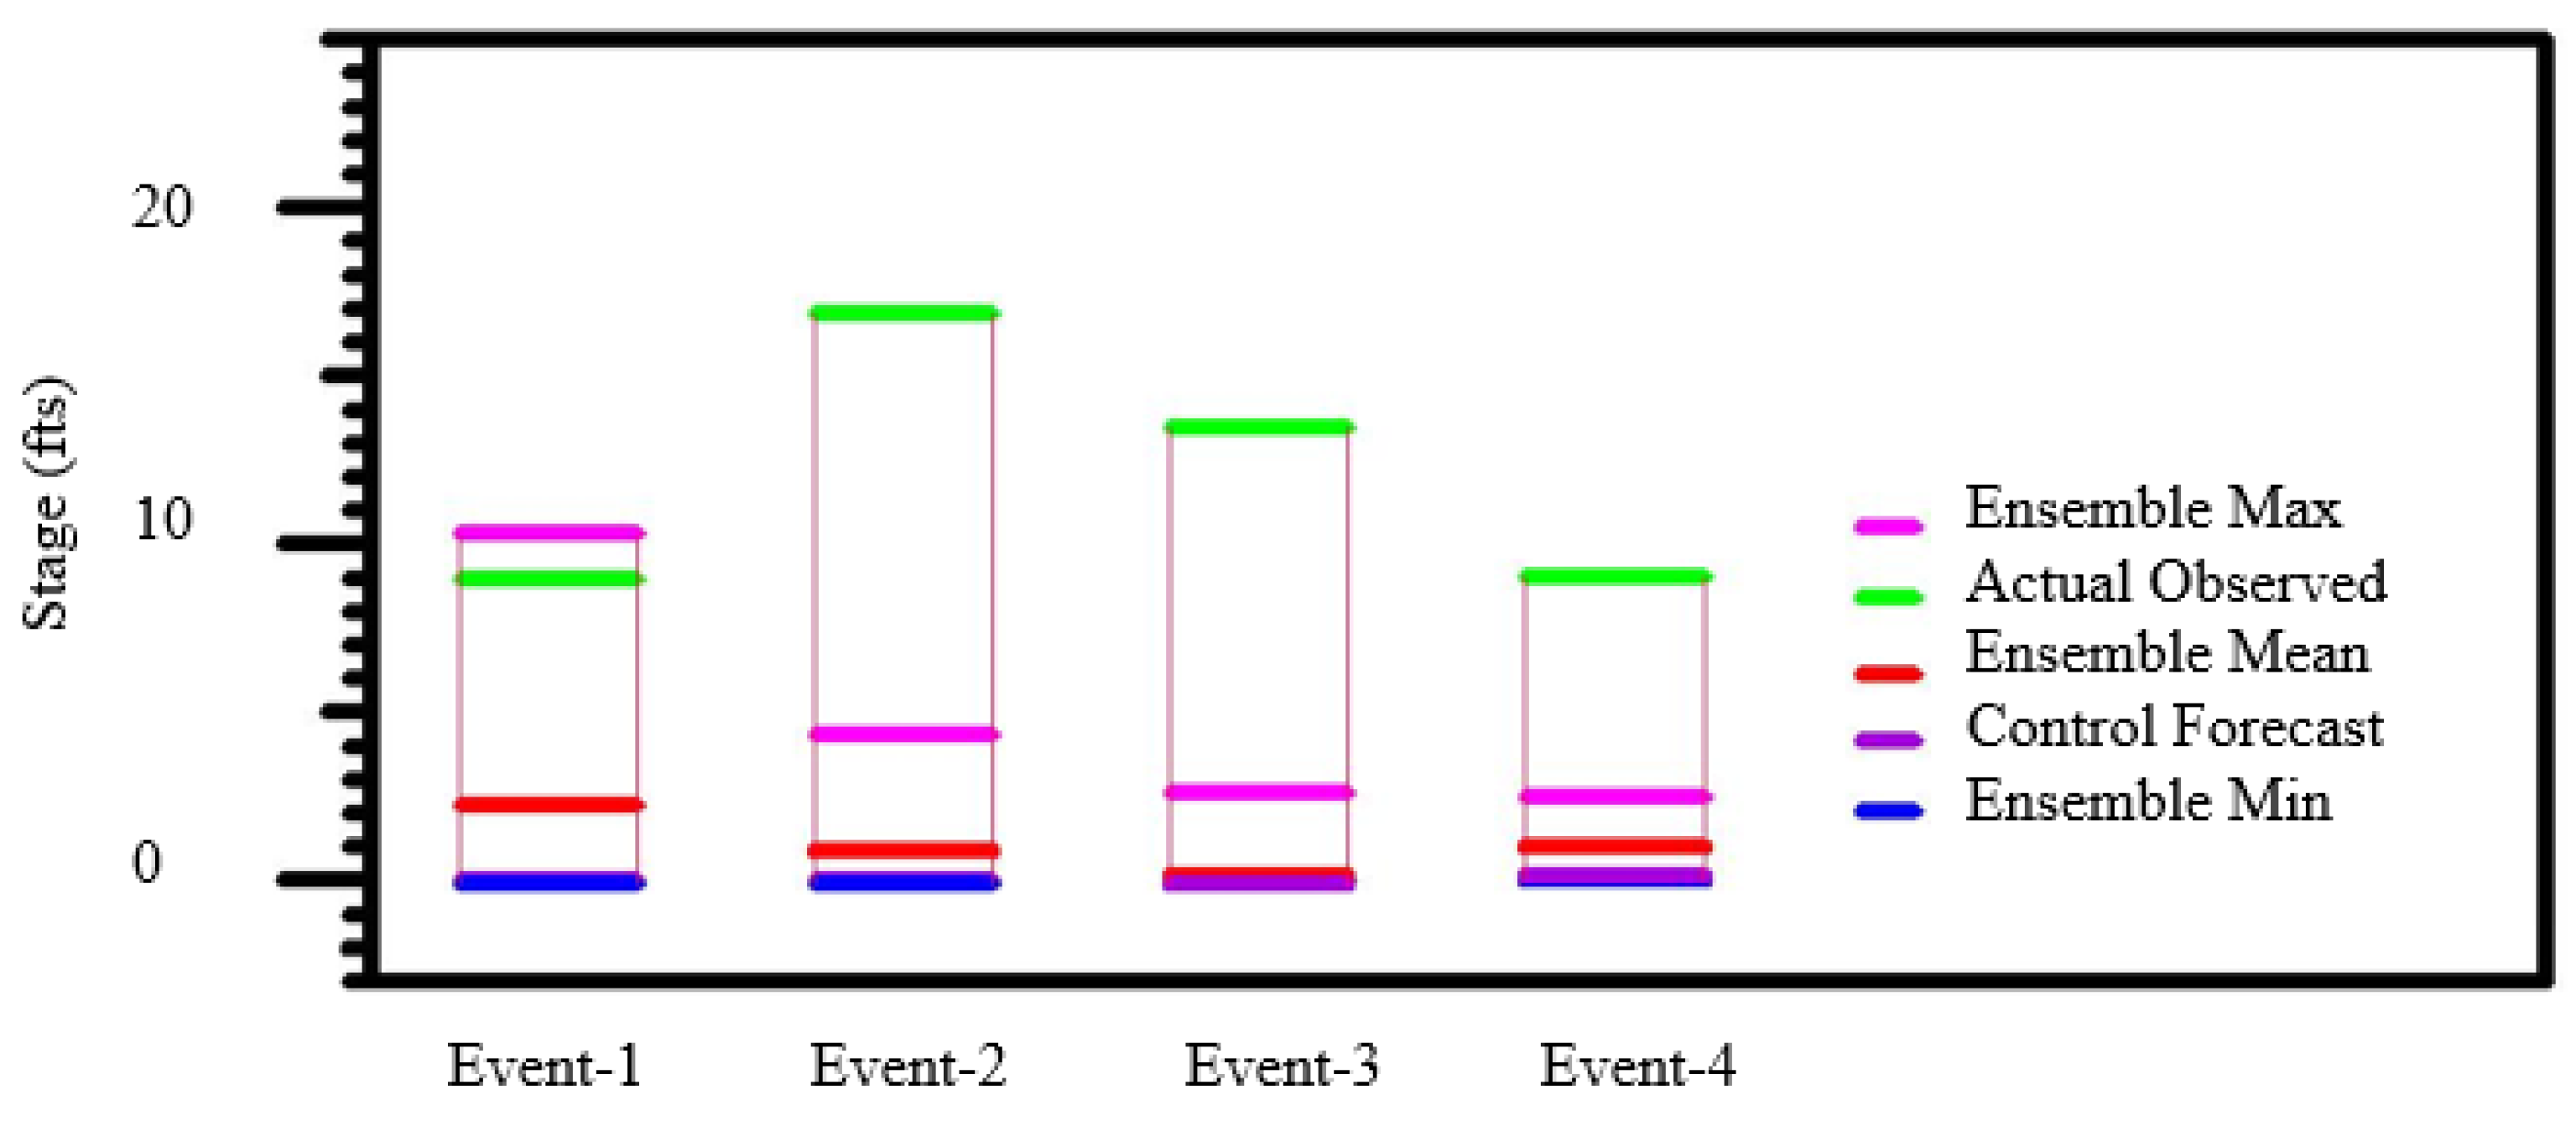
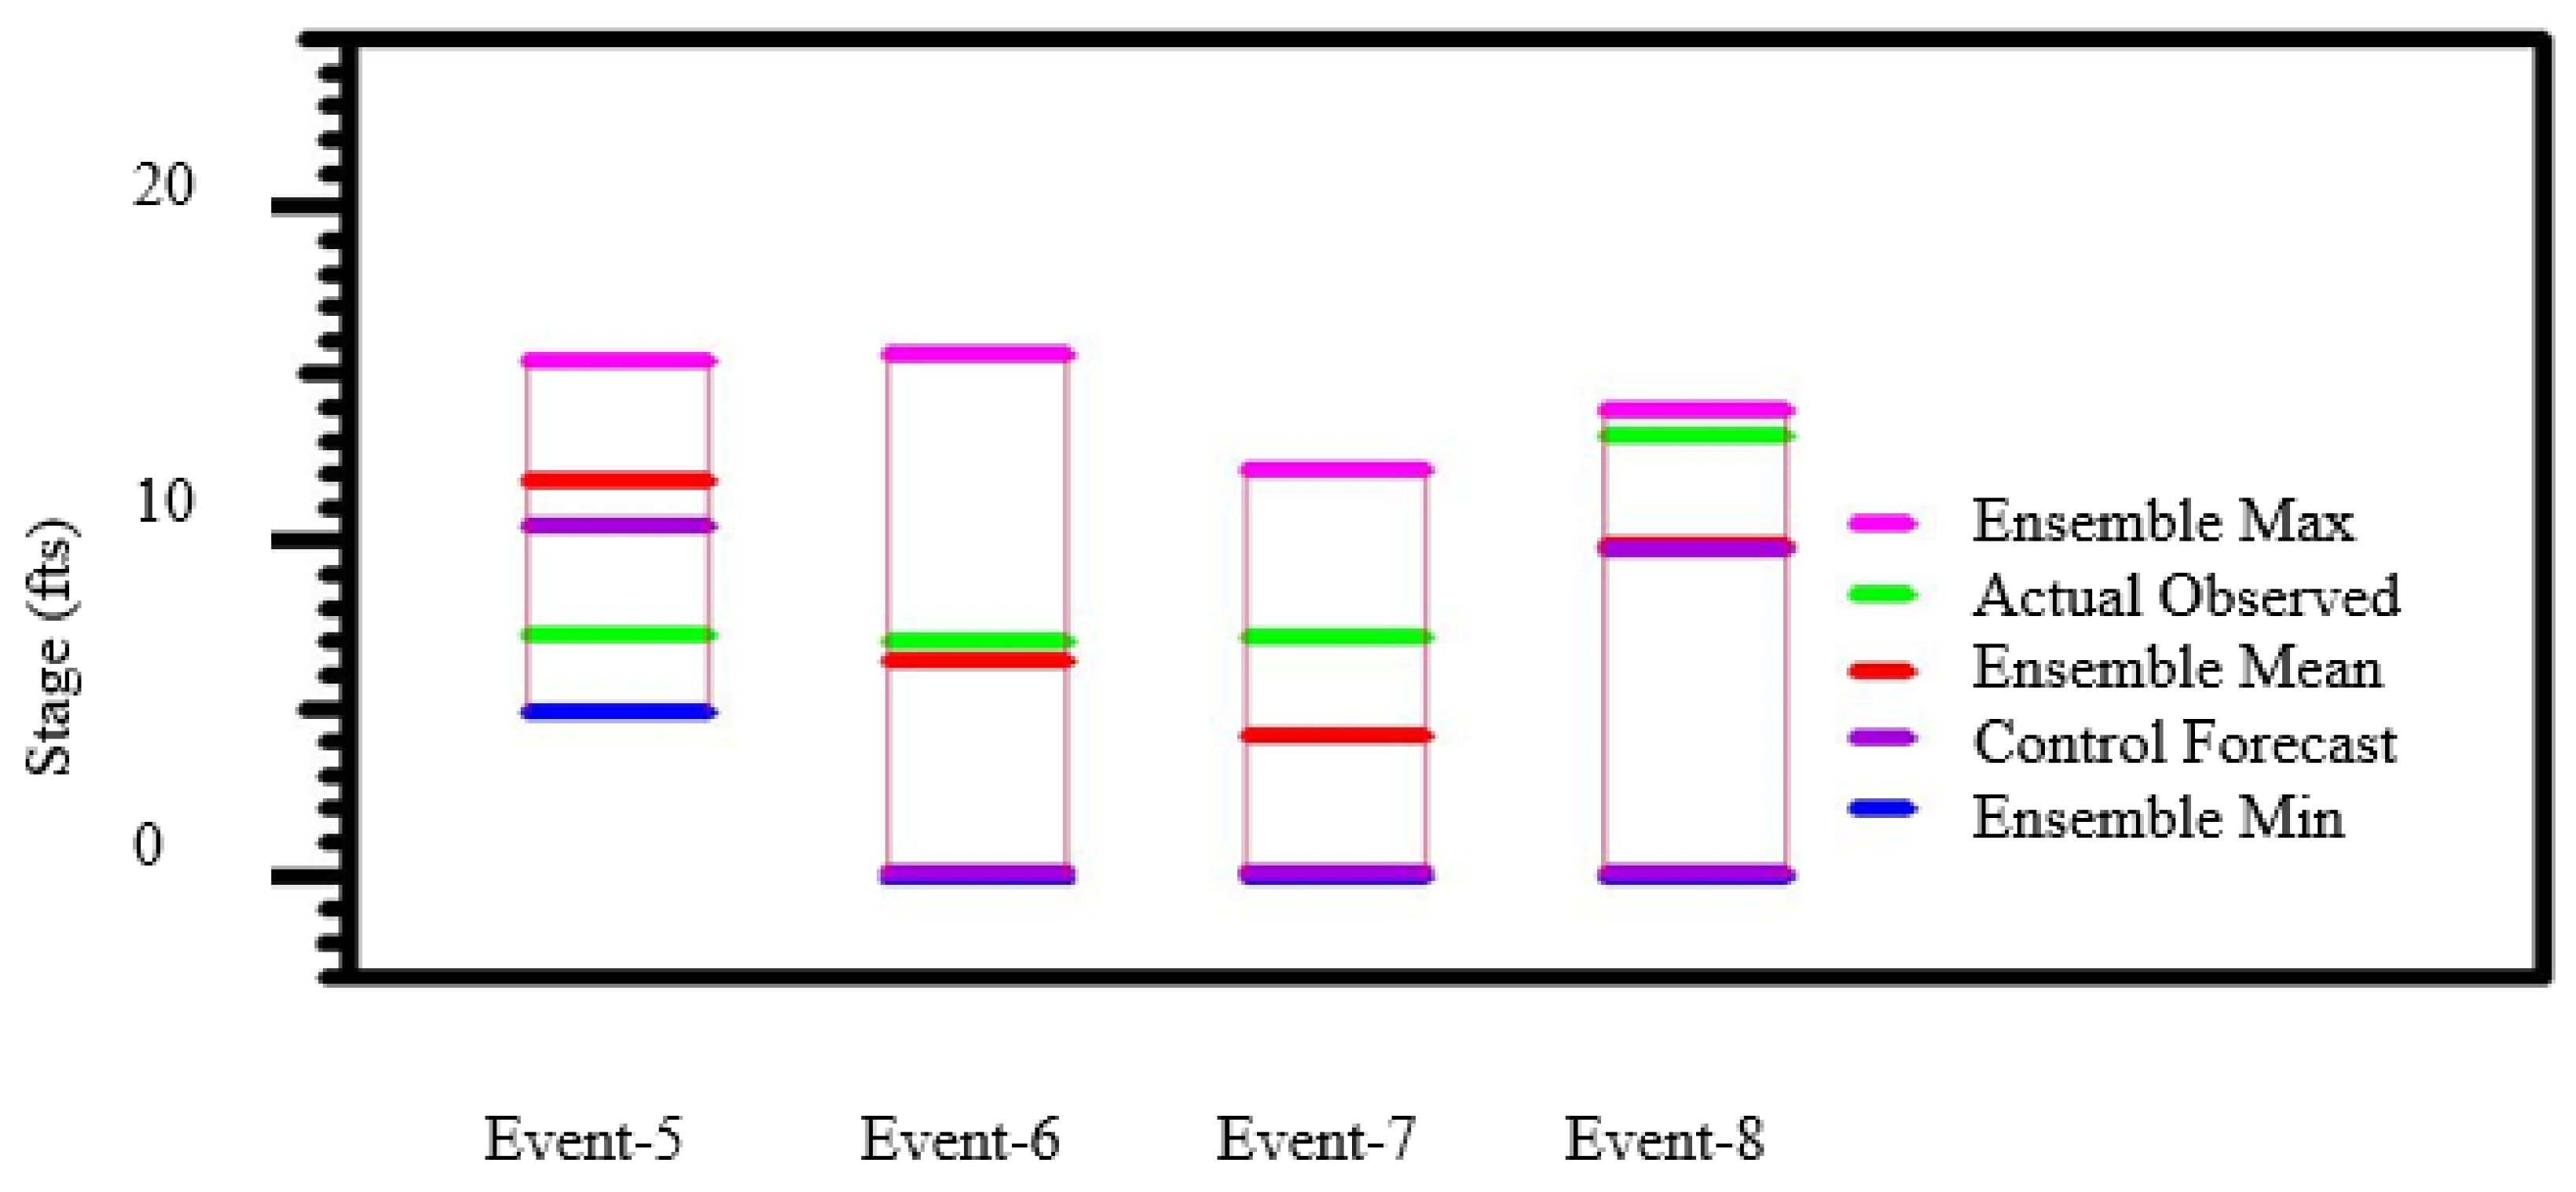
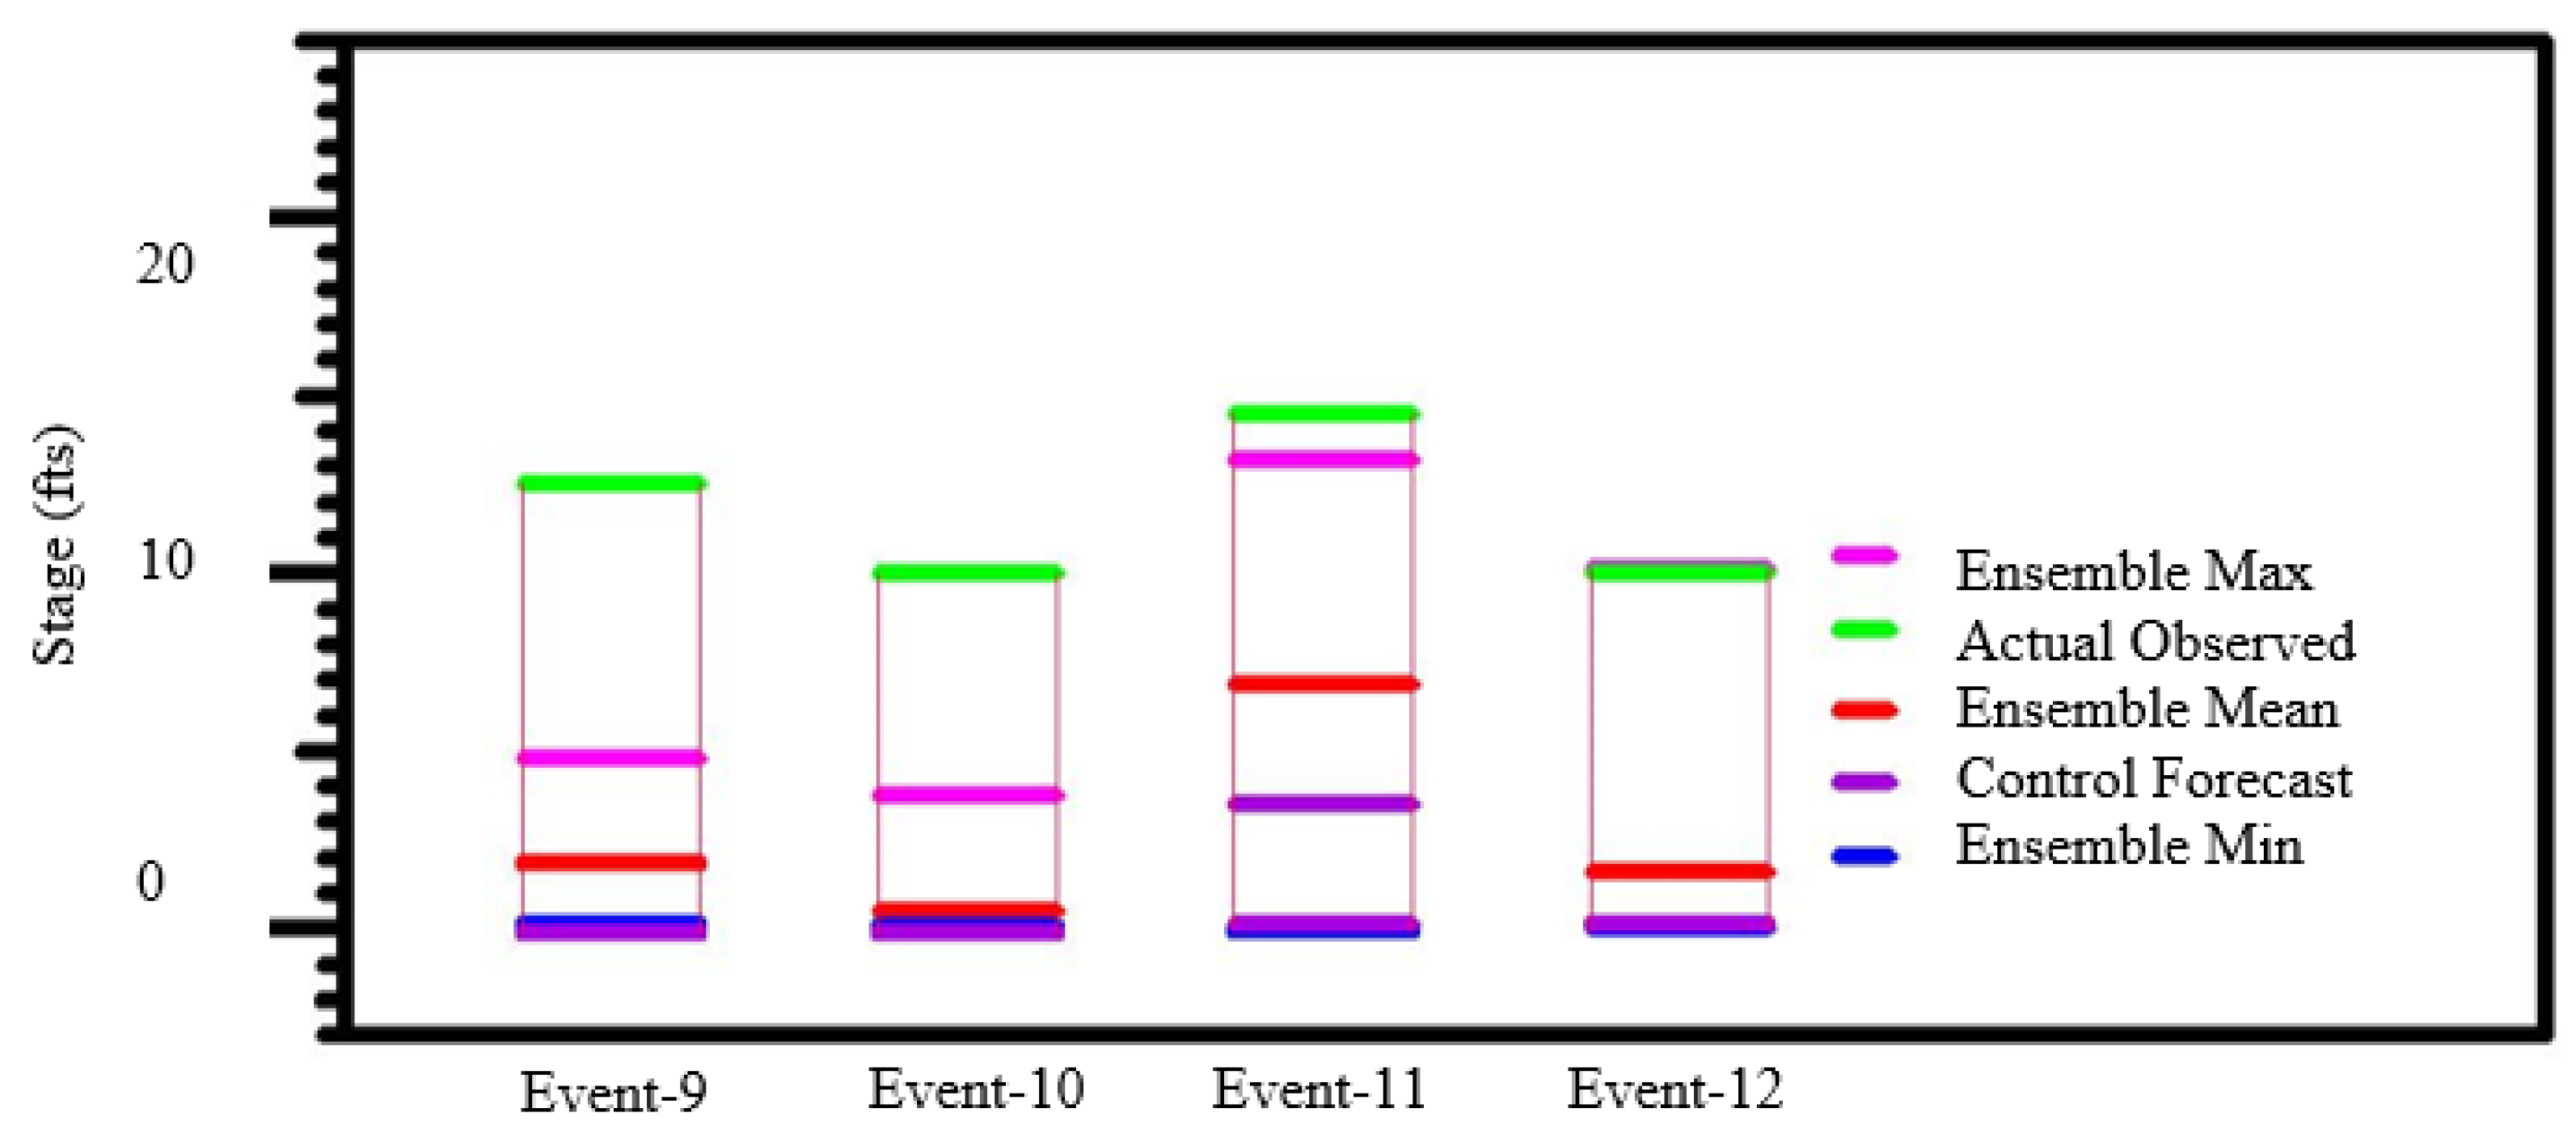
Ensemble Predicted Stage vs. Actual Stage

This section compares the ensemble stage, forecasted stage, and actual observed data from the obtained results. It also provides a range of possible outcomes for a given event. Figure 3, Figure 4 and Figure 5 graphically explain the twelve (12) extreme events from 2017 to 2019.
The predicted outcome of the controlled forecast is 16.67%. This means that only two out of the twelve predictions were carried out correctly. It can be concluded that the forecast is misleading and cannot take into account other factors that can affect the prediction. The ensemble prediction system was able to provide a precise estimate of the flow’s expected range.
The accuracy rate of forecasting an event out of 12 events was 7 out of 12. This means that the predicted outcome is 58.33% accurate. The advantage of using an ensemble forecast is that it provides a better idea of the likelihood of an extreme event happening within the next 3 days.

5. Conclusions

The following conclusions can be drawn from the conducted study:
1.
The Nullah Lai watershed was digitally modelled using the latest version of ArcGIS 10.3.1. This model was made using the most accurate digital elevation data from the USGS;
2.
The model was able to produce a root mean square of 77% and a correlation coefficient of 0.88. The data collected during the period indicated that the model is very accurate;
3.
The forecasting system was used to study 12 extreme events that occurred from 2017 to 2019. Out of these, seven events were within the range of the ensemble forecast. The results show that the ensemble forecast is more accurate than the control forecast when it comes to forecasting events.

Author Contributions

Conceptualization, M.M.K.; Data curation: M.A.S.; Formal analysis: M.A.S.; Methodology: M.A.S.; Validation: R.K.; Writing—original draft: M.A.S.; Writing—review and editing. S.A.R.S. All authors have read and agreed to the published version of the manuscript.

Funding

This research received no external funding.

Institutional Review Board Statement

Not applicable.

Informed Consent Statement

Not applicable.

Data Availability Statement

Data will be available upon reasonable demand.

Acknowledgments

This paper is based on thesis submitted by Muhammad Aamir Siddiqui at CED, BZU.

Conflicts of Interest

The authors declare no conflict of interest.

References

  1. Khummongkol, R.; Sutivong, D.; Kuntanakulwong, S. Water Resource Management Using Multi-Objective Optimization and Rainfall Forecast. In Proceedings of the 2007 International Conference on Convergence Information Technology (ICCIT 2007), Gwangju, Republic of Korea, 21–23 November 2007. [Google Scholar]
  2. Borga, M.; Anagnostou, E.; Blöschl, G.; Creutin, J.-D. Flash flood forecasting, warning and risk management: The HYDRATE project. Environ. Sci. Policy 2011, 14, 834–844. [Google Scholar] [CrossRef]
  3. Siccardi, F.; Boni, G.; Ferraris, L.; Rudari, R. A hydrometeorological approach for probabilistic flood forecast. J. Geophys. Res Atmos. 2005, 110. [Google Scholar] [CrossRef]
  4. Cloke, H.; Pappenberger, F. Ensemble flood forecasting: A review. J. Hydrol. 2009, 375, 613–626. [Google Scholar] [CrossRef]
  5. Taylor, J.; Buizza, R. Neural network load forecasting with weather ensemble predictions. IEEE Trans. Power Syst. 2002, 17, 626–632. [Google Scholar] [CrossRef]
  6. Shoaib, M.; Shamseldin, A.Y.; Khan, S.; Khan, M.M.; Khan, Z.M.; Sultan, T.; Melville, B.W. A comparative study of various hybrid wavelet feedforward neural network models for runoff forecasting. Water Resour. Manag. 2018, 32, 83–103. [Google Scholar] [CrossRef]
  7. Shaukat, R.S.; Khan, M.M.; Shahid, M.; Shoaib, M.; Khan, T.A.; Aslam, M.A. Quantitative Contribution of Climate Change and Land Use Change to Runoff in Tarbela Catchment, Pakistan. Pol. J. Environ. Stud. 2020, 29, 3295–3304. [Google Scholar] [CrossRef] [PubMed]
  8. Hammad, M.; Shoaib, M.; Salahudin, H.; Baig, M.A.I.; Khan, M.M.; Ullah, M.K. Rainfall forecasting in upper Indus basin using various artificial intelligence techniques. Stoch. Environ. Res. Risk Assess. 2021, 35, 2213–2235. [Google Scholar] [CrossRef]
  9. Shoaib, M.; Shamseldin, A.Y.; Melville, B.W.; Khan, M.M. Runoff forecasting using hybrid wavelet gene expression programming (WGEP) approach. J. Hydrol. 2015, 527, 326–344. [Google Scholar] [CrossRef]
  10. Krzysztofowicz, R. The case for probabilistic forecasting in hydrology. J. Hydrol. 2001, 249, 2–9. [Google Scholar] [CrossRef]
  11. Khan, M.M.; Shamseldin, A.Y.; Melville, B.W. Impact of ensemble size on forecasting occurrence of rainfall using TIGGE precipitation forecasts. J. Hydrol. Eng. 2014, 19, 732–738. [Google Scholar] [CrossRef]
  12. Khan, M.M.; Shamseldin, A.Y.; Melville, B.W.; Shoaib, M. Impact of ensemble size on TIGGE precipitation forecasts: An end-user perspective. J. Hydrol. Eng. 2015, 20, 04014046. [Google Scholar] [CrossRef]
  13. Ahmad, B.; Kaleem, M.S.; Butt, M.J.; Dahri, Z.H. Hydrological modelling and flood hazard mapping of Nullah Lai. Proc. Pak. Acad. Sci. 2010, 47, 215–226. [Google Scholar]
  14. Morss, R.E.; Emanuel, K.A.; Snyder, C. Idealized adaptive observation strategies for improving numerical weather prediction. J. Atmos. Sci. 2001, 58, 210–232. [Google Scholar] [CrossRef]
Figure 1. (a) Rain-Gauging Station; (b) Stage-Measuring Stations (right-2) Position.
Environsciproc 25 00096 g001
Figure 2. (a) Raster layer over Nullah Lai catchment; (b) CMA data processing; (c) Extracting forecast using ArcGIS.
Environsciproc 25 00096 g002
Figure 3. Event 1, 2, 3, and 4: Stage graphical representation.
Environsciproc 25 00096 g003
Figure 4. Event 5, 6, 7, and 8: Stage graphical representation.
Environsciproc 25 00096 g004
Figure 5. Event 9, 10, 11, and 12: Stage graphical representation.
Environsciproc 25 00096 g005
Disclaimer/Publisher’s Note: The statements, opinions and data contained in all publications are solely those of the individual author(s) and contributor(s) and not of MDPI and/or the editor(s). MDPI and/or the editor(s) disclaim responsibility for any injury to people or property resulting from any ideas, methods, instructions or products referred to in the content.

