Proceeding Paper

Flood Wave Dynamics in the Transboundary Dniester River Floodplain under Reservoirs Impact †

Institute of Ecology and Geography, Moldova State University, MD-2028 Chisinau, Moldova
Presented at the 7th International Electronic Conference on Water Sciences, 15–30 March 2023; Available online: https://ecws-7.sciforum.net.
Environ. Sci. Proc. 2023, 25(1), 92; https://doi.org/10.3390/ECWS-7-14193
Published: 14 March 2023
(This article belongs to the Proceedings of The 7th International Electronic Conference on Water Sciences)

Abstract

:
The present research aims to evaluate the impact of stream reservoirs on the Dniester river floods wave dynamics. The main approach consisted in the evaluation of the changes that occur in the flood parameters for three periods: natural flow, flow regulated by Dubasary reservoir, flow regulated by the Dniester hydropower complex and Dubasary reservoir. Using the hydrological time series from the stations situated upstream and downstream of the reservoirs, the following were calculated and compared: flood characteristics, peaks of 10, 5, 1, 0.5, and 0.1% probability, and environment flow components such as high-flow pulses, small floods, large floods. The results show that high flood protection is specific to the Dniester hydropower complex, while through the Dubasary reservoir the flood wave passes mainly in transit. Due to the flow regulating impact, small floods as well as their average peaks and duration were reduced toward the reservoirs’ downstream part. High-flow pulses increased in number after the Dniester hydropower complex construction due to hydropeaking effect; however, their reduction is observed downstream of the Dubasary reservoir. Large floods increase in number in the upper part but are transformed into small floods toward the downstream, thus increasing the flood protection capacity.

1. Introduction

Floods are the most frequent calamities registered in the limits of the Republic of Moldova. From the total number of natural disasters that occurred in the last four decades, floods accounts for 50%; the damage share rising to the same value (45%) [1,2]. The main factor that determines the flood wave generation is represented by extreme climatic conditions expressed by fast snow melt in winter and heavy rains in summer. The largest floods are formed in the floodplains of transboundary big rivers, the Prut and Dniester, in conditions of large water volumes brought from the upper parts of the river basins from Ukraine [1]. Moreover, significant damages are caused by flash floods generated as a result of the heavy rains and excessive slope runoff [1,2]. Certain measures are taken in order to reduce the impact of floods on humans, infrastructure, and economic activity, among which are reservoirs and levee systems. The present research aims to evaluate the impact of stream reservoirs on the Dniester river summer floods dynamics. In order to reflect the tendency of flood change determined by the reservoirs operation, several objectives were designed: identification of certain parameters that can show flood change; collection and analysis of hydrological data; evaluation of flood modifications in space and time from upper to lower course and from natural flow to regulated flow.

2. Study Area

The Dniester is a transboundary river and flows through Ukraine and the Republic of Moldova. The river length is 1362 km and the basin area is 72,100 km2. Over 70% of the basin is situated in Ukraine, 27% belong to Republic of Moldova, and 0.34% to Poland. The upper part of the basin lies in Carpathians and represents only 30% of the basin area, but due to the high amounts of precipitations, 70% of Dniester runoff is generated in this area. Average annual flow in about 300 m3/s [2,3]. The flow of the Dniester River is regulated by three reservoirs situated on the stream and one positioned lateral to the river. Three of these reservoirs form the Dniester hydroelectric complex (DHC): the Dnestrovsk reservoir with HPP-1 (water volume—2.6 km3), the buffer reservoir with HPP-2 (volume of 37 mil. m3), the artificial reservoir with pumped storage hydroelectric power plant (volume of 41.4 mil. m3). DHC is situated at the border of Ukraine and the Republic of Moldova. Also, regulation of the Dniester flow is performed by the Dubasary reservoir, positioned in the limits of the Republic of Moldova [4,5].

3. Materials and Methods

The main approach applied in order to investigate the impact of the reservoir cascade on the Dniester river flood dynamics consisted in comparative analysis of the hydrological data collected in natural conditions of flow generation, as well as during the impact of the DHC and Dubasary reservoir operation. This approach is in line with the usually applied main designs: (1) Paired-Before–After Control–Impact, (2) Before–After, (3) Control–Impact, (4) Hydrological Classification, and (5) Predicted Hydrological indices [6]. Moreover, one of the modern approaches is determination of the main Hydrological Alteration Indicators and Environment Flow Components, which is applied for the estimation of impact of reservoirs operation on river flow [7,8,9]. Thus, hydrological characteristics were comparatively analyzed for three periods: the first corresponds to natural runoff, the second coincides with Dubasary reservoir functioning (1956–1982 years), the third represents the entire flood protection system operation (from 1987 till present). The analyzed times series were considered from the hydrological stations: Zalishchyky (situated upstream of the DHC), Hrushca (situated downstream of the DHC), Bender (situated downstream of the Dubasary reservoir, in the lower part of the basin). Based on the hydrological time series, the following were calculated and compared for three time periods: flood characteristics, peak discharge attenuation coefficient, peaks of 10, 5, 1, 0.5, and 0.1% probability, and environment flow components such as high-flow pulses, small floods, large floods.
The hydrological information used in this study was provided by the responsible data organizations in Moldova and Ukraine: the State Hydrometeorological Service (SHS) [10] and State Water Agency. Data were collected through UNDP in Moldova, Ministry of Environment of the Republic of Moldova, the Commission on Sustainable Use and Protection of the Dniester River Basin (the Dniester Commission).

4. Results and Discussions

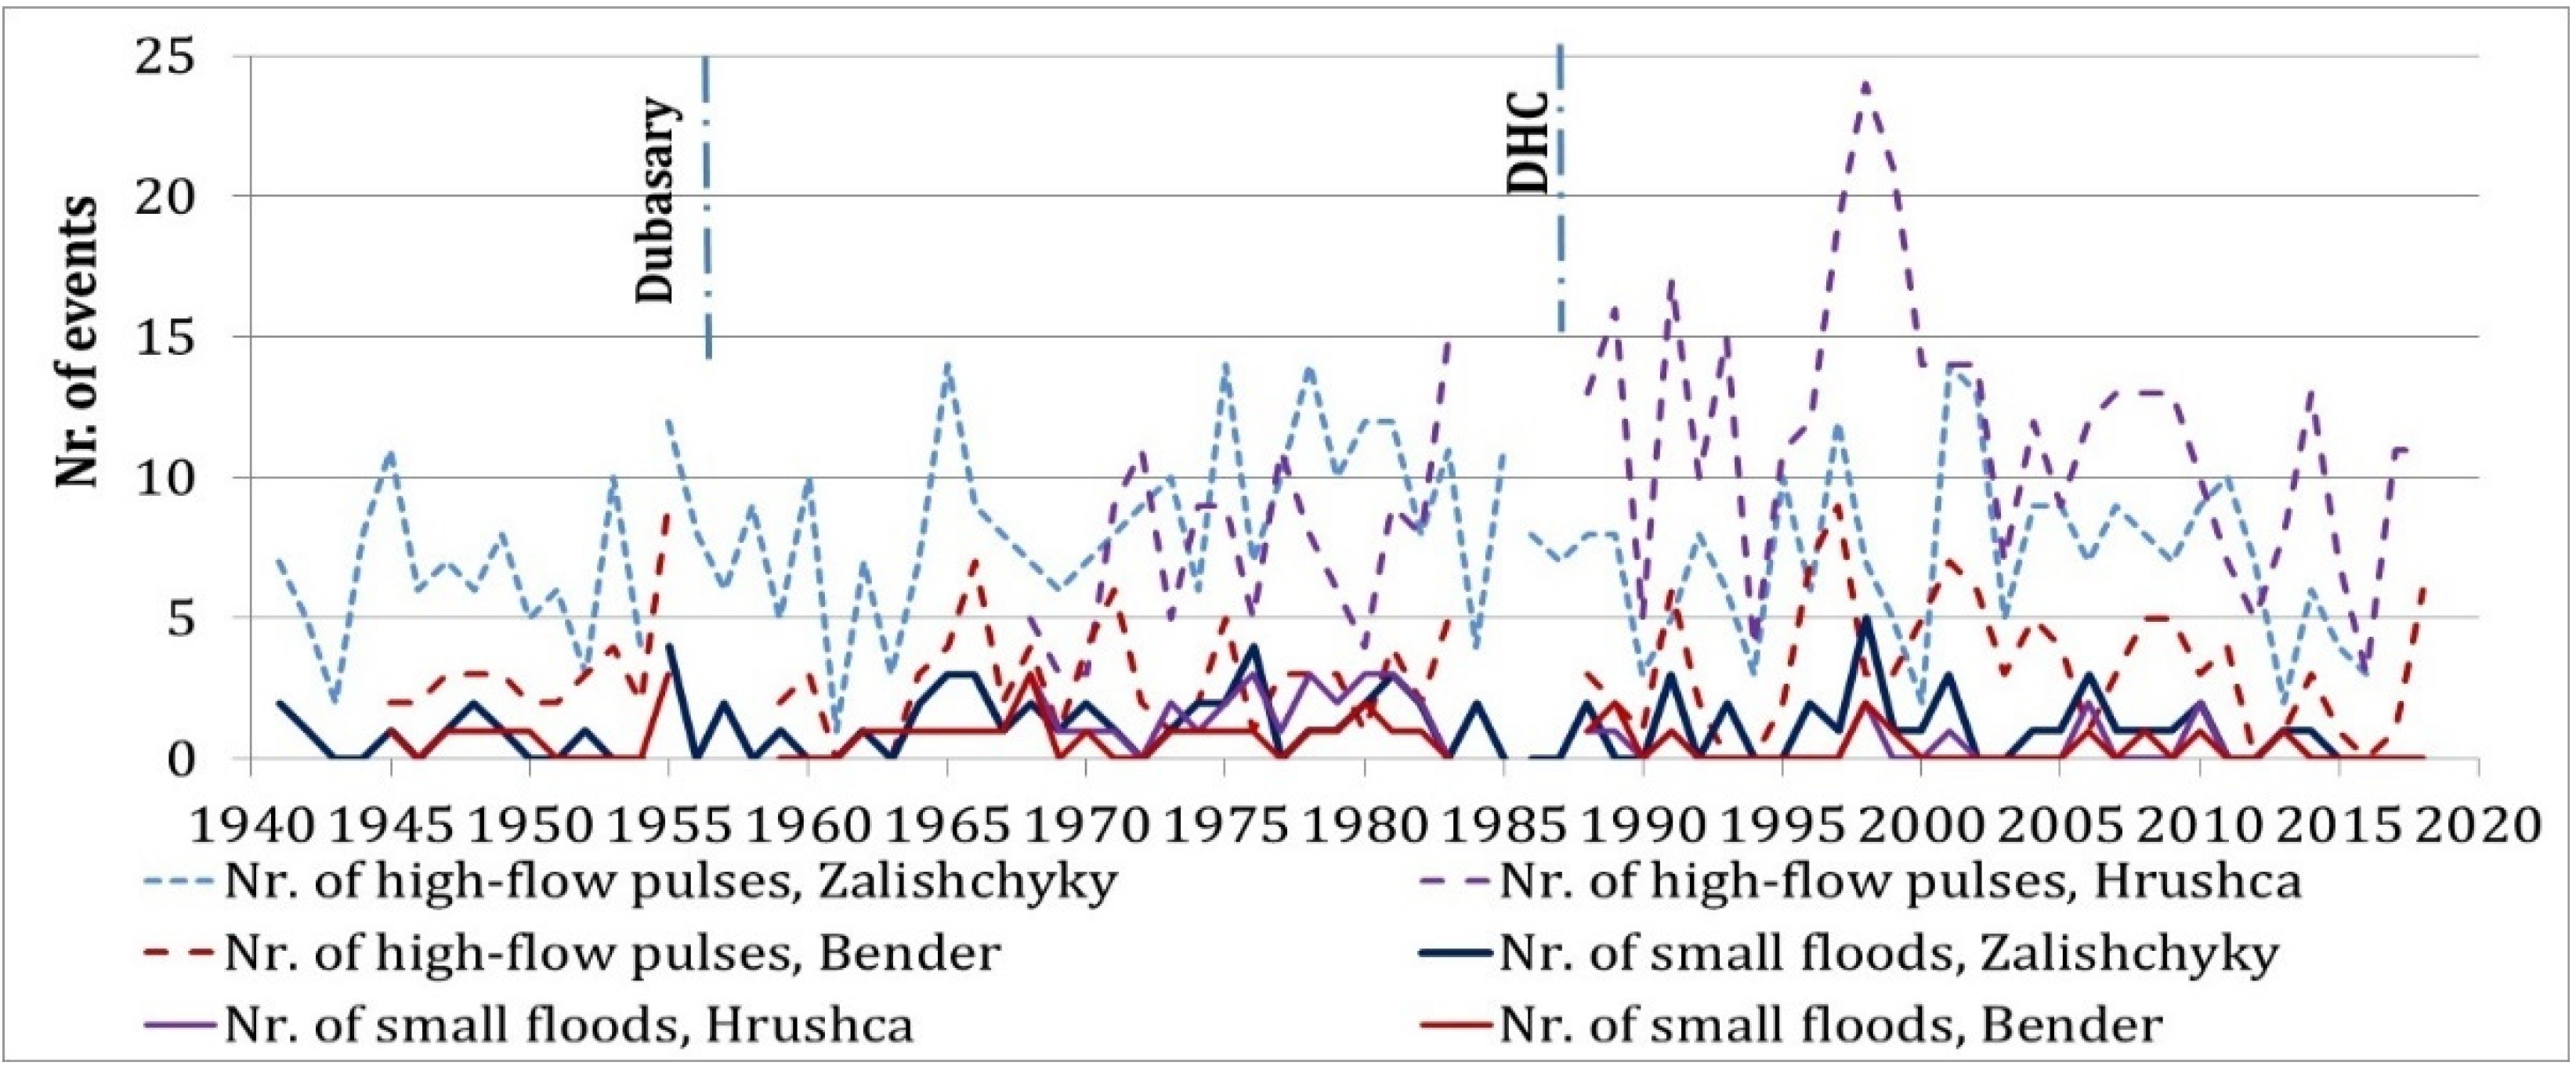
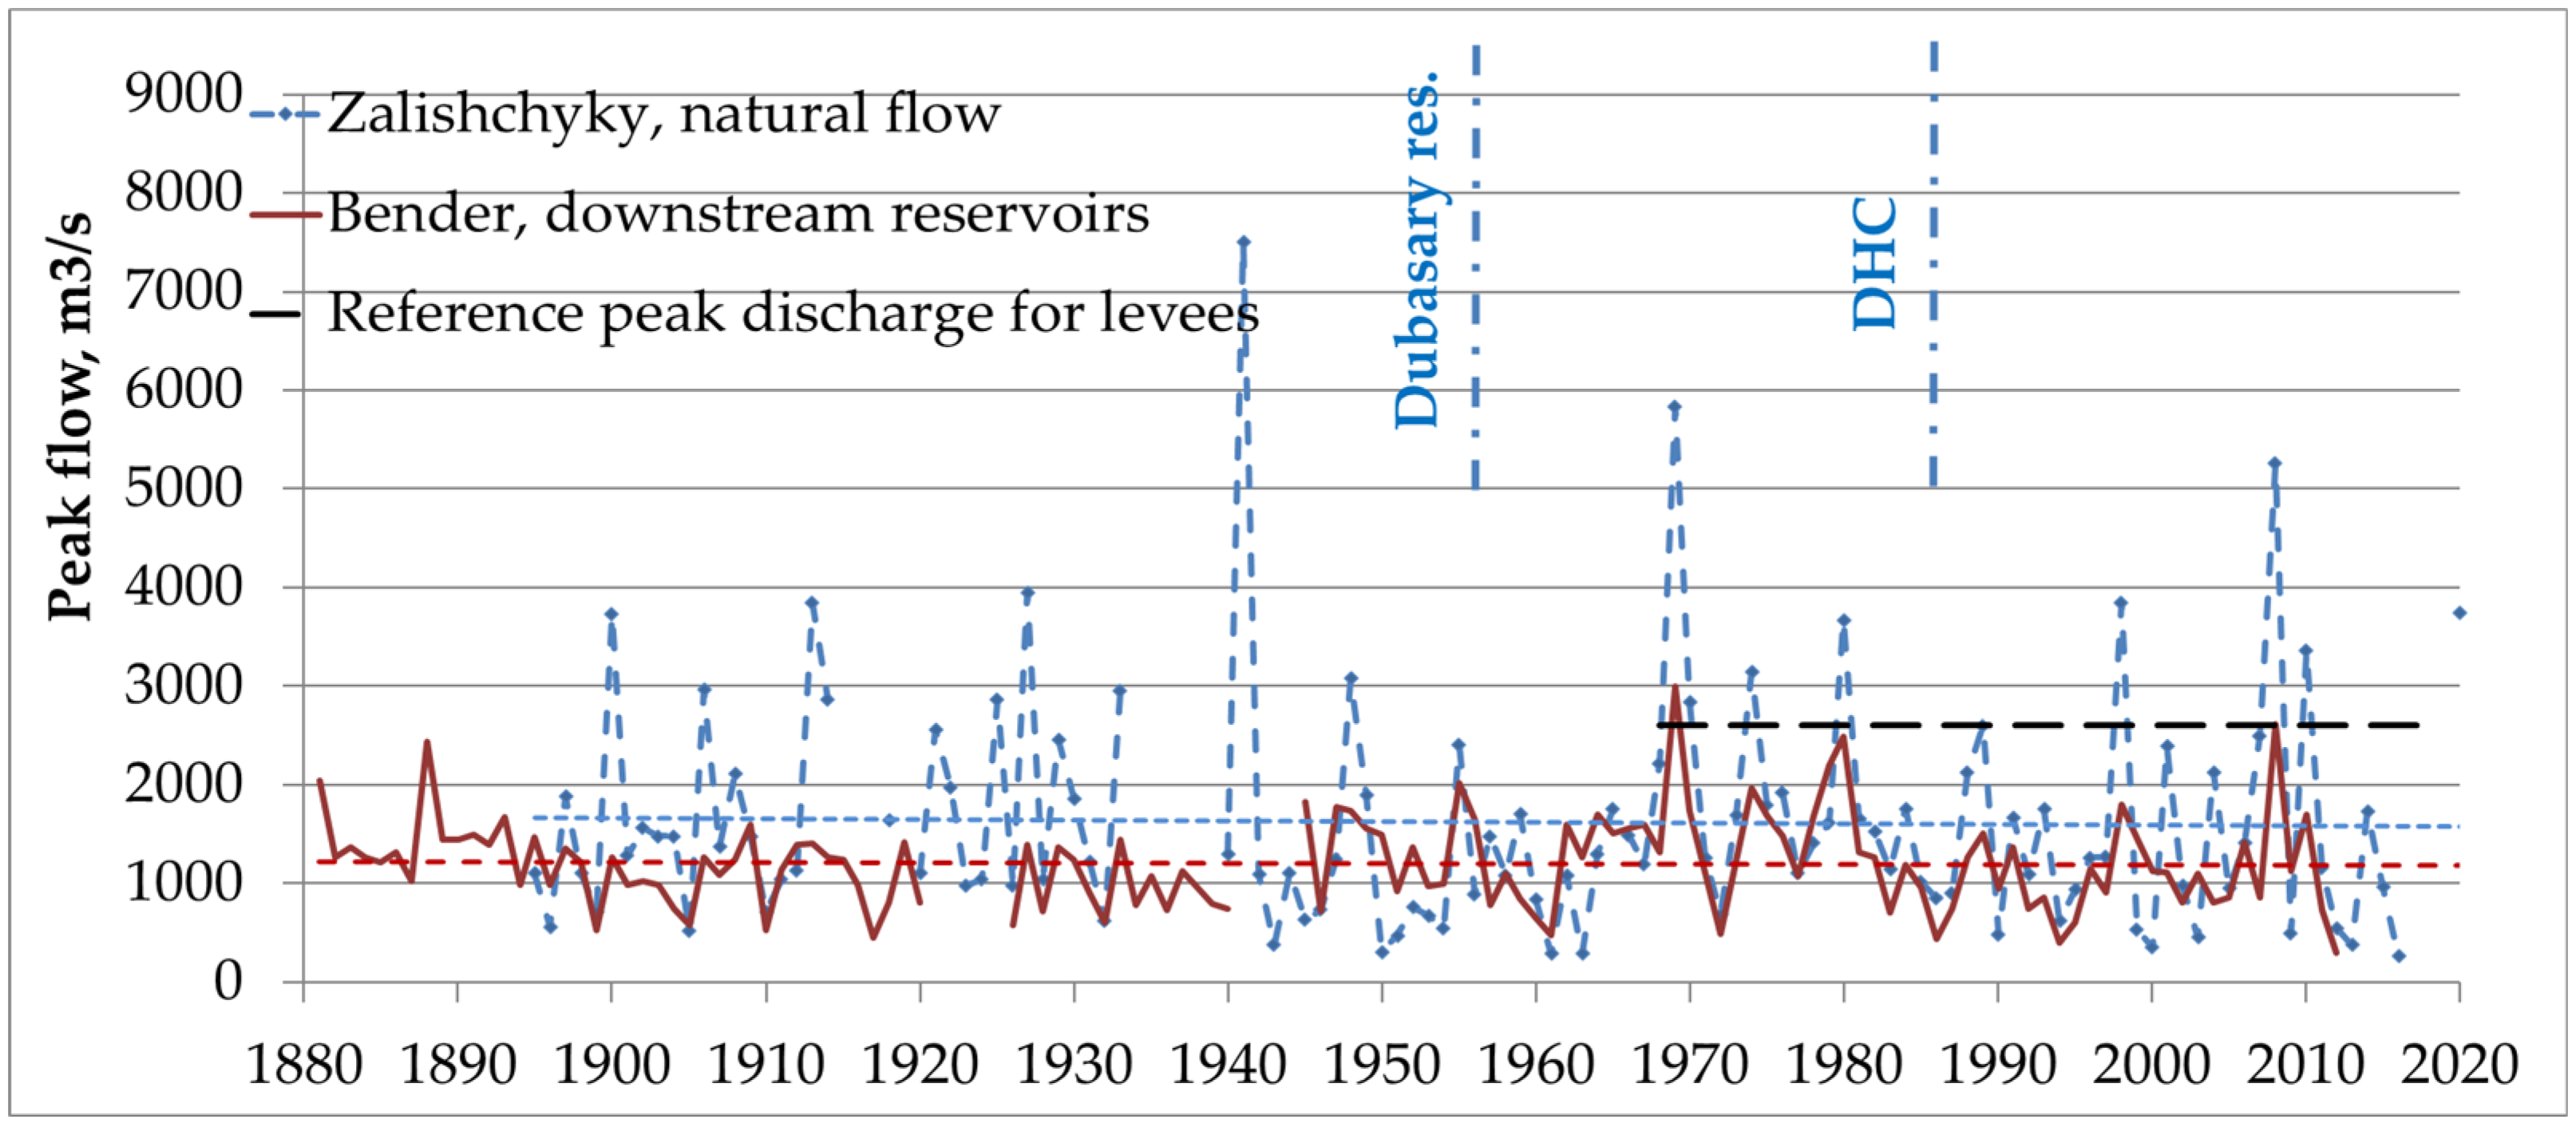
4.1. Dynamics in Flood Characteristics

Long time series on flow for the time before dam construction was present only for Zalishchyky and Bender. These stations are also representative for the estimation of reservoirs impact on flood, due to the fact that the first one is situated upstream and the second downstream of hydrotechnical constructions. For three time periods, the average flow peaks are 1781 m3/s, 1609 m3/s, 1558 m3/s at Zalishchyky and 1172 m3/s, 1024 m3/s, 882 m3/s at Bender. Spatially, from the upper to lower part of the river, the maximum flow is reduced by 609 m3/s, 585 m3/s, and 687 m3/s, flow change being large in the last period (Figure 1). Floods duration is 13–16 days at Zalischyky and 17–20 days at Bender, with not much differences between the three periods. A certain impact of reservoirs is observed on rising and recession limbs of hydrographs. Thus, rising limb average duration at Zalischyky is 4 days for all periods. In the downstream of DHC, Grushka, the number of days increased from 4 days in the second period to 6–7 days in the third one; however, at Bender the number of days is 7 for all times. Flood wave recession limb is maintained within 11–12 days in the upper part of the DHC, while downstream of the DHC, it has a slight decreasing tendency, at Grushka, from 14 in natural regime to 11 days in regulated regime, but at Bender the number of days is stable as 12.

4.2. Peak Discharge Attenuation Coefficient Changes

The Dniester river floods propagation processes have changed in time and space due to certain modifications in the river bed and floodplain. During the time period that corresponds to natural flow, flood dynamics were distributed in the natural floodplain and reduction in the peaks was influenced by floodplain width and increasing basin area. In the second and, especially, the third time periods, hydrotechnical structures (reservoirs and levees) constructed in the river floodplain influenced river flood propagation by decreasing the peaks, redistribution of volumes under reservoirs impact, and decreasing flooding area due to levee system. For evaluation of flood dynamics under different river bed conditions, peak discharge attenuation coefficient (K) was estimated. It was calculated as the ratio between peaks from Zalishchyky and Bender station. Thus, this coefficient for natural runoff period is about 0.40, being relatively constant. The peaks of the flood of 1900, 1906, 1913, 1948 at Zalishchyky were at about 3000–4100 m3/s, at Bender station reduction being to 1300–1700 m3/s. K ranged from 0.34 to 0.51.
Operation of Dubasary dam influenced the Dniester flood wave dynamics in a certain way. Analyzing the hydrographs of flood events of 1969, 1970, 1974, 1980, a change in the shape was observed. In the upper part, the shape is classical triangular, while in the downstream part it is already trapezoid. The peaks of the mentioned floods were measured to the values of about 3000–6000 m3/s at Zalishchyky and about 1700–3000 m3/s at Bender. The K for this time period varied from 0.5 to 0.6, the average being 0.58. Dubasary reservoir is a relatively small one, and intensive siltation processes decrease its flood protection capacity. The flood regulation storage decreased from 630 mln.m3 (in 1956) to 401 mln.m3 (in 1982) [2,11], and in these conditions, large floods would flow in transit through it, the reduction capacity being estimated only to 15%.
In conditions of the whole flood protection system functioning, including DHC and levees caused a better flood management. The peaks of larger floods that occurred in 1989, 1998, 2008, 2010 were in the limits of 2700 m3/s (1989, 2010) and 4000–5600 m3/s (1998, 2010) at Zalishchyky, while at Bender their values decreased to 1500–2600 m3/s. Estimated K ranges from 0.44 to 0.62 and average value is about 0.52, which is smaller in comparison to the second period but higher than the one in the first period.
As a result of evaluation of peak discharge attenuation coefficient, it was observed that in natural condition, flood peak attenuation was higher in comparison with actual situation. However, the need of lands for agriculture and settlements development caused construction of flood protection system that led to a decrease in the flood prone areas as well as capacity to reduce the peaks. Furthermore, an effective flood protection is the result of a complex of measures, including DHC, levees, forecast, integrated flood management.

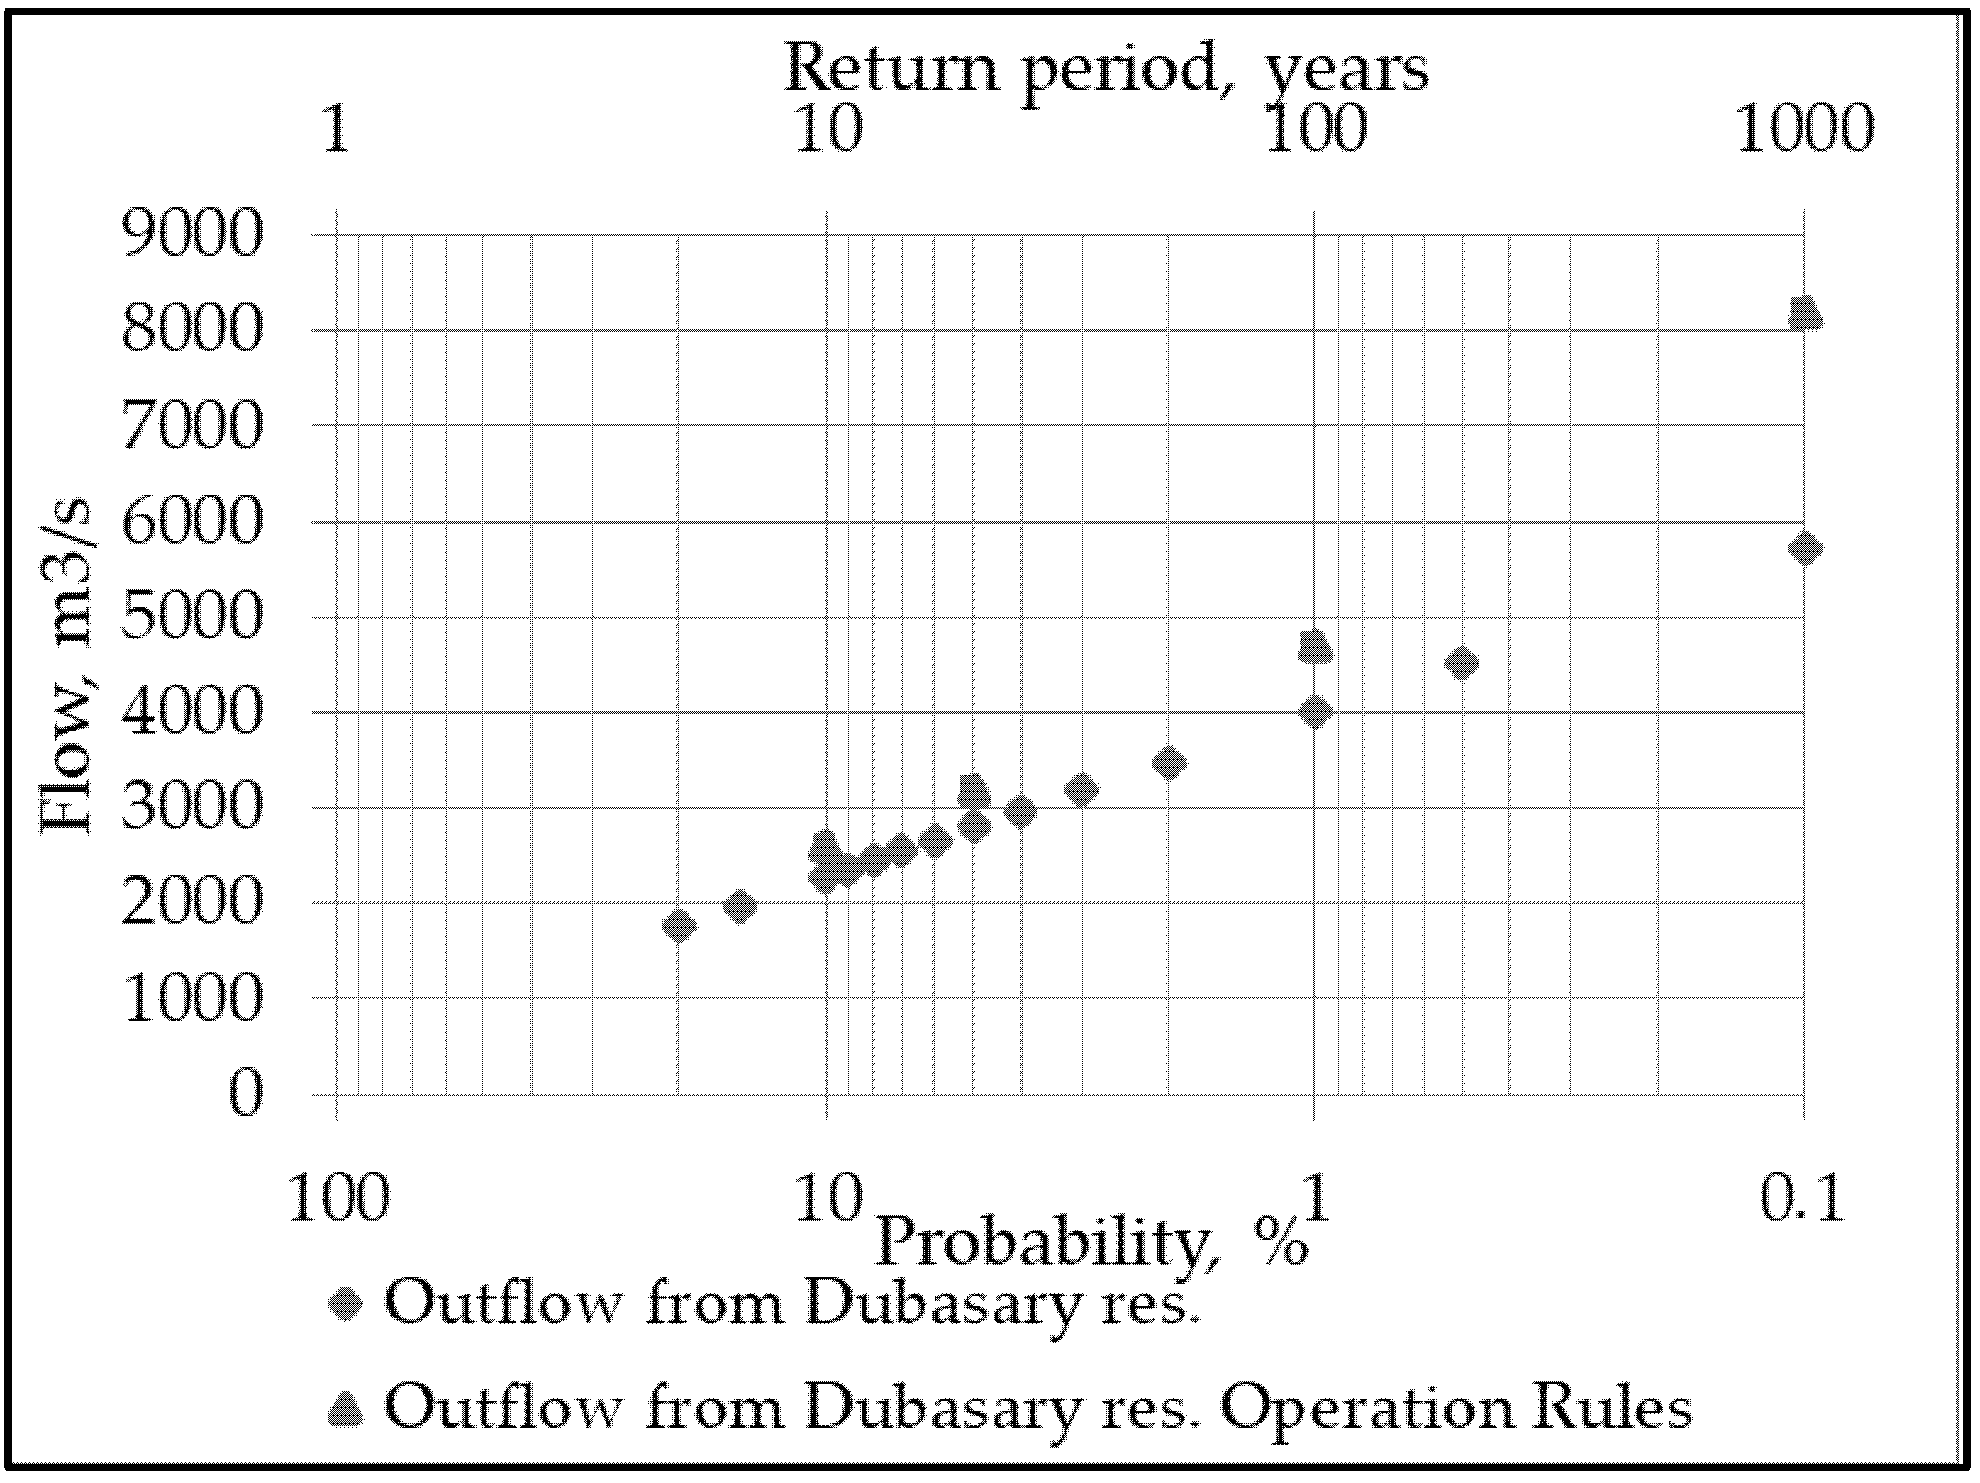
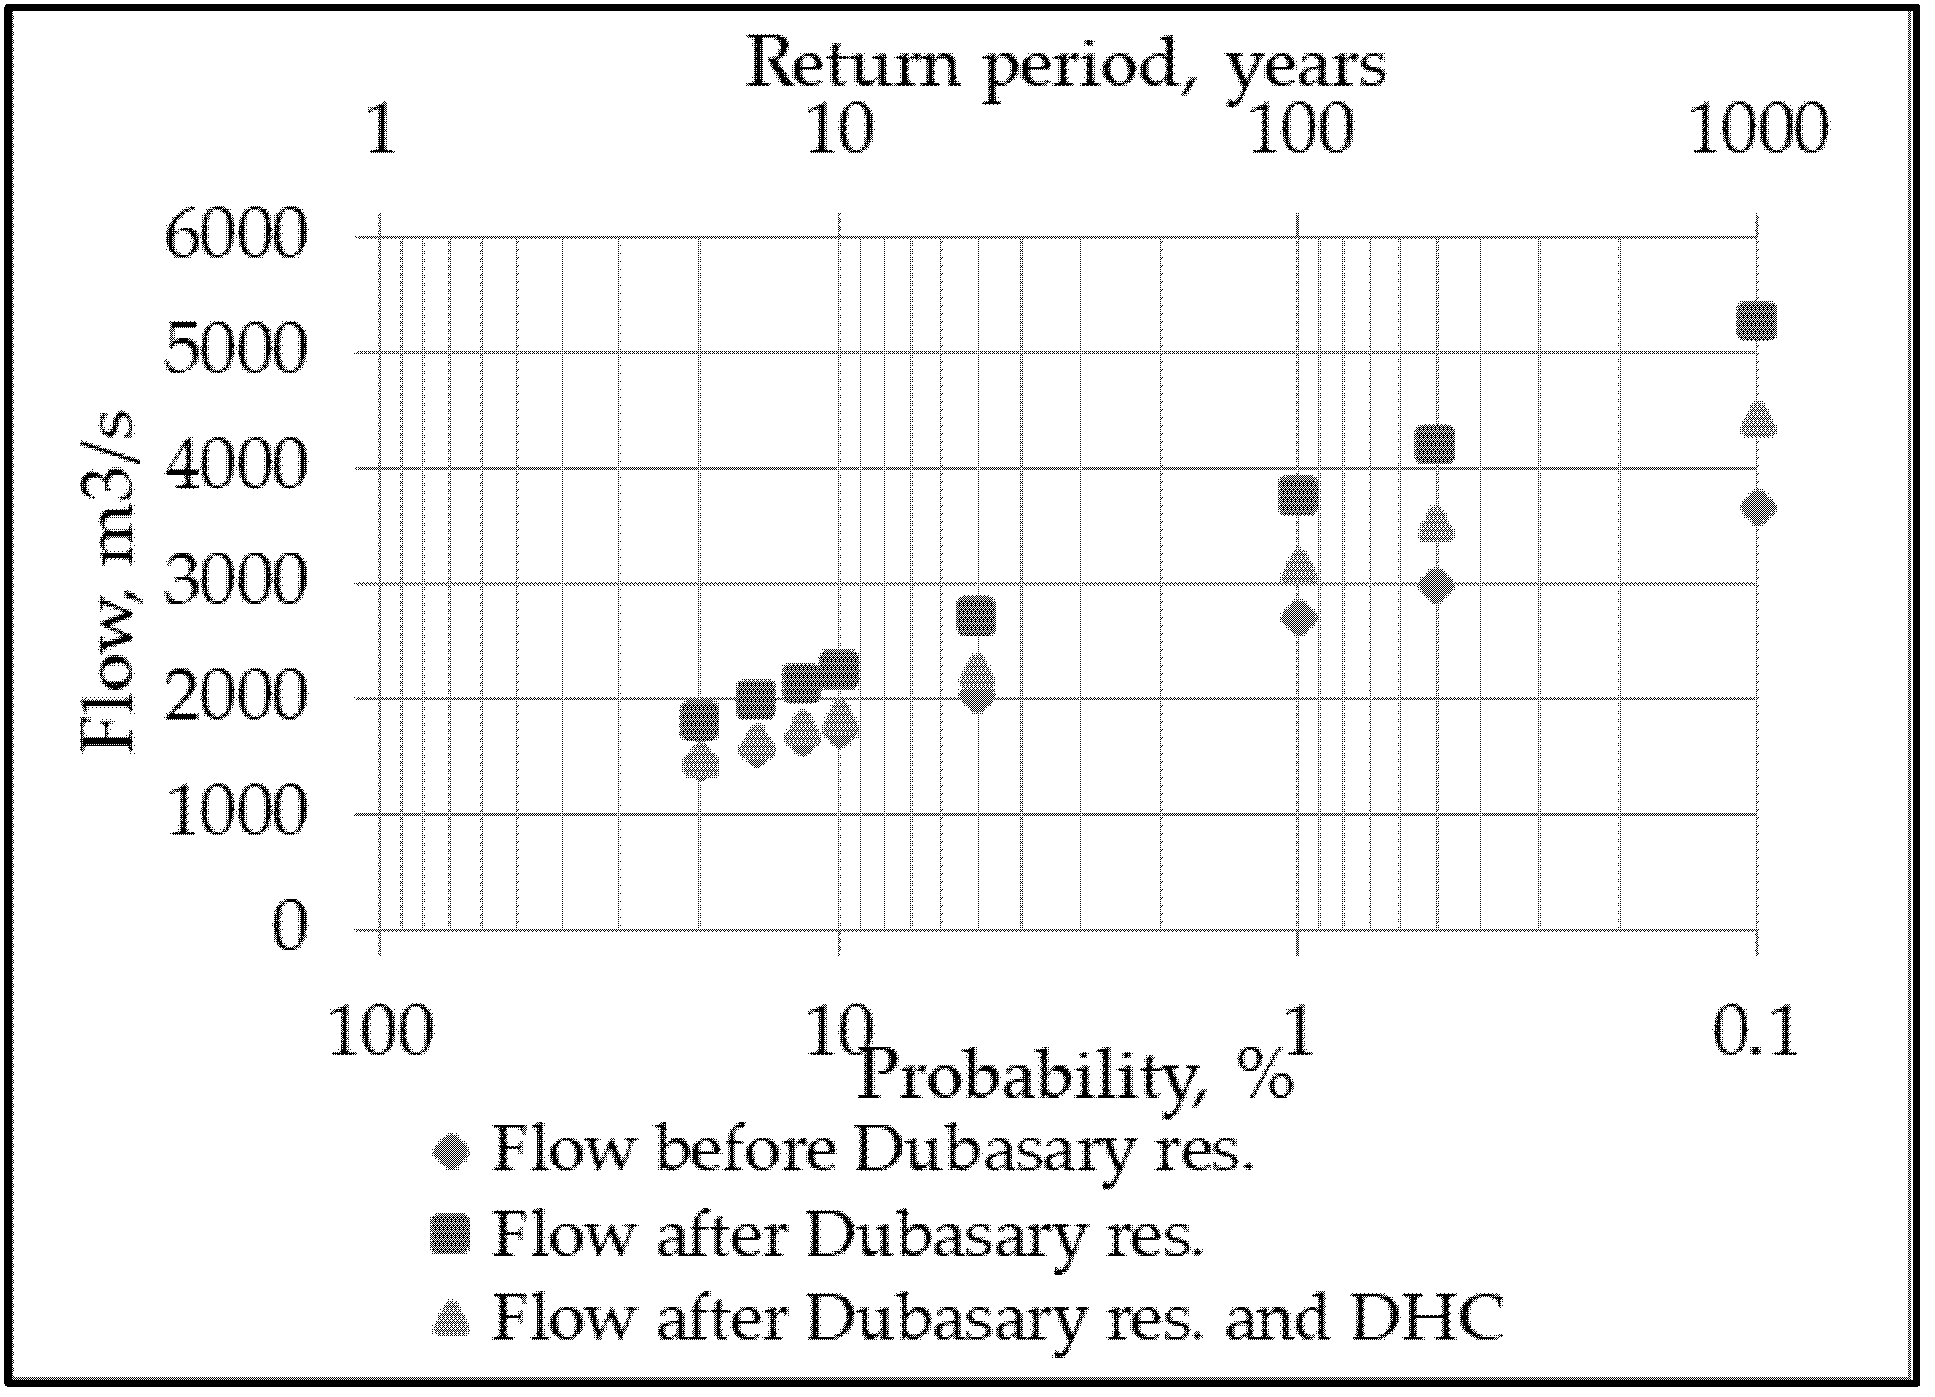
4.3. Changes in Statistical Parameters

Reservoir impact on flood flow was estimated through calculation and comparison of statistical parameters of hydrological time series measured at different river stations. The impact of the DHC was evaluated on the basis of analysis of the time series of the pluvial flood peak discharges from Hrushca (time series presented only for second and third time periods) as well as their probability distribution for the periods before and after construction of DHC (Figure 2). It was estimated that the average peak discharge for the third period is 552 m3/s lower than for the second one, and the peak discharge of 0.1–20% probability decreases with 905–3586 m3/s (35–41%). Coefficient of variation (Cv) changes insignificantly from 0.54 to 0.48. The comparative analysis of the discharges of 1–10%, estimated on the basis of the dataset from the Dubasary reservoir, and probable peak discharge from its Operation Rules [11] indicate that the estimated probable peak discharge for the operation period is smaller with approx. 320–700 m3/s (Figure 3), thus the reservoir having a lower effect in regulating the maximum runoff (12–15%) [1].
As a result of the analysis of the time series from Bender st., it was determined that the average values of peak discharges are lower for the period of the entire flood protection system operation. Cv is 0.34, 0.43, and 0.44 for the three periods. However, the probability distribution shows an increase in the peak discharges of low and medium probability (0.1–10%) with ~22–44% in the second period, and with 1–21% in the third period, in comparison to those of the first period (Figure 4). The increase in extreme values can be explained by the fact that flood wave flowing in conditions of anthropogenic impact propagates through a narrower floodplain, limited by the levees, which determines the increase in both the discharges and levels, and also by the flood control by the Dubasary reservoir, and by occurrence of extreme synoptic situations that favored the generation of more significant floods during the second and third periods compared to the first one.
The flood protection system reduces the probable peak discharges of 10–20% by 1–6%. It has a greater effect on regulating the flood runoff with the probability of up to 10%, especially during the period after the DHC construction. Thus, this hydropower complex has a more significant positive influence on the regulation of the flood runoff compared to the Dubasary reservoir [1].

4.4. Environmental Flow Components

Assessment of reservoirs impact on the Dniester floods was also performed by analyzing the characteristics of the environment flow components: high-flow pulses, small floods, large floods. Large floods, with peak discharges exceeding 2600 m3/s (reference peak flow indicated in DHC rules [12], as well as for levee system) at Hrushca st. were recorded in 1969, 1974, 1980 before the DHC and in 2008 after beginning of its operation (Figure 1). Small floods (with peak discharges exceeding 1200 m3/s—the multiannual average of peaks for entire monitoring period at Bender) are bigger in number. For the years 1945–1955 (before the Dubasary reservoir construction), at Zalishchyky and Bender on average one case of small floods in 2 years was recorded. In the period after the beginning of reservoir operation, the average number of these events was 1.4 event/year at Zalishchyky, 1.5 event/year at Hrushca, 0.8 event/year at Bender st. in the second period and 1 event/year at Zalishchyky, and 0.4 event/year for both stations in the downstream in the third period. During the Dubasary dam operation, in the upstream (at Hrushca), three small floods were registered in 1968, 1976, 1978, 1980, 1981; in the downstream (at Bender), the same number was recorded only in 1968; and in the other mentioned years their number decreasing to 1–2 events. In the years after the DHC construction, at Zalishchyky, three small floods were registered in 1991, 2001, 2005; five cases in 1998; and in the downstream not more than two small floods/year were recorded, but the number of years without small floods increased (Figure 5). The average value of small floods peak discharges (Figure 6) was 1584 m3/s at Zalishchyky and 1692 m3/s at Bender for the years 1945–1955; 1596 m3/s at Zalishchyky, 1670 m3/s at Hrushca, and reduced to 1600 m3/s at Bender st. (downstream from the Dubasari dam) for the period of only the Dubasari res. operation; and 1662 m3/s at Zalishchyky, 1451 m3/s at Hrushca, and 1634 m3/s at Bender for the period after the entire flood protection system construction. On an average, small floods duration was for the Dubasary dam operation period—10 days at Zalishchyky, 25.4 days at Hrushca, and 65 days at Bender; and for the period after DHC construction—15 days at Zalishchyky, 23 days at Hrushca, and 47 days at Bender [1].
Annual frequency of high-flow pulses of ±30% (cases with peak discharges between 310/470 and 1200 m3/s) for the 1945–1955 is characterized by values between 2 and 10 events/year (on average 6.3 events/year) with an average discharge of 578 m3/s at Zalishchyky and values between 2 and 9 events/year (on average 3.2 events/year) with an average discharge of 664 m3/s at Bender. Thus, in natural regime, a decrease in the number of high-flow pulses is observed for the sector from Zalishchyky to Bender; the reduction being 2–5 times. In the years following the Dubasary dam operation, the average frequency of high-flow pulses is 8.5 event/year at Zalishchyky, 7.8 events/year at Hrushca, and only 2.8 events/year at Bender; the decrease in the number of these events under reservoir impact being even with 8–10 events. In this respect, examples can serve the years 1972 and 1977 when at Hruscha 11 and at Bender only 2–3 high-flow pulses were registered. A different situation is specific for the DHC post-construction period. The number of high-flow pulses is 7 events/year at Zalishchyky but at Hrushca it has increased to 11. In 1997–2000, at Zalishchyky, the number of events was 5–14 while at Hrushca, it increased considerably up to 19–24. Thus, in some years, the number of high-flow pulses has doubled (1989, 1996, 2009, 2014) or even tripled (1991, 1998, 1999, 2000, 2013) at the DHC downstream station in comparison to its upstream station. In the same years at Bender the number of these events is already 3–9, i.e., 2–8 times less. The average peak discharges of high-flow pulses are 534 m3/s at Zalishchyky, 530 m3/s at Hrushca, and 674 m3/s at Bender during the Dubasary res. operation and 557 m3/s at Zalishchyky, 496 m3/s at Hrushca, and 632 m3/s at Bender after the DHC construction. Their duration is approximately the same: at Zalishchyky—3.8 days for the first and second period and 4.5 days for the third one; at Hrushca—4.5 days for all periods; and at Bender–14.5, 23.8, and 15 days for all periods.

5. Conclusions

Evaluation of the effect of reservoir cascade on flood dynamics of the Dniester river shows that high flood protection is specific to DHC, while through the Dubasary reservoir the flood wave passes mainly in transit. The flood protection system has a greater effect in regulating the floods with medium probability, especially after the DHC construction. The reservoirs caused a slight increase in the coefficient of attenuation of peak discharges from 0.30 to 0.40 (in natural conditions) to 0.50–0.60 (in regulated flow conditions). Due to the flow regulating impact, small floods, their average peaks and duration were reduced in the reservoir downstream part. High-flow pulses increased in number after DHC construction due to hydropeaking effect; however, their reduction is observed in the downstream of Dubasary reservoirs. At present, large floods increase in number in the upper part but are transformed into small floods in the downstream, thus protecting the region from inundation. The increasing frequency and occurrence of floods in the Dniester river basin require improved flood management strategies both in Ukraine and the Republic of Moldova.

Funding

This research received no external funding.

Institutional Review Board Statement

Not applicable.

Informed Consent Statement

Not applicable.

Data Availability Statement

Not applicable.

Conflicts of Interest

The author declares no conflict of interest.

References

  1. Jeleapov, A. Assessment of the Anthropogenic Impact on the Pluvial Floods of the Rivers of the Republic of Moldova. Ph.D. Thesis, Institute of Ecology and Geografy of the ASM, Chisinau, Moldova, 2019; p. 241. Available online: https://ieg.asm.md/sites/default/files/TEZAAJ_finENWeb.pdf (accessed on 20 January 2023).
  2. Jeleapov, A. The Study on Pluvial Floods in the Context of Human Impact on Environment; Tipogr. Impressum: Chișinău, Moldova, 2020; p. 254. (In Romanian) [Google Scholar]
  3. Jeleapov, A.; Melniciuc, O.; Bejan, I. Assessment of flood risk areas in the Dniester River basin (in the limits of the Republic of Moldova). In Management of Water Quality in Moldova; Duca, G., Ed.; Springer International Publishing: Cham, Switzerland, 2014; pp. 157–173. [Google Scholar]
  4. Jeleapov, A. Assessment of the impact of the Dniester Hydropower Complex on hydrological state of the Dniester River. Cent. Eur. J. Geogr. Sustain. Dev. 2022, 4, 24–49. [Google Scholar] [CrossRef]
  5. Regulations to Operate Water Reservoirs of the HPP and PSPP Dniester Cascade with Buffer Storage Reservoir Normal Headwater Level 77.10 m. Draft UKRGIDROENERGO. 2017. Available online: https://bit.ly/3U515GU (accessed on 12 September 2022).
  6. Peñas, F.J.; Barquín, J.; Álvarez, C. Assessing hydrologic alteration: Evaluation of different alternatives according to data availability. Ecol. Indic. 2016, 60, 470–482. [Google Scholar] [CrossRef]
  7. Richter, B.; Baumgartner, J.; Powell, J.; Braun, D. A method for assessing hydrologic alteration within ecosystems. Conserv. Biol. 1996, 10, 1163–1174. [Google Scholar] [CrossRef]
  8. Richter, B.; Baumgartner, J.; Robert, W.; Braun, D. How much water does a river need? Freshw. Biol. 1997, 37, 231–249. [Google Scholar] [CrossRef]
  9. The Nature Conservancy. Indicators of Hydrologic Alteration Version 7.1 User’s Manual. 2009. Available online: https://www.conservationgateway.org/Documents/IHAV7.pdf (accessed on 12 September 2021).
  10. Hydrological Database of the State Hydrometeorological Service of Moldova and Ukraine 2020.
  11. Operation Rules of the Dubasari Reservoir; Moldovan National Institute of Water Management Design: Chisinau, Moldova, 1983. (In Russian)
  12. Operation Rules of the Reservoirs of the DHC. 2022. 38 c. Available online: https://bit.ly/3RUkhFI (accessed on 12 September 2022). (In Russian).
Figure 1. Flood peaks.
Environsciproc 25 00092 g001
Figure 2. Distribution of peaks of different probabilities, Hrushca st.
Environsciproc 25 00092 g002
Figure 3. Distribution of peaks of different probabilities, Dubasary st.
Environsciproc 25 00092 g003
Figure 4. Distribution of peaks of different probabilities, Bender st.
Environsciproc 25 00092 g004
Figure 5. Number of cases of small floods and high flow pulses.
Environsciproc 25 00092 g005
Figure 6. Average peak discharge of small floods and high flow pulses.
Environsciproc 25 00092 g006
Disclaimer/Publisher’s Note: The statements, opinions and data contained in all publications are solely those of the individual author(s) and contributor(s) and not of MDPI and/or the editor(s). MDPI and/or the editor(s) disclaim responsibility for any injury to people or property resulting from any ideas, methods, instructions or products referred to in the content.

