Proceeding Paper

Application of EPANET 2.2 Software and Jal-Tantra Web System for Optimal Hydraulic Design of Water Distribution System for University of Kashmir †

1
Demonstrator Civil Engineering, Kashmir Government Polytechnic, Srinagar 190008, India
2
M-TECH (Water Resources Engineering), National Institute of Technology, Srinagar 190006, India
3
Department of Civil Engineering, National Institute of Technology, Srinagar 190006, India
*
Author to whom correspondence should be addressed.
Presented at the 7th International Electronic Conference on Water Sciences, 15–30 March 2023; Available online: https://ecws-7.sciforum.net/.
Environ. Sci. Proc. 2023, 25(1), 83; https://doi.org/10.3390/ECWS-7-14234
Published: 16 March 2023
(This article belongs to the Proceedings of The 7th International Electronic Conference on Water Sciences)

Abstract

:
The availability of portable water in sufficient quantity and standard quality is one of the basic requirements of a civilization. The study area of this present work is the University of Kashmir, where the existing WDS has served its function for more than 60 years. The UOK is a growing campus, and the existing WDS is unable to meet the demands of a growing population and suffers from excessive leakage losses and an insufficient pressure head at the nodes. In this work, we attempt to replace the existing WDS with an optimally designed WDS for the University of Kashmir so that the objective functions of maximum efficiency of performance and minimum capital cost in terms of pipe diameters are met. From the literature available, EPANET has been found to perform the hydraulic and water quality modelling with a fair degree of accuracy, ease of use, and no cost. Therefore, for our hydraulic analysis, EPANET 2.2 (Environmental Protection Agency, Washington, DC, USA) was used. To augment the assessment of the efficiency of the performance of the WDS, the TPIs (technical performance indices) for pressure and velocity at the hour of peak demand were evaluated. Finally, the cost-optimality of the network in terms of the pipe diameters was validated by using the Jal-Tantra web system developed by IIT Bombay.

1. Introduction

A well-designed, efficiently-performing WDS is a prerequisite for both urban and rural civilizations. Various software packages are available for modelling a WDS. The public domain software that is available free of charge include EPANET, Pipes and Loops, Branch, etc., and the paid ones available includes WaterCAD, Watergems, Synergy Water, etc. [1]. The paid versions are found to be more efficient in reference to functionality and compatibility with different computational systems, a graphical user interface, and searching and optimizing algorithms [2]. However, EPANET is freely available software that offers a fair degree of accuracy and ease of use when cost is a constraint [3]. EPANET 2.0 was used by various researchers to design the WDS for different areas [4,5]. The design includes the layout of the WDS, modelling the pressure head at nodes, and the velocity of flow in the links. However, no consideration was given to maximisation of the efficiency of performance or minimisation of the capital cost of the network.
The design of a WDS by EPANET must be such that it serves as an “optimal” solution, which can be obtained by setting out objective functions of maximum efficiency of performance and minimum capital cost of the network [6,7]. The decision variables and the constraints for the optimality of the network design have to be decided after conducting a study of the factors affecting the optimality of the design and consulting various codes and manuals laying down the standard range of values for those parameters [8,9]. The decision variables for optimal hydraulic design include the pressure head at nodes, the velocity of flow in the links, and the staging height of the storage tank. The check for cost optimality of the network formulated by EPANET can be conducted using the Jal-Tantra web system [10,11]. The optimality of the network can be further checked by carrying out a performance analysis using various indices [12,13,14].
The objective of this current study is to provide an optimally designed WDS for the University of Kashmir using EPANET 2.0 software and the Jal-Tantra web system. The existing distribution system has already served for more than 60 years and is unable to meet the requirements of the growing population of the campus. Moreover, the worn-out links and other components of the network lead to increased pipe and joint losses, reducing the efficiency of the existing distribution system. Therefore, there is an immediate need to redesign the water distribution network such that the design is an optimal solution meeting the objective functions of maximum efficiency of performance and minimum capital cost of the network, rather than just a simulation of the pressure head and velocity of flow.

2. Methodology

2.1. Study Area Description

The study area for our current work is at the University of Kashmir, located in Hazratbal, Srinagar, Jammu and Kashmir, India. It is a residential campus comprising academic blocks, administrative blocks, hostels, a medical unit, a cafeteria, and staff quarters. It has a residential and floating population of 5324 and 1050, respectively, for the Naseem Bagh Campus and 8066 and 1720, respectively, for the Hazratbal Campus.

2.2. Methodological Approach

A quantitative research approach was employed to arrive at the optimal design of the WDS for the University of Kashmir by using various software. A literature review related to the work was carried out, and the related standard books and codes were consulted. A preliminary survey of the study area was followed by a division of the study area into two parts, with separate WDNs for each of them (the Hazratbal campus and the Naseem Bagh campus). The water source for the networks is the groundwater reserve within the campus, which is pumped by intermittently operating pumps into the overhead water tanks.

2.3. Methods of Data Collection

The quantitative data of the existing population at various academic blocks, hostels, family quarters, and administrative blocks was obtained. The maximum depth of water in the bore wells below ground level is 10 m. In addition, the campus plan of the study area was obtained. The data availability was facilitated by the engineering wing of the UOK. Elevation data was obtained using Google Earth Pro.

2.4. Methods of Analysis

2.4.1. Evaluation of the EPANET 2.2 Input Parameters

A dead-end type of distribution system was provided for both parts of the campus. The population forecast for the design period of 30 years, with a constant increase of 5% per decade in both residential as well as the floating population was carried out [15,16]. The values of ADD for both parts of the network were evaluated using water demand as 135 lpcd for the residential population and 45 lpcd for the floating population [17]. The MDD was evaluated using a peak factor of ‘1.8’ [18], and a peak factor of ‘3’ was used to calculate the MHD from the AHD [18]. Provisions to meet the fire demand were kept as per Indian standards [19]. The base demand multiplier equals the coincident draft in litres per person per minute (Table 1). Two different demand patterns were used for the network nodes: one for the hostels and quarters (p1), and the other for academic buildings and administrative blocks (p2). The capacity of the storage tank was evaluated by the mass curve analysis for both parts of the network. The discharge to be provided by the pump was worked out by considering 12 h of pumping per day. The staging height of the tank above ground level was selected after iterations to successfully run the software and achieve standard pressure heads at the nodes. The economical diameter of the rising main was obtained using Dupit’s expression. The pressure head developed by the pump has to be equal to the sum of the delivery head, suction head, and frictional head loss in the rising main. The input power required to run the pump equals (ωQH/n), and the efficiency of the pump (n) was taken as 75%. Energy required for a 12-hour per-day operation of the pump was evaluated to arrive at the cost of the electrical energy at Rs 5 per unit per day. The design flow rate of the pump was equal to the MHD in litres per minute (Table 2). After entering the EPANET 2.2 input data [20] and successfully running the software, a hydraulic modeling of the networks was carried out. Simple controls (obtained after iterations to successfully run the software and achieve standard pressure heads at the nodes), as given in Table 3, were used to perform the hydraulic analysis.

2.4.2. Evaluation of the Technical Performance Indices (TPIs)

The behavior of the nodes and pipes of the WDS can be evaluated using the TPIs (technical performance indices), which are indicative of the performance of the network with respect to the hydraulic parameters such as pressure head and flow. Two types of TPIs are used: TPI pressure [14] and TPI velocity [14]. The TPI values range from 0 to 1, ‘0’ for poor service, and ‘1’ for efficient service. The TPI values for both parts of the network were evaluated and compared with the standard values as follows:
TPI pressure = Σ (Qi × TPIi)/Σ Qi,
where Qi = nodal demand and (i) iterates over all the nodes of the network.
TPI i = 0 ,     P i < P min = 1 ,     P min < P i < P ma = 1 { ( P i P max ) / ( P max P min ) } ,    P max < P i < 100 = 0 ,      P i > 100
Here, Pi = prevailing pressure head at the node, Pmin = 17 m, Pmax = 70 m, and TPIi = TPI. For the node i:
TPI velocity = Σ(Qj × TPIj)/ΣQj,
where Qj = flow in pipe (j), and (j) iterates over all the pipes of the network.
TPI j = 0 ,      V i < V min = ( V i V min ) / ( V mean V min ) ,     V min < V i < V mean = ( V i V max ) / ( V mean V max ) ,     V mean < V i < V max = 0 ,       V i > V max
Here, Vi = prevailing flow velocity in pipe j, Vmin = 0.2 m/s, Vmax = 3 m/s, and TPIj = TPI for the pipe j, Vmean = (Vmin + Vmax)/2.

2.4.3. Input Parameters for the Jal-Tantra Web System

The input data for nodes (elevations, base demand, and minimum pressures) and pipes (start nodes, end nodes, length, and roughness) is entered into the Jal-Tantra system. Commercially available pipe diameters and their cost per unit length according to the prevailing market rates are also provided. The input data is given in Table 4 and Table 5.

2.4.4. Optimization of the Hydraulic Model

Objective functions:
The first objective function is the maximization of the performance efficiency of the proposed WDS in terms of the hydraulics. The second objective function is the minimization of the capital cost of the network in terms of the pipe diameters and valves.
Decision variables:
The decision variables are as follows:
  • Pi = prevailing pressure head at the node.
  • Vi = prevailing flow velocity in the pipe.
  • H = staging height of the storage reservoir.
Constrains:
  • 17 ≤ Pi ≤ 70 (m) [18].
  • 0.25 ≤ Vi ≤ 3.0 (m/s) [18].
  • H = 30 m (obtained after iterations to achieve standard values of hydraulic parameters)

3. Results and Discussions

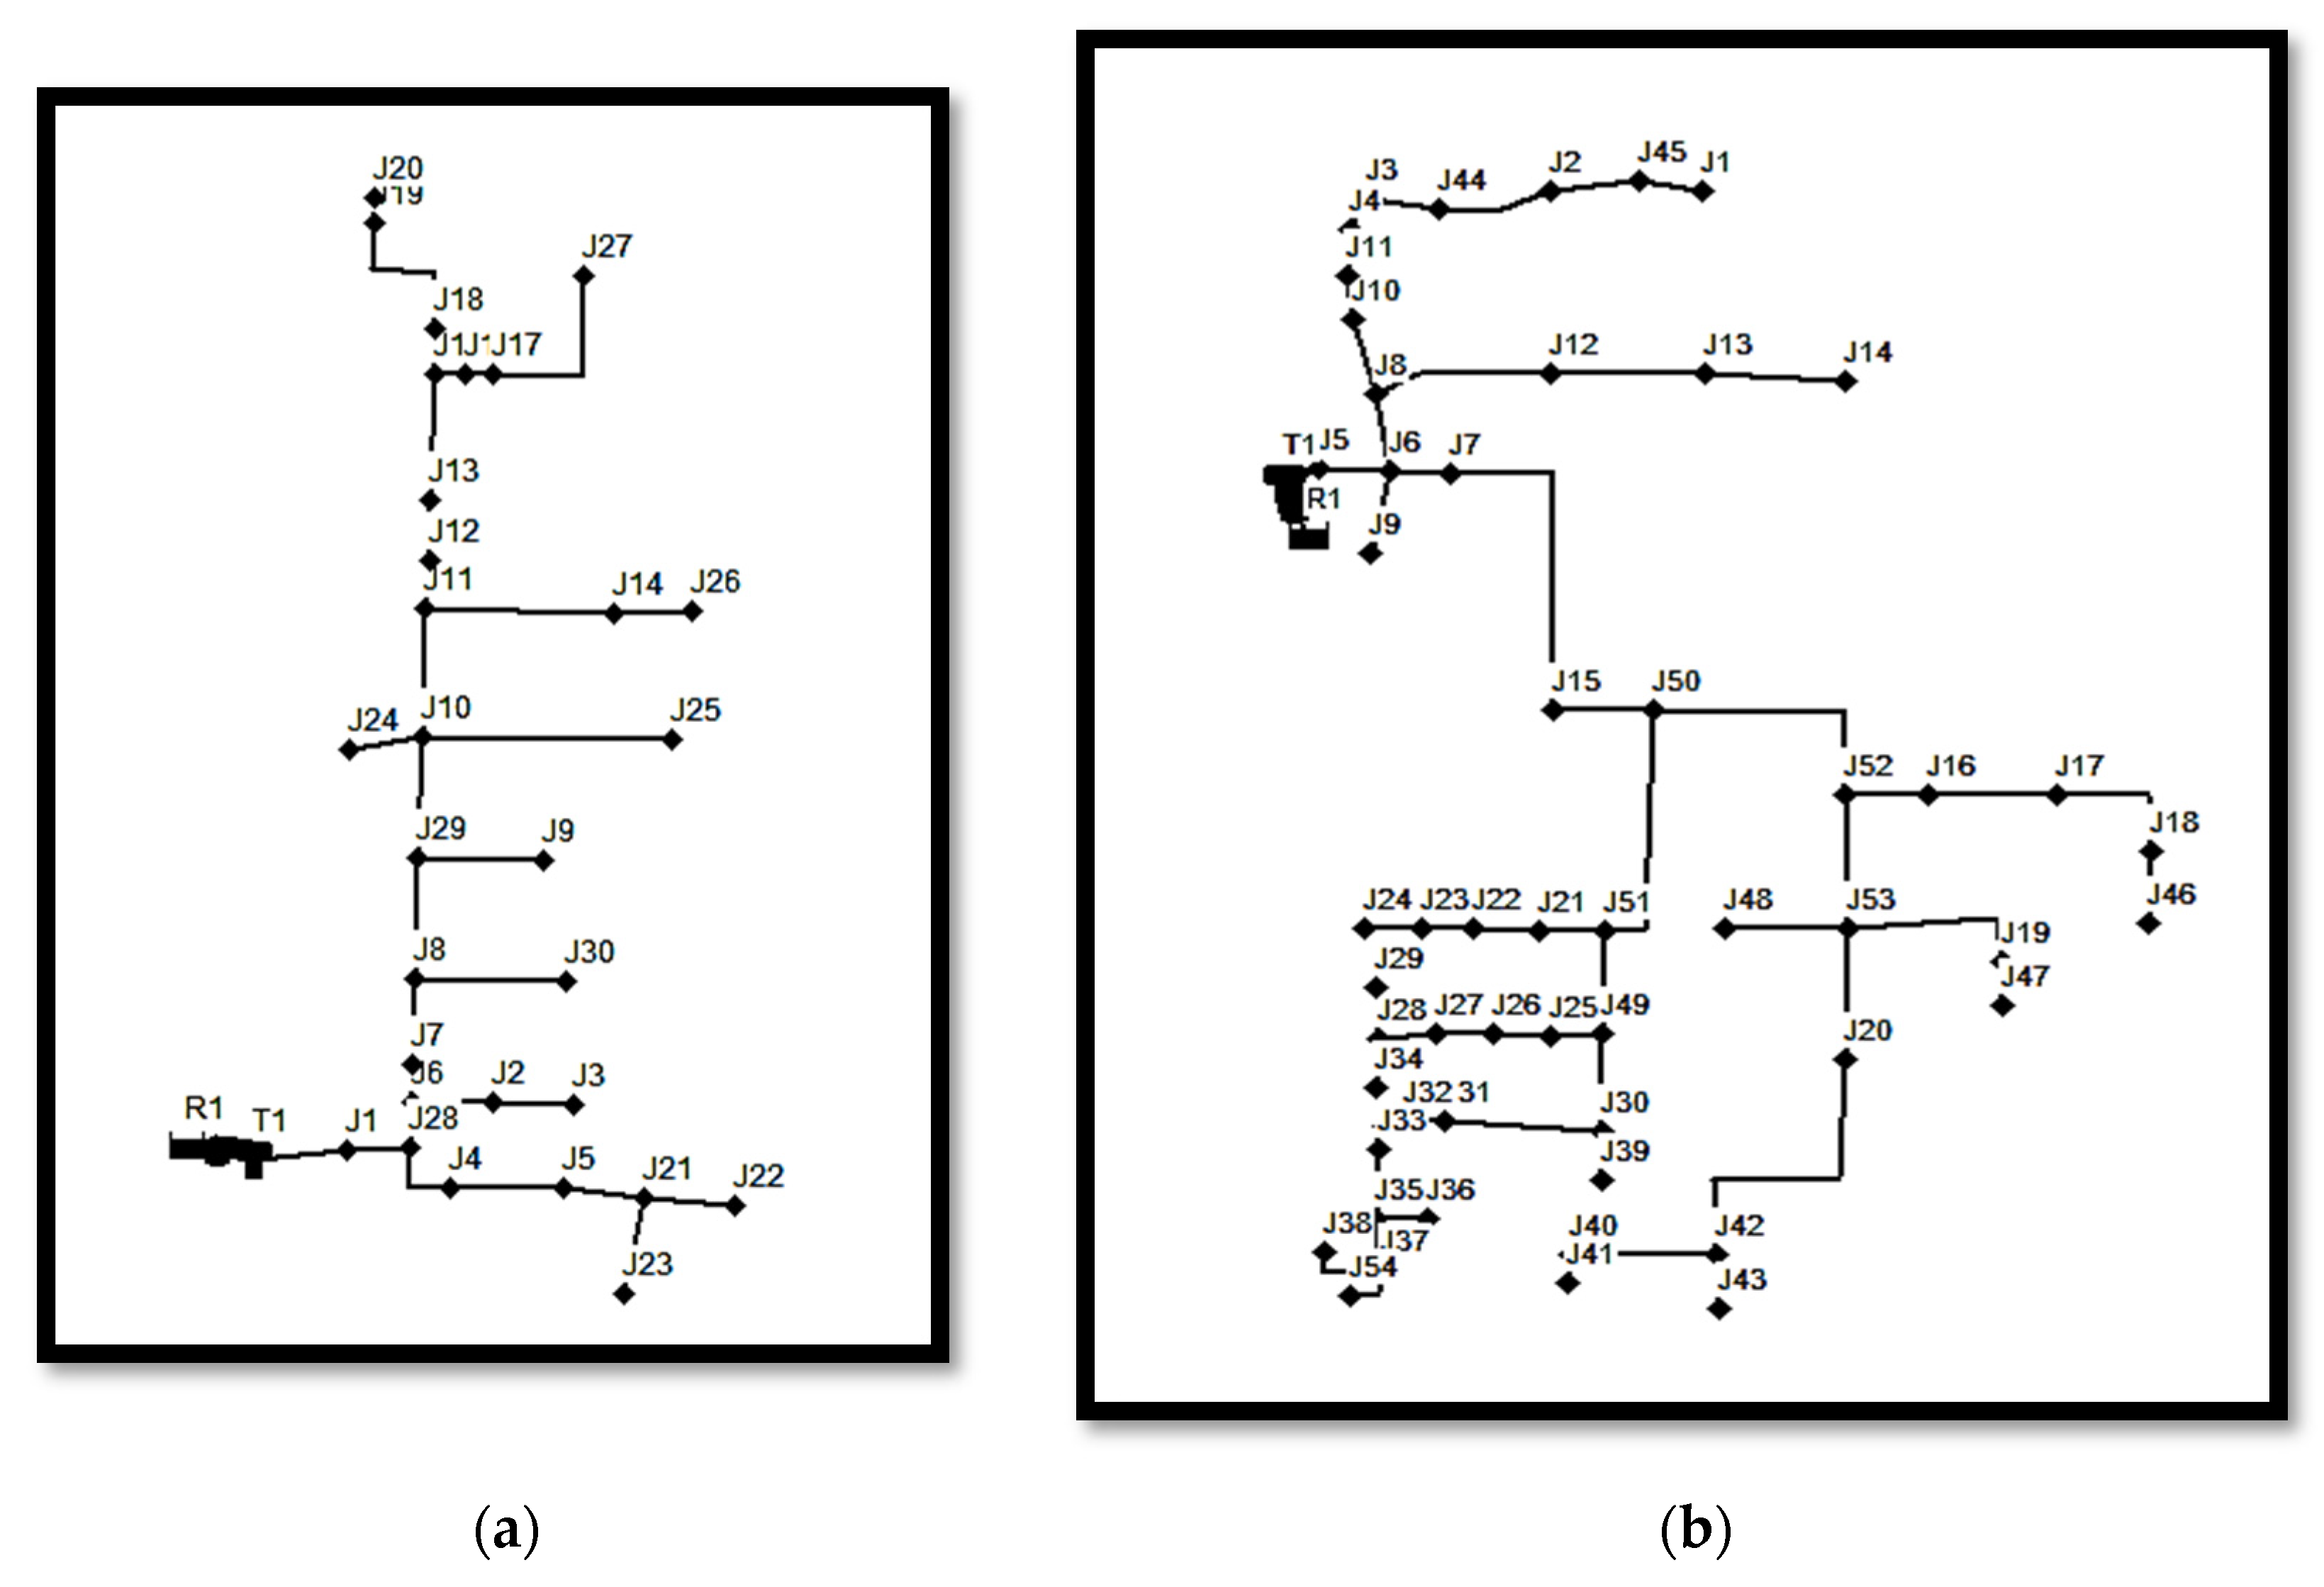
3.1. Distribution Network Layout

A dead-end type of distribution network was drawn for both parts of the study area using EPANET 2.2, as shown in Figure 1a,b. The input data for nodes—elevation; base demand; and demand pattern—was provided for each node, and the input data for pipes—pipe diameter; roughness coefficient; and length—was provided. The pipe network was arranged for both WDS, keeping in mind the geometry of the study area; the dead-end type of distribution system was used for both parts of the study area. Moreover, the basic assumption of the Jal-Tantra web system of having no loops in the network has to be satisfied.

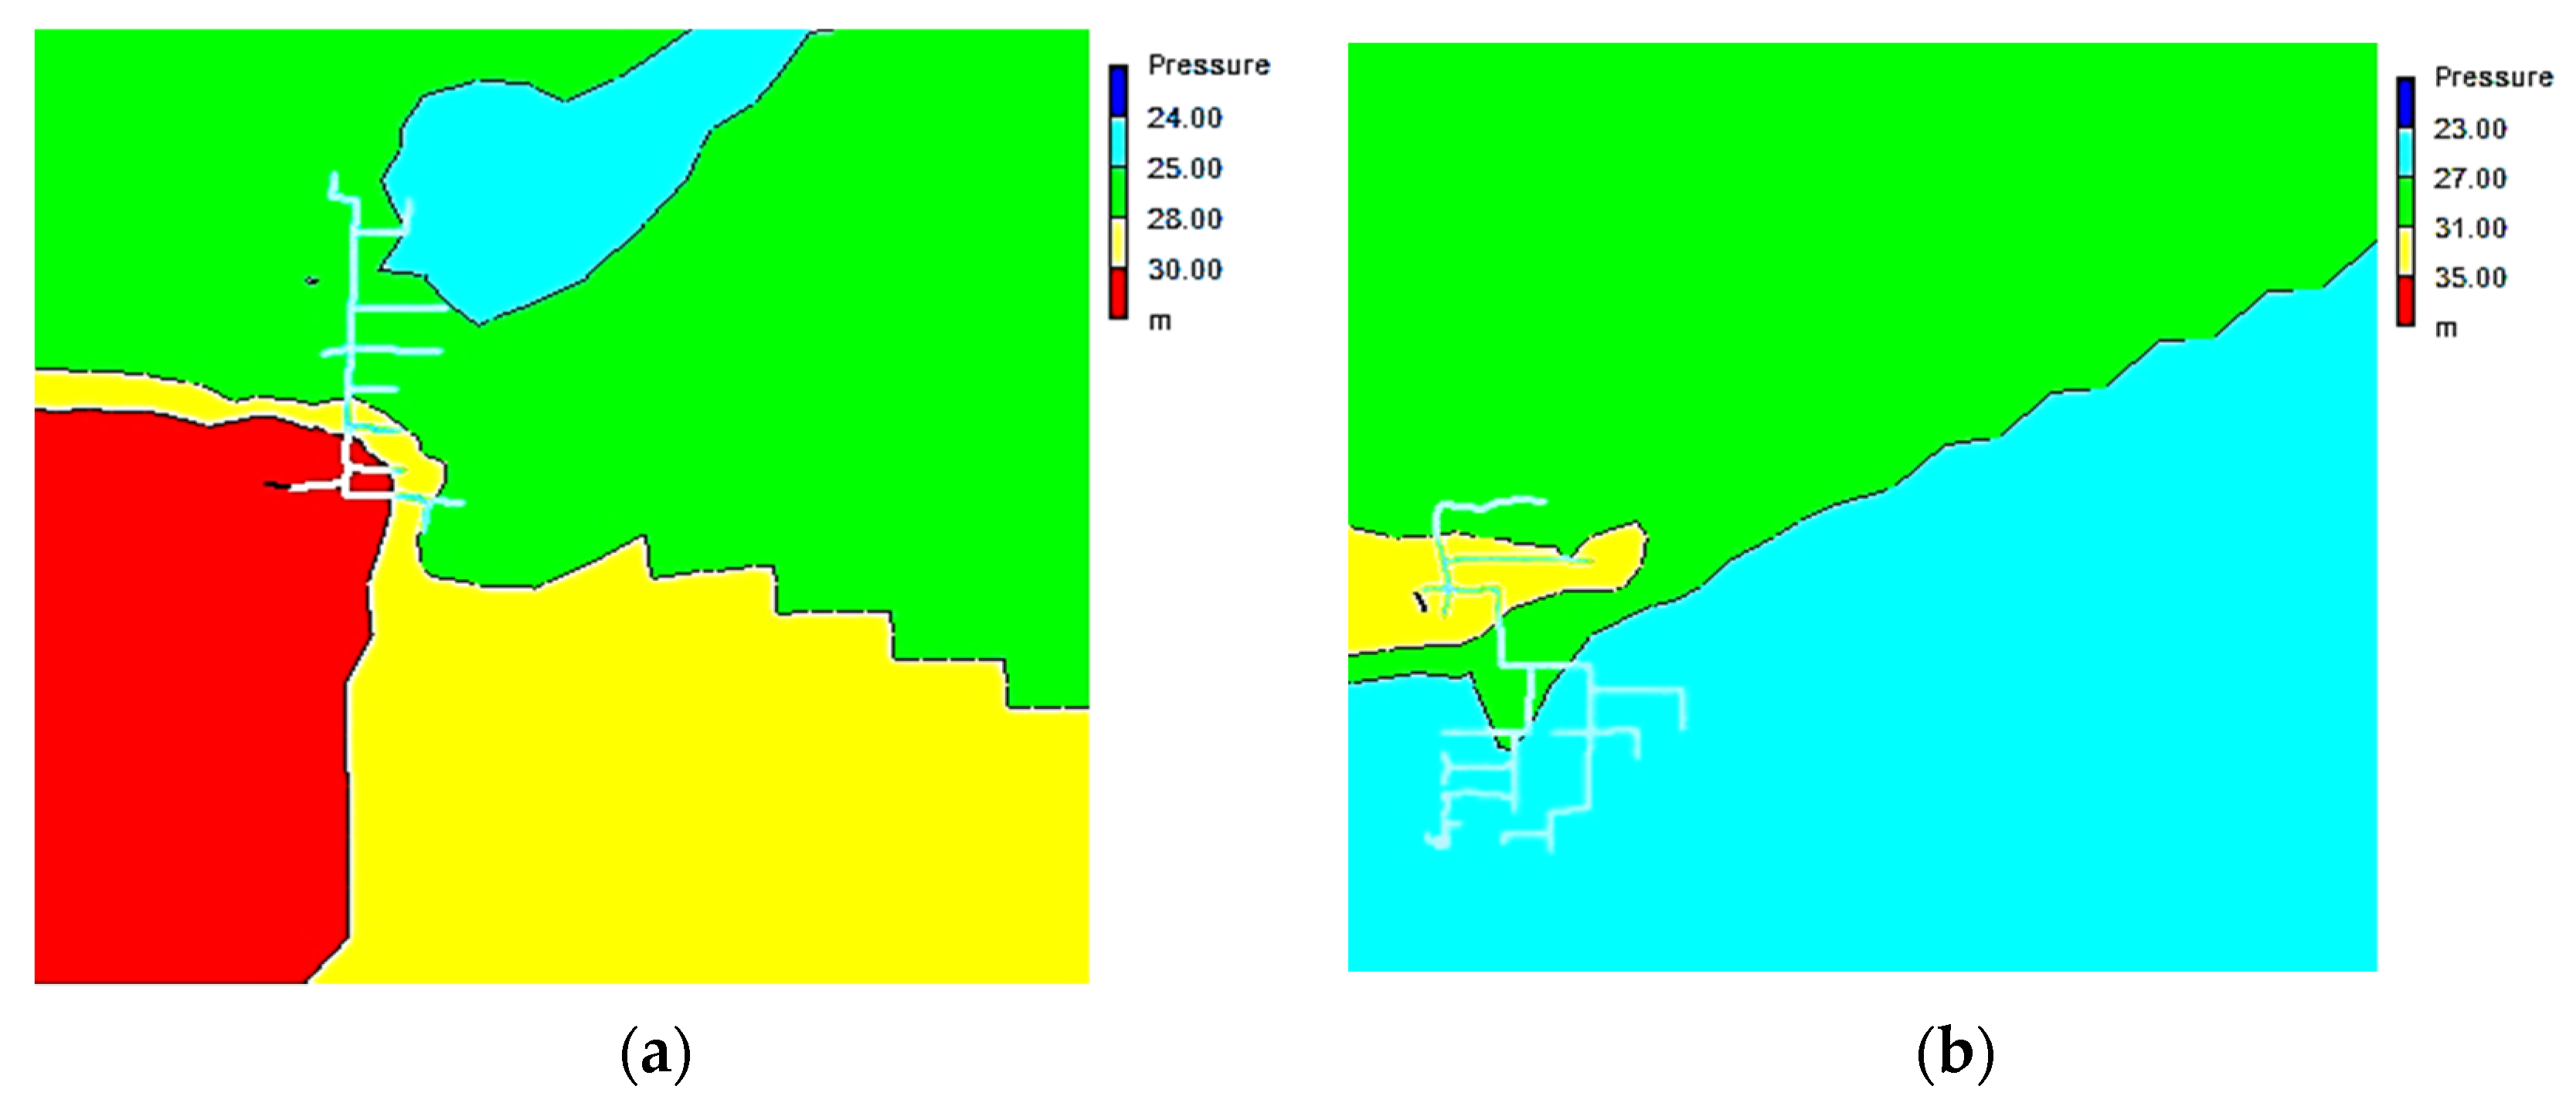
3.2. Contour Plan of Pressure Head at Nodes at 9 a.m. (Peak Demand Hour)

The contour plans given in Figure 2a,b, show the distribution of the pressure head across the layout of the network, parts I and II. Different colours representing the range of the pressure head are depicted by the scale provided in each map. The analysis indicated that the pressure head at all the nodes is greater than 17 m, thus the water at each node can reach up to a minimum of three stories of the building [18]. There is no need to use the PSVS. Moreover, the pressure head is also less than 70 m at each of the nodes in both parts of the WDS, so there is no need to install the PRVs at any of the nodes.

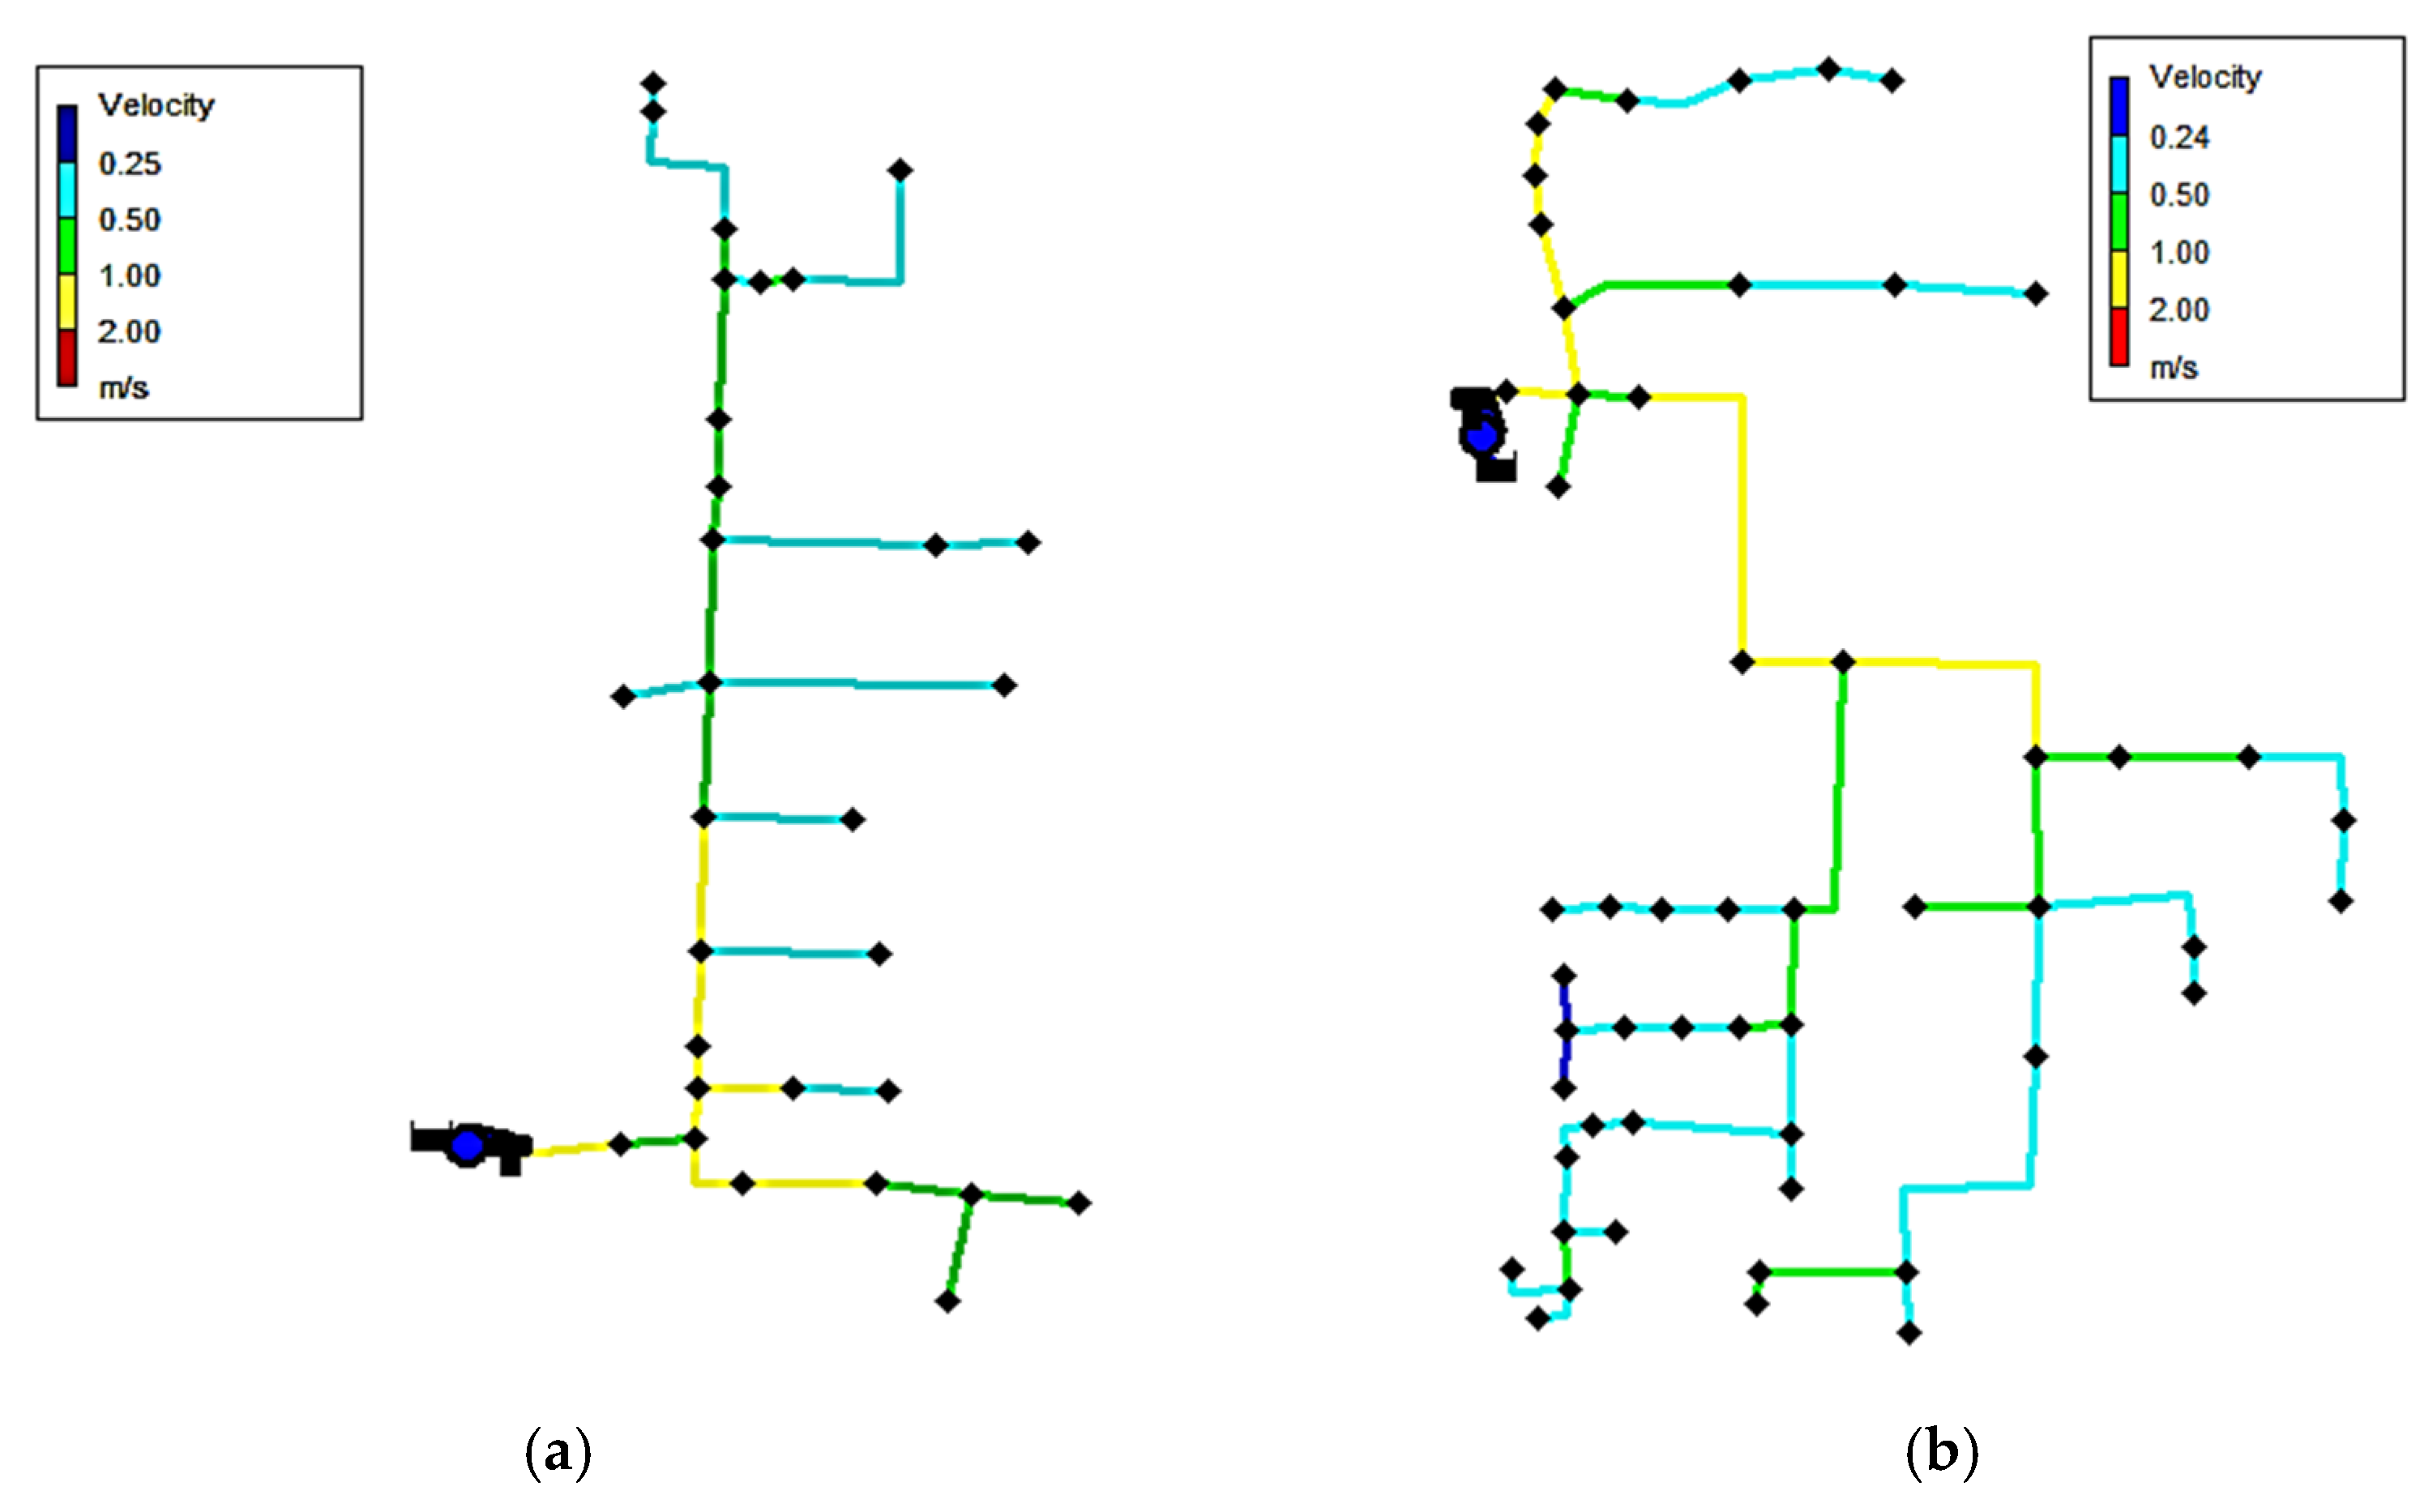
3.3. Colour-Coded Diagram of Velocity in Links at 9 a.m. (Peak Demand Hour)

The colour-coded velocity diagram given in Figure 3a,b, shows the range of velocities of flow in each pipe of network parts I and II. The scale showing the range of velocity represented by each colour is given for each of the networks. The analysis indicated that the velocity of flow for all the pipes in both networks is in the range of 0.25 m/s to 3 m/s [18]. Thus, there is no danger of erosion and deposition in the pipes during peak flow.

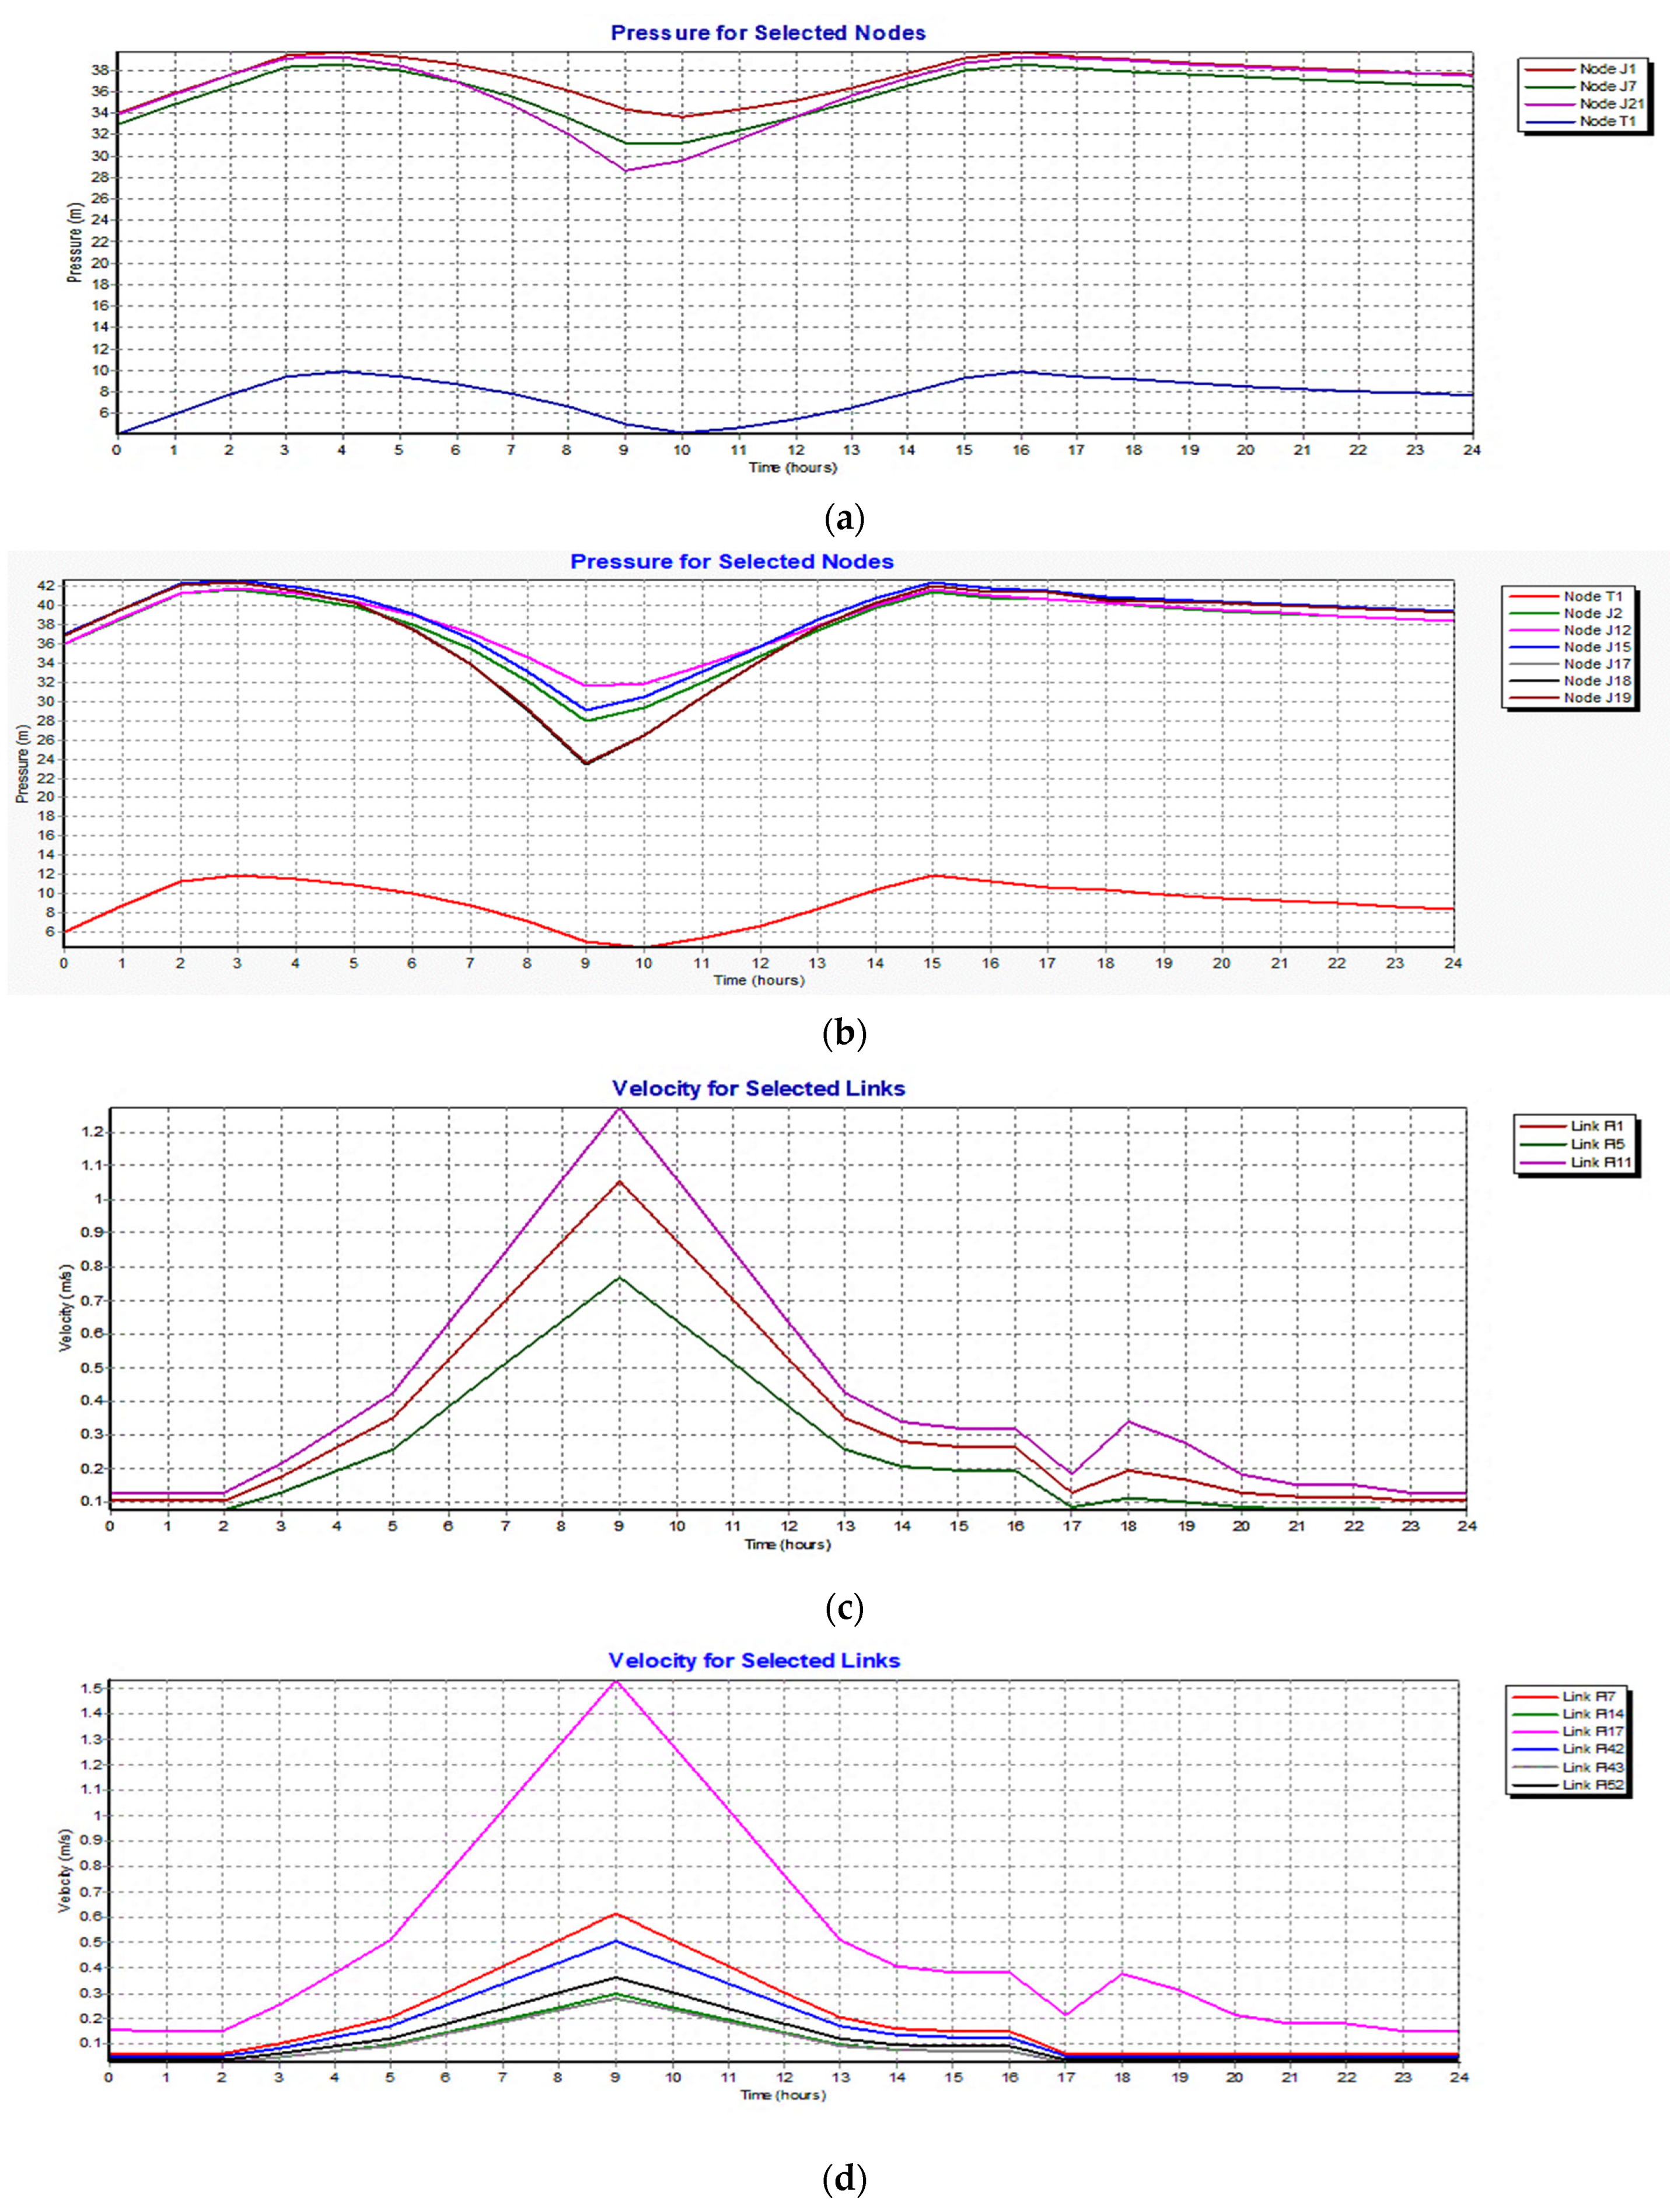
3.4. Time Series Plots

The temporal variation of the pressure head at the peak demand nodes and the water level in the tank are shown in Figure 4a,b, and the velocity in the pipes feeding the peak demand nodes is shown in Figure 4c,d. The pressure head lies within the recommended ranges with respect to all the nodes shown throughout the day. However, the velocity of flow in the pipes at the hours of minimum demand is less than 0.25 m/s, which can be attributed to the demand pattern adopted and the fact that the diameters have been selected to provide sufficient pressure head and cater to the demands at the peak hour. Moreover, the discharge in the pipes at these hours is less, and thus there is no serious hazard of deposition in the pipes. However, a velocity less than 0.25 m/s may be adopted to meet the hydraulic standards only if there is a suitable method of scouring the pipes [18].

3.5. Performance Evaluation by TPI

The TPI pressure and TPI velocity for WDS at the peak hour were evaluated for both parts of the study area. The TPI pressure for WDS part I = 1, indicating 100% efficiency of the network in terms of pressure head at the nodes at the peak hour. The TPI velocity for WDS part I = 0.615, indicating 61.5% efficiency of the network in terms of the velocity of flow in the pipes at the peak hour. The TPI pressure and TPI velocity for WDS part II are 1 and 0.645, respectively. Indicating the efficiency in terms of pressure head at nodes = 100% and in terms of velocity in the links = 64.5%. The lower values of TPI velocity can be attributed to the lower values of velocity during off-peak hours due to the demand pattern adopted.

3.6. Cost Optimization by Jal-Tantra Web System

The optimized value of the cost of the WDS in terms of pipe diameters was achieved by minimizing pipe diameters while maintaining the minimum specified pressure head for the nodes, as given in Table 6. However, the total cost before and after the optimization is approximately the same because the minimization of diameters can be seen in a smaller number of pipes and equals a maximum of 50 mm. Moreover, there is an increase in diameter of about 25 mm in some pipe lengths. The smaller difference in the costs indicates the cost-optimal design of the WDS for the study area by EPANET 2.2.

4. Conclusions

In this work, an “optimal” solution for the design of WDS for the University of Kashmir has been proposed to replace the existing and worn-out WDS, which has already served its function for more than 60 years. The design not only includes the modelling of hydraulic parameters such as pressure head and flow velocity, but the components are also designed in such a way that the objective functions of maximum efficiency of hydraulic performance and minimum capital cost in terms of pipe diameters and valves are satisfied. The main highlights of the work indicating the optimal hydraulic design include the following:
  • The WDS is designed to have a minimum pressure head of 17 m at each node throughout the 24 h of a day, so that the water can reach up to a minimum of the third floor level of all the buildings. The pressure head at all the nodes in both parts of the network is such that 17 ≤ Pi ≤ 70 (m), indicating the absence of points of deficiency or excess in the pressure head in the network. As such, there is no need to install the pressure sustaining valves (PSV) or the pressure regulating valves (PRV), resulting in a further reduction in the capital cost of the network.
  • The velocity of flow in all the pipes during the hours of maximum discharge is within the standard range of 0.25 ≤ Vi ≤ 3.0 (m/s), such that there is no danger of erosion or deposition during such hours. However, during the few hours of least discharge, the velocity of flow is less than 0.25 m/s in some pipes. Therefore, a scoring arrangement may be provided to remove the depositions, if any.
  • The TPIs were evaluated for both parts of the WDS. The performance at peak hour with respect to pressure at nodes is 100%, while the performance with respect to velocity in pipes is 61.5% for WDS part I and 64.5% for WDS part II. The lower values of TPI velocity can be attributed to the lower values of velocity at off-peak hours due to the demand pattern adopted.
  • Finally, the cost-optimality of the network was checked by using the Jal-Tantra web system, where the diameter of a few pipes was reduced by a maximum of 50 mm, while it increased by about 25 mm for a few pipes. The difference in the cost of the WDS as per EPANET modelling and that obtained by the Jal-Tantra is negligible, indicating the cost-optimal design of the WDS by EPANET.

Author Contributions

Introduction, M.A. and D.A.; Methodology, M.A.; Results and Discussions, D.A.; Conclusions, M.A. and D.A. All authors have read and agreed to the published version of the manuscript.

Funding

This research received no external funding.

Institutional Review Board Statement

Not applicable.

Informed Consent Statement

Not applicable.

Data Availability Statement

All the data used was obtained from the engineering wing of the University of Kashmir.

Conflicts of Interest

The authors declare no conflict of interest.

References

  1. Awe, O.M.; Okolie, S.T.A.; Fayomi, O.S.I. Review of Water Distribution Systems Modelling and Performance Analysis Softwares Review of Water Distribution Systems Modelling and Performance Analysis Softwares. J. Phys. Conf. Ser. 2019, 1378, 022067. [Google Scholar] [CrossRef]
  2. Sonaje, N.P.; Joshi, G.M. A review of modeling and application of water distribution networks (wdn). Int. J. Tech. Res. Appl. 2015, 3, 174–178. [Google Scholar]
  3. Nagvekar, Y.; Pandri, Y.; Shinde, T.; Ukarde, A. A review study on use of epanet for water distribution networks. Int. J. Innov. Eng. Technol. 2019, 6, 42–44. [Google Scholar]
  4. Anisha, G.; Kumar, A.; Kumar, J.A.; Raju, P.S. Analysis and Design of Water Distribution Network Using EPANET for Chirala Municipality in Prakasam District of Andhra Pradesh. Int. J. Eng. Appl. Sci. 2016, 3, 53–60. [Google Scholar]
  5. Ramana, G.V.; Sudheer, C.V.S.S.; Rajasekhar, B. Network Analysis of Water Distribution System in Rural Areas using EPANET. Procedia Eng. 2015, 119, 496–505. [Google Scholar] [CrossRef]
  6. Siew, C.; Tanyimboh, T.T.; Seyoum, A.G. Penalty-Free Multi-Objective Evolutionary Approach to Optimization of Anytown Water Distribution Network. Water Resour. Manag. 2016, 30, 3671–3688. [Google Scholar] [CrossRef]
  7. Sharma, A.K.; Swamee, P.K. Cost considerations and general principles in the optimal design of water distribution systems. In Water Distribution Systems Analysis Symposium 2006; Buchberger, S.G., Clark, R.M., Grayman, W.M., Uber, J.G., Eds.; ASCE: Reston, VA, USA, 2012. [Google Scholar]
  8. Jacobs, H.E.; Strijdom, J.L. Evaluation of minimum residual pressure as design criterion for South African water distribution systems. Water SA 2009, 35, 183–191. [Google Scholar] [CrossRef]
  9. Kourbasis, N.; Patelis, M.; Tsitsifli, S.; Kanakoudis, V. Optimizing Water Age and Pressure in Drinking Water Distribution Networks. Environ. Sci. Proc. 2020, 2, 51. [Google Scholar] [CrossRef]
  10. Hooda, N.; Damani, O. JalTantra: A System for the Design and Optimization of Rural Piped Water Networks JalTantra: A System for the Design and Optimization of Rural Piped Water Networks. INFORMS J. Appl. Anal. 2019, 49, 1–12. [Google Scholar]
  11. Hooda, N.; Damani, O. Inclusion of tank configurations as a variable in the cost optimization of branched piped-water networks. Drink. Water Eng. Sci. 2017, 10, 39–44. [Google Scholar] [CrossRef]
  12. Bonora, M.A.; Caldarola, F.; Maiolo, M.; Muranho, J.; Sousa, J. The New Set Up of Local Performance Indices into WaterNetGen and Application to Santarém’s Network. Environ. Sci. Proc. 2020, 2, 18. [Google Scholar] [CrossRef]
  13. Muranho, J.; Ferreira, A.; Sousa, J.; Gomes, A.; Marques, J.A.S. Technical Performance Evaluation of Water Distribution Networks based on EPANET. Procedia Eng. 2014, 70, 1201–1210. [Google Scholar] [CrossRef]
  14. Avile, A.; Garcı, F. Pressure management for leakage reduction using pressure reducing valves. Case study in an Andean city. Alexendria Eng. J. 2019, 58, 1313–1326. [Google Scholar]
  15. Garg, S.K. Environmental Engineering (vol I); Khanna Publishers: Bangalore, India, 2010. [Google Scholar]
  16. Modi, P.N. Environmental Engineering (vol I); Standard Book House: Delhi, India, 2018. [Google Scholar]
  17. IS Code 1172: 1993—Code of Basic Requirements for Water Supply, Drainge and Sanitation; Bureau of Indian Standards: Old Delhi, India, 2002.
  18. CPHEEO Manual. Manual on Water Supply and Treatment. 1999. Available online: http://cpheeo.gov.in/cms/manual-on-sewerage-and-sewage-treatment.php (accessed on 22 September 2022).
  19. IS 9668: 1990—Provision and Maintenance of Water Supplies For Fire Fighting; Bureau of Indian Standards: Old Delhi, India, 2010.
  20. Rossman, L.; Woo, H.; Tryby, M.; Shang, F.; Janke, R.; Haxton, T. EPANET 2.2 User Manual; U.S. Environmental Protection Agency: Cincinnati, OH, USA, 2020. [Google Scholar]
Figure 1. (a,b): Distribution Network Layout for WDS parts I and II.
Environsciproc 25 00083 g001
Figure 2. (a,b): Contour plan of pressure head at nodes at 9 a.m., for WDS parts I and II.
Environsciproc 25 00083 g002
Figure 3. (a,b): Colour-coded diagram of velocity in links at 9 a.m., WDS parts I and II.
Environsciproc 25 00083 g003
Figure 4. (a,b): Time series plot of pressure at peak demand nodes and storage tank for WDS parts I and II. (c,d): Velocity in links feeding peak demand nodes for WDS parts I and II.
Environsciproc 25 00083 g004
Table 1. Demand calculations for WDS Parts I and II.
S NOPARAMETERWDS PART IWDS PART II
1Forecasted Residential Population53248066
2Forecasted Floating Population10301720
3Avg. Daily Demand (ADD)891,000 L1,350,270 L
4Max Daily Demand (MDD)1,603,800 L2.43 × 106 L
5Avg. Hourly Demand (AHD)37,125 L56,262 L
6Max Hourly Demand (MHD)111,375 L168,786 L
7Fire Demand216,000 L216,000 L
8Coincident Draft1,107,000 L1,566,270 L
9Base Demand Multiplier0.1040.1
Table 2. Storage tank and pump characteristics.
S NOPARAMETERWDS PART IWDS PART II
1Total storage capacity of the OHT6.17 × 105 L/day8.24 × 105 L/day
2Volume of the OHT617 m3824 m3
3Height of the OHT10 m12 m
4Diameter of the OHT9 m9.5 m
5Discharge to be provided by the pump0.037 cumec0.056 cumec
6Staging Height of the tank30 m30 m
7Economical diameter of the rising main250 mm300 mm
8Pressure head to be developed by the pump51 m53 m
9Input power for the pump24.7 kW37.4 kW
10Cost of electrical energy/day at Rs 5 per unit1482 rupees2245 rupees
11Design flow rate of the pump1856 lpm2813 lpm
Table 3. Simple control for WDS Parts (I, II).
WDS Part I
link Pu1 closed if node T1 above 10
link Pu1 open if node T1 below 4
WDS Part II
link Pu1 closed if node T1 above 12
link Pu1 open if node T1 below 6
Table 4. General input data.
Network NameWDS Part IWDS Part II
Organization NameUOKUOK
Minimum Node Pressure1717
Default Pipe Roughness ‘C’100100
Minimum Head loss per KM0.0100.01
Maximum Head loss per KM65.00065.000
Maximum Water Speed3.0003.000
Maximum Pipe Pressure70.00070.000
Number of Supply Hours2424
Source Node ID3155
Source Node NameTank (T1)Tank (T1)
Source Elevation1624.001623.00
Source Head1628.001629.00
Table 5. Commercial pipe data.
Diameter (mm)Cost (Rs)
15123
20155
25225
32281
40320
50439
65553
80712
1001031
1251392
1501626
2002760
Table 6. Cost results for pipes, WDS parts I and II.
WDS Part I
DiameterLengthCostCumulative Cost
20.009314,44414,444
32.00367103,197117,642
40.0017054,397172,038
50.0011751,578223,617
65.0014680,596304,212
80.00166118,212422,424
100.00198203,939626,363
125.00125174,683801,046
150.00327531,2181,332,264
200.0098270,3421,602,606
Total18071,602,606
WDS Part II
DiameterLengthCostCumulative Cost
15.0012615,44915,449
20.007211,10326,552
25.0024354,69081,242
32.0018251,142132,384
40.0019161,120193,504
50.00230100,827294,331
65.00541299,353593,684
80.00609433,6081,027,292
100.00298307,2381,334,530
125.00178247,9311,582,461
150.00312507,8952,090,356
200.0061167,6422,257,998
Total30432,257,998
Disclaimer/Publisher’s Note: The statements, opinions and data contained in all publications are solely those of the individual author(s) and contributor(s) and not of MDPI and/or the editor(s). MDPI and/or the editor(s) disclaim responsibility for any injury to people or property resulting from any ideas, methods, instructions or products referred to in the content.

