Proceeding Paper

Evaluation of GPM IMERG Performance Over the Lake Titicaca Basin at Different Time Scales †

Escuela Profesional de Ingeniería Agrícola, Universidad Nacional del Altiplano, Puno 21001, Peru
*
Author to whom correspondence should be addressed.
Presented at the 7th International Electronic Conference on Water Sciences, 15–30 March 2023; Available online: https://ecws-7.sciforum.net.
Environ. Sci. Proc. 2023, 25(1), 65; https://doi.org/10.3390/ECWS-7-14324
Published: 3 April 2023
(This article belongs to the Proceedings of The 7th International Electronic Conference on Water Sciences)

Abstract

:
Accurate precipitation measurements are very important as an input for water resources management and various hydrometeorological applications. The Integrated Multi-Satellite Retrievals for Global Precipitation Measurement (GPM) (IMERG) satellite precipitation product (SPP) has been widely used to complement rain gauge measurements. However, it must be evaluated before use and also its application is still lacking in the lake Titicaca basin (LTB). In this research, the evaluation of the performance of GPM IMERG on the LTB at different time scales (daily, monthly and annual) was carried out. The evaluation was performed using rain gauge observations for the period 2003–2016 and three IMERGs, namely early (IMERG-E), late (IMERG-L), and final (IMERG-F). Accordingly, three performance metrics were used that evaluated the accuracy (correlation coefficient, CC), error (root mean square error, RMSE), and bias (percent bias, PBIAS) of the satellite estimates. In general, the monthly IMERG SPP correlated best with the rain gauge measurements. In all the evaluations performed (daily, monthly, and annual), the IMERG-F was in better agreement with the rain gauge measurements at the LTB, with small differences with IMERG-E and IMERG-L. The IMERG SPPs show potential for use in various hydrometeorological applications in the LTB.

1. Introduction

Precipitation is an important variable for hydrological, agricultural, industrial and energy systems [1]. It has a great impact on people’s lives and the control of the hydrological cycle, as well as fluctuations that affect water resources management, environmental planning and disaster mitigation [2,3]. Its utility is fundamental as an input to hydrological models, meteorological models and climate models [4,5]. The most accurate precipitation measurements are those taken directly with a rain gauge [6]. However, the availability of such data are limited to the few areas where weather stations have been installed [7].
Climatological and hydrometeorological applications of SPPs have been significantly improved with the appearance of the GPM IMERG [8]. The IMERG combines data from the GPM constellations of satellites to estimate precipitation over most of the earth’s surface which lacks terrestrial rain gauges, and offers three runs to meet different users’ latency and accuracy requirements, including IMERG Early (IMERG-E), IMERG Late (IMERG-L) and IMERG Final (IMERG-F) [9], which has led many researchers to consider using the IMERG and evaluate its performance.
In recent years, the use of SPPs from IMERG have shown promise in detecting precipitation on different time scales. For example, in mainland China, an evaluation of monthly precipitation products of IMERG and TRMM 3B43 [10] was carried out; in Brazil [11], IMERG grid-level evaluation was conducted at various spatial and temporal scales; in Thailand [12], a hydrological evaluation and application of TRMM and GPM precipitation products in a tropical monsoon basin was conducted; and a comprehensive evaluation of GPM IMERG and MRMS with hourly ground observations was conducted across Canada [13]. Additionally, [14] evaluated GPM IMERG, TMPA 3B42, and ERA-Interim in different topographic and climatic conditions in Iran; in Singapore [15], GPM and TRMM precipitation products were evaluated; [16] compared satellite precipitation products GPM IMERG, TMPA 3B42, and PERSIANN-CDR over Malaysia; [17] focused on a complete comparison of GPM IMERG with nine satellites and reanalysis datasets; while a first validation of IMERG over Spain is presented in [18]. The [19] developed a precipitation dataset through simultaneous use of IMERG, synoptic measurements, and automatic rain gauge measurements in the Philippines; [20] evaluated and compared daily precipitation of GPM and TRMM products over the Mekong River basin; in China [21], an evaluation of the IMERG version 05B precipitation product was conducted and compared with the IMERG version 04A at hourly and daily scales; in Myanmar, TRMM and GPM precipitation products were used for sub-daily scale flood simulations in a sparsely gauged river basin [22]; and a comprehensive evaluation of the latest IMERG and GSMaP precipitation products of the GPM era was conducted in mainland China [23]. Although the GPM IMERG SPP has been used in hydrological modeling in the LTB [24], its performance has not yet been evaluated at different time scales.
Taking the aforementioned studies into account, the objective of this research is to evaluate the performance of the GPM IMERG at different time scales in the lake Titicaca basin, its importance in improving the understanding of climate variability and its impact on flood risk management, hydrological modeling, and hydroclimatic studies. The hypothesis is that the quality and accuracy of GPM IMERG precipitation estimates vary at different time scales in the LTB.

2. Materials and Methods
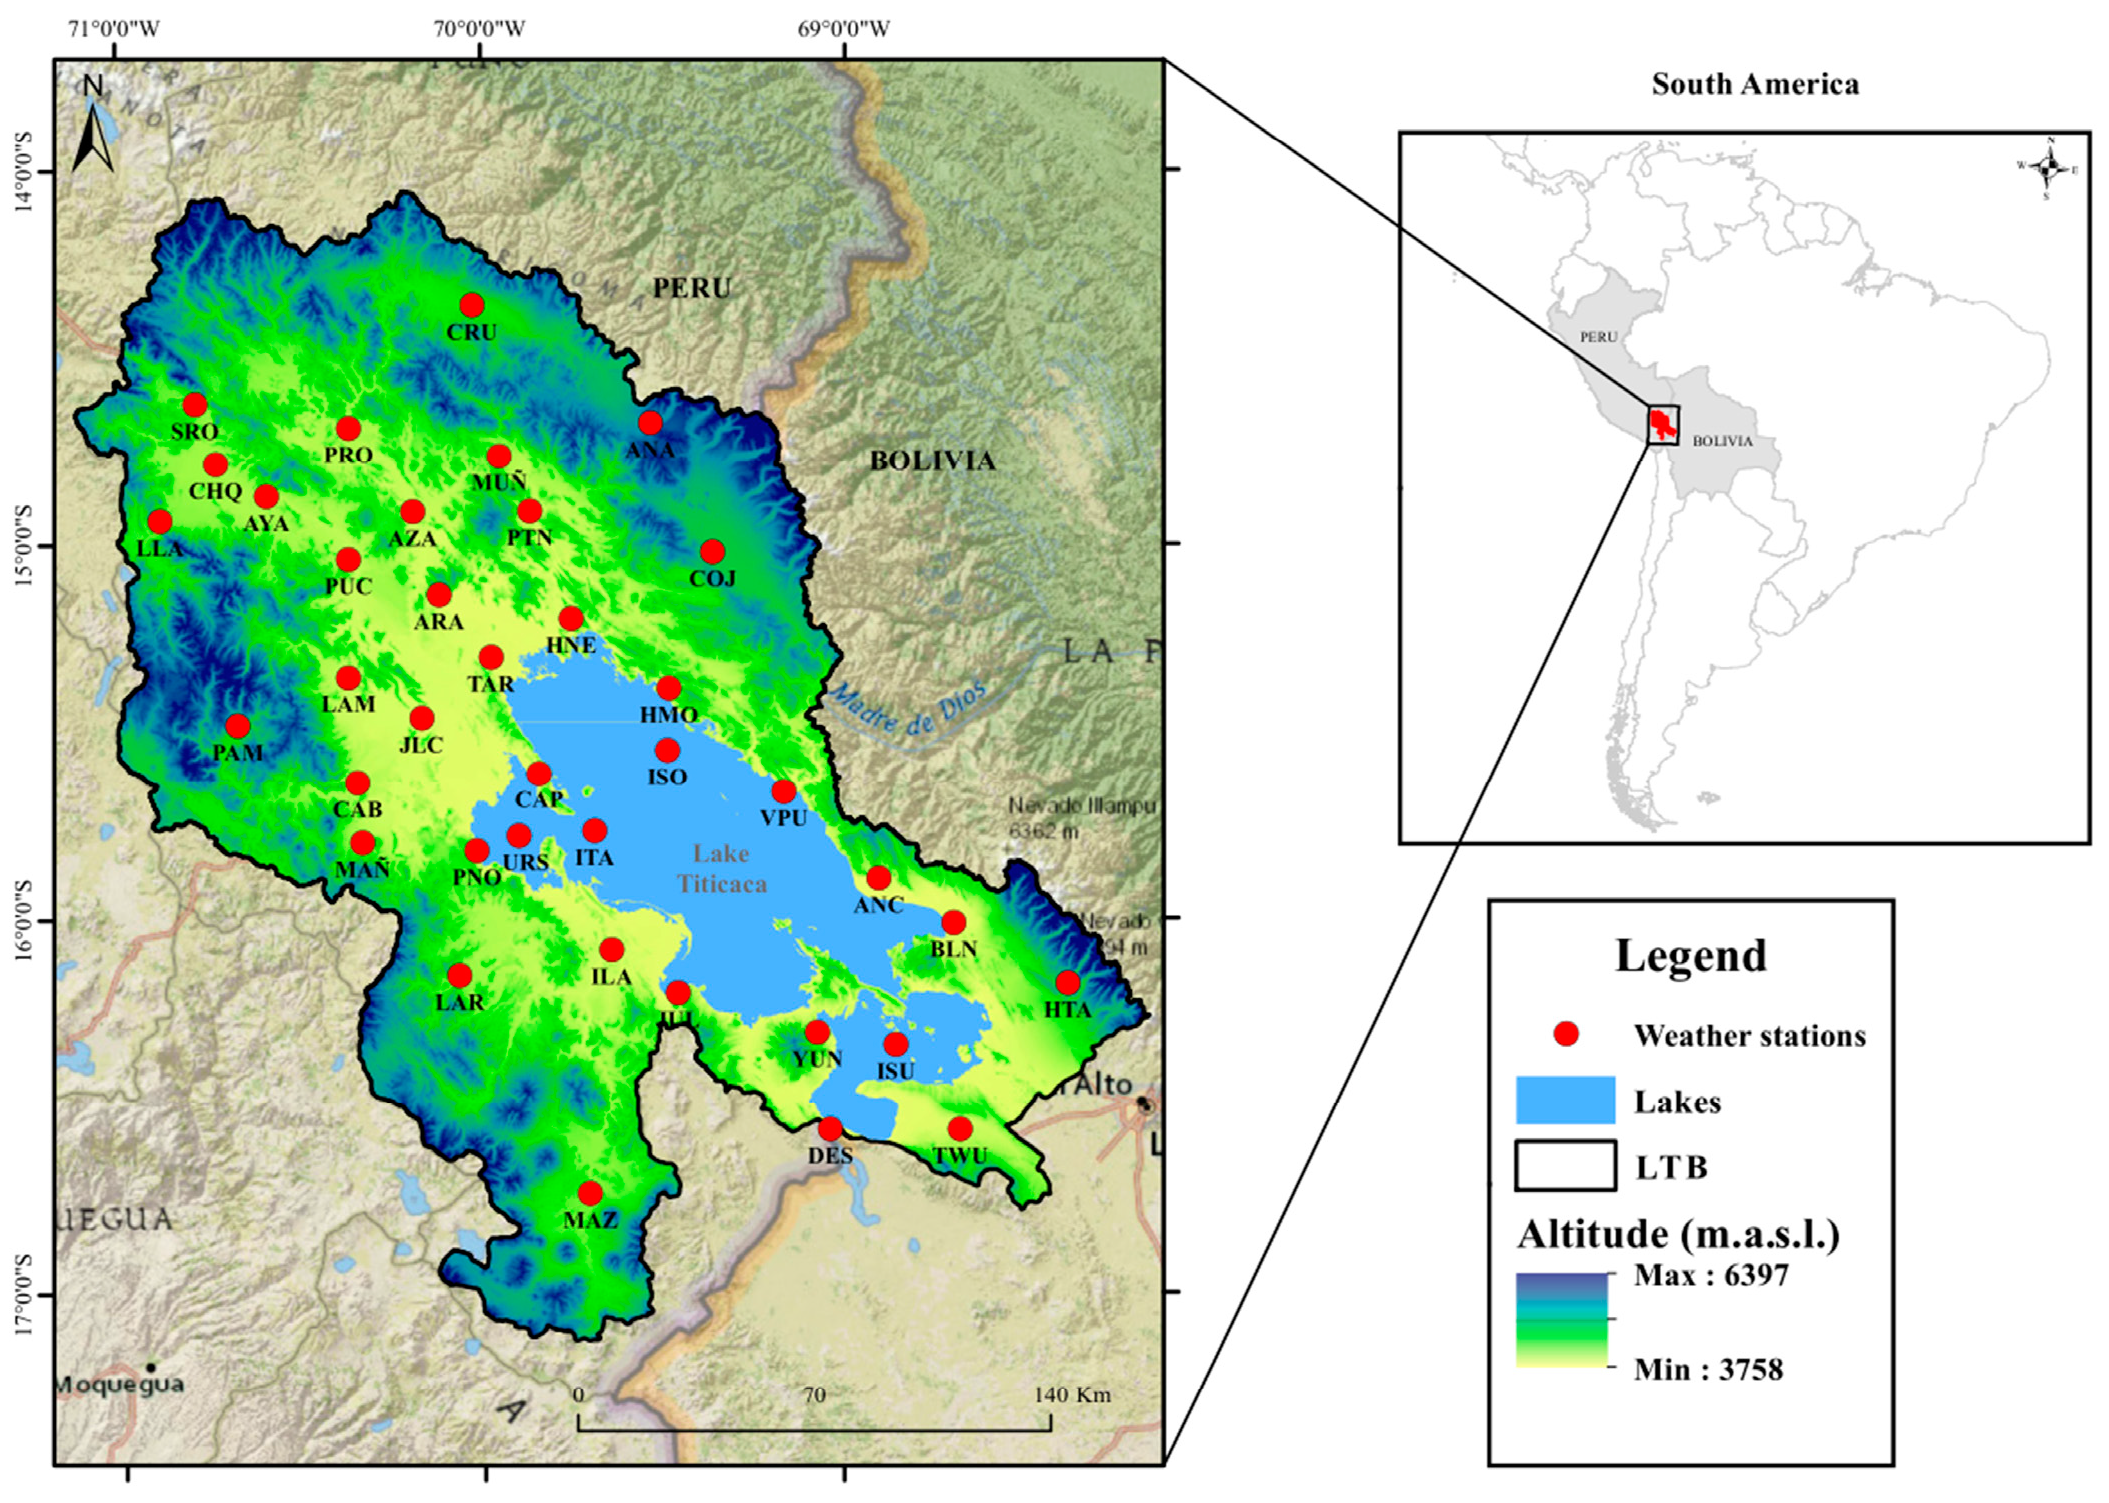
2.1. Study Area

The LTB is located in southern Peru (Puno department) and west Bolivia (La Paz department) (Figure 1). It is a part of the Titicaca hydrographic region and the Titicaca-Desaguadero-Poopó-Salar of Coipasa (TDPS) endorheic system, bordered by the eastern and western mountain ranges. It covers an approximate area of 53,919.1 km2. According to the digital elevation model (DEM), its average altitude is 4190.2 m.s.a.l., with a maximum altitude of 6397 m.s.a.l. and a minimum altitude of 3758 m.s.a.l. Most of the LTB has a flat topography, with a mean slope of 13.7%. The mean annual precipitation is 683.3 mm; 59.5% of the annual precipitation occurs in austral summer, 2.3% in winter and 22.1% and 16.1% in the transition periods from wet to dry (autumn) and from dry to wet (spring), respectively.

2.2. Cartographic Information

The DEM was generated by NASA’s Shuttle Radar Topography Mission (SRTM) at a spatial resolution of ~90 m, and was obtained from the Google Earth Engine (GEE) platform (https://earthengine.google.com/, accessed on 16 September 2022), Image ID CGIAR/SRTM90_V4 [25].

2.3. Rain Gauge Measurements

Rain gauge measurements were obtained from the Servicio Nacional de Meteorología e Hidrología (SENAMHI) Perú, considering a total of 33 meteorological stations. Moreover, from the Servicio Nacional de Meteorología e Hidrología (SENAMHI) Bolivia, five weather stations within the LTB were considered (Figure 1). The total number of weather stations considered was 38, with a daily recording period from 1 January 2003 to 31 December 2016.

2.4. GPM IMERG Satellite Precipitation Products

In this research, the GPM IMERG SPPs (IMERG-E, L and F) version 6 (V06) were evaluated. GPM produces precipitation data with a temporal resolution of up to 30 min, spatial resolution of 0.1° × 0.1° (latitude 60° N-S) and in three executions (IMERG-E, -L and -F), cohosted by the National Aeronautics and Space Administration (NASA) and Japan Aerospace Exploration Agency (JAXA). In sequence, IMERG-E and L are near real-time data with a delay of 4 hours and 14 hours after observation time respectively, however, IMERG-F has a delay of 3.5 months [9]. The IMERG-E can be used when rapid responses are required, such as possible flood or landslide warnings, while the IMERG-L can be used for agricultural forecasting or drought monitoring [26].
GPM IMERG V06 data were obtained from the National Aeronautics and Space Administration (NASA) GIOVANNI online (Web) server (https://giovanni.gsfc.nasa.gov/giovanni/, accessed on 20 October 2022). The data were collected for the same period as the rain gauge measurements.

2.5. Method

Performance Evaluation of SPPs GPM IMERG

The homogeneity of the rain gauge measurements was verified through the non-parametric CUSUM test using the TREND program (https://toolkit.ewater.org.au/Tools/TREND, accessed on 11 October 2022). TREND is designed to facilitate statistical analysis of trends, changes and randomness in hydrological and time series data [27]. Missing data were filled in using the random forest method incorporated in the MICE (Generates Multivariate Imputations by Chained Equations) package for the R project [28]. Homogeneity was checked with monthly data after filling in the missing data [29,30].
Comparisons between IMERG and rain gauges were performed using a pixel-to-point approach as performed in previous studies [14]. This is based solely on observed precipitation measurements.
In effect, three continuous statistical metrics were used to evaluate performance (Table 1). These metrics aim to quantitatively compare the performance of IMERG measurements with rain gauge measurements. The evaluations were performed with different temporal variations, that is, daily, monthly and annual. The lack of rain gauge measurements in some areas of the LTB could limit the ability to fully evaluate IMERG measurements.

3. Results

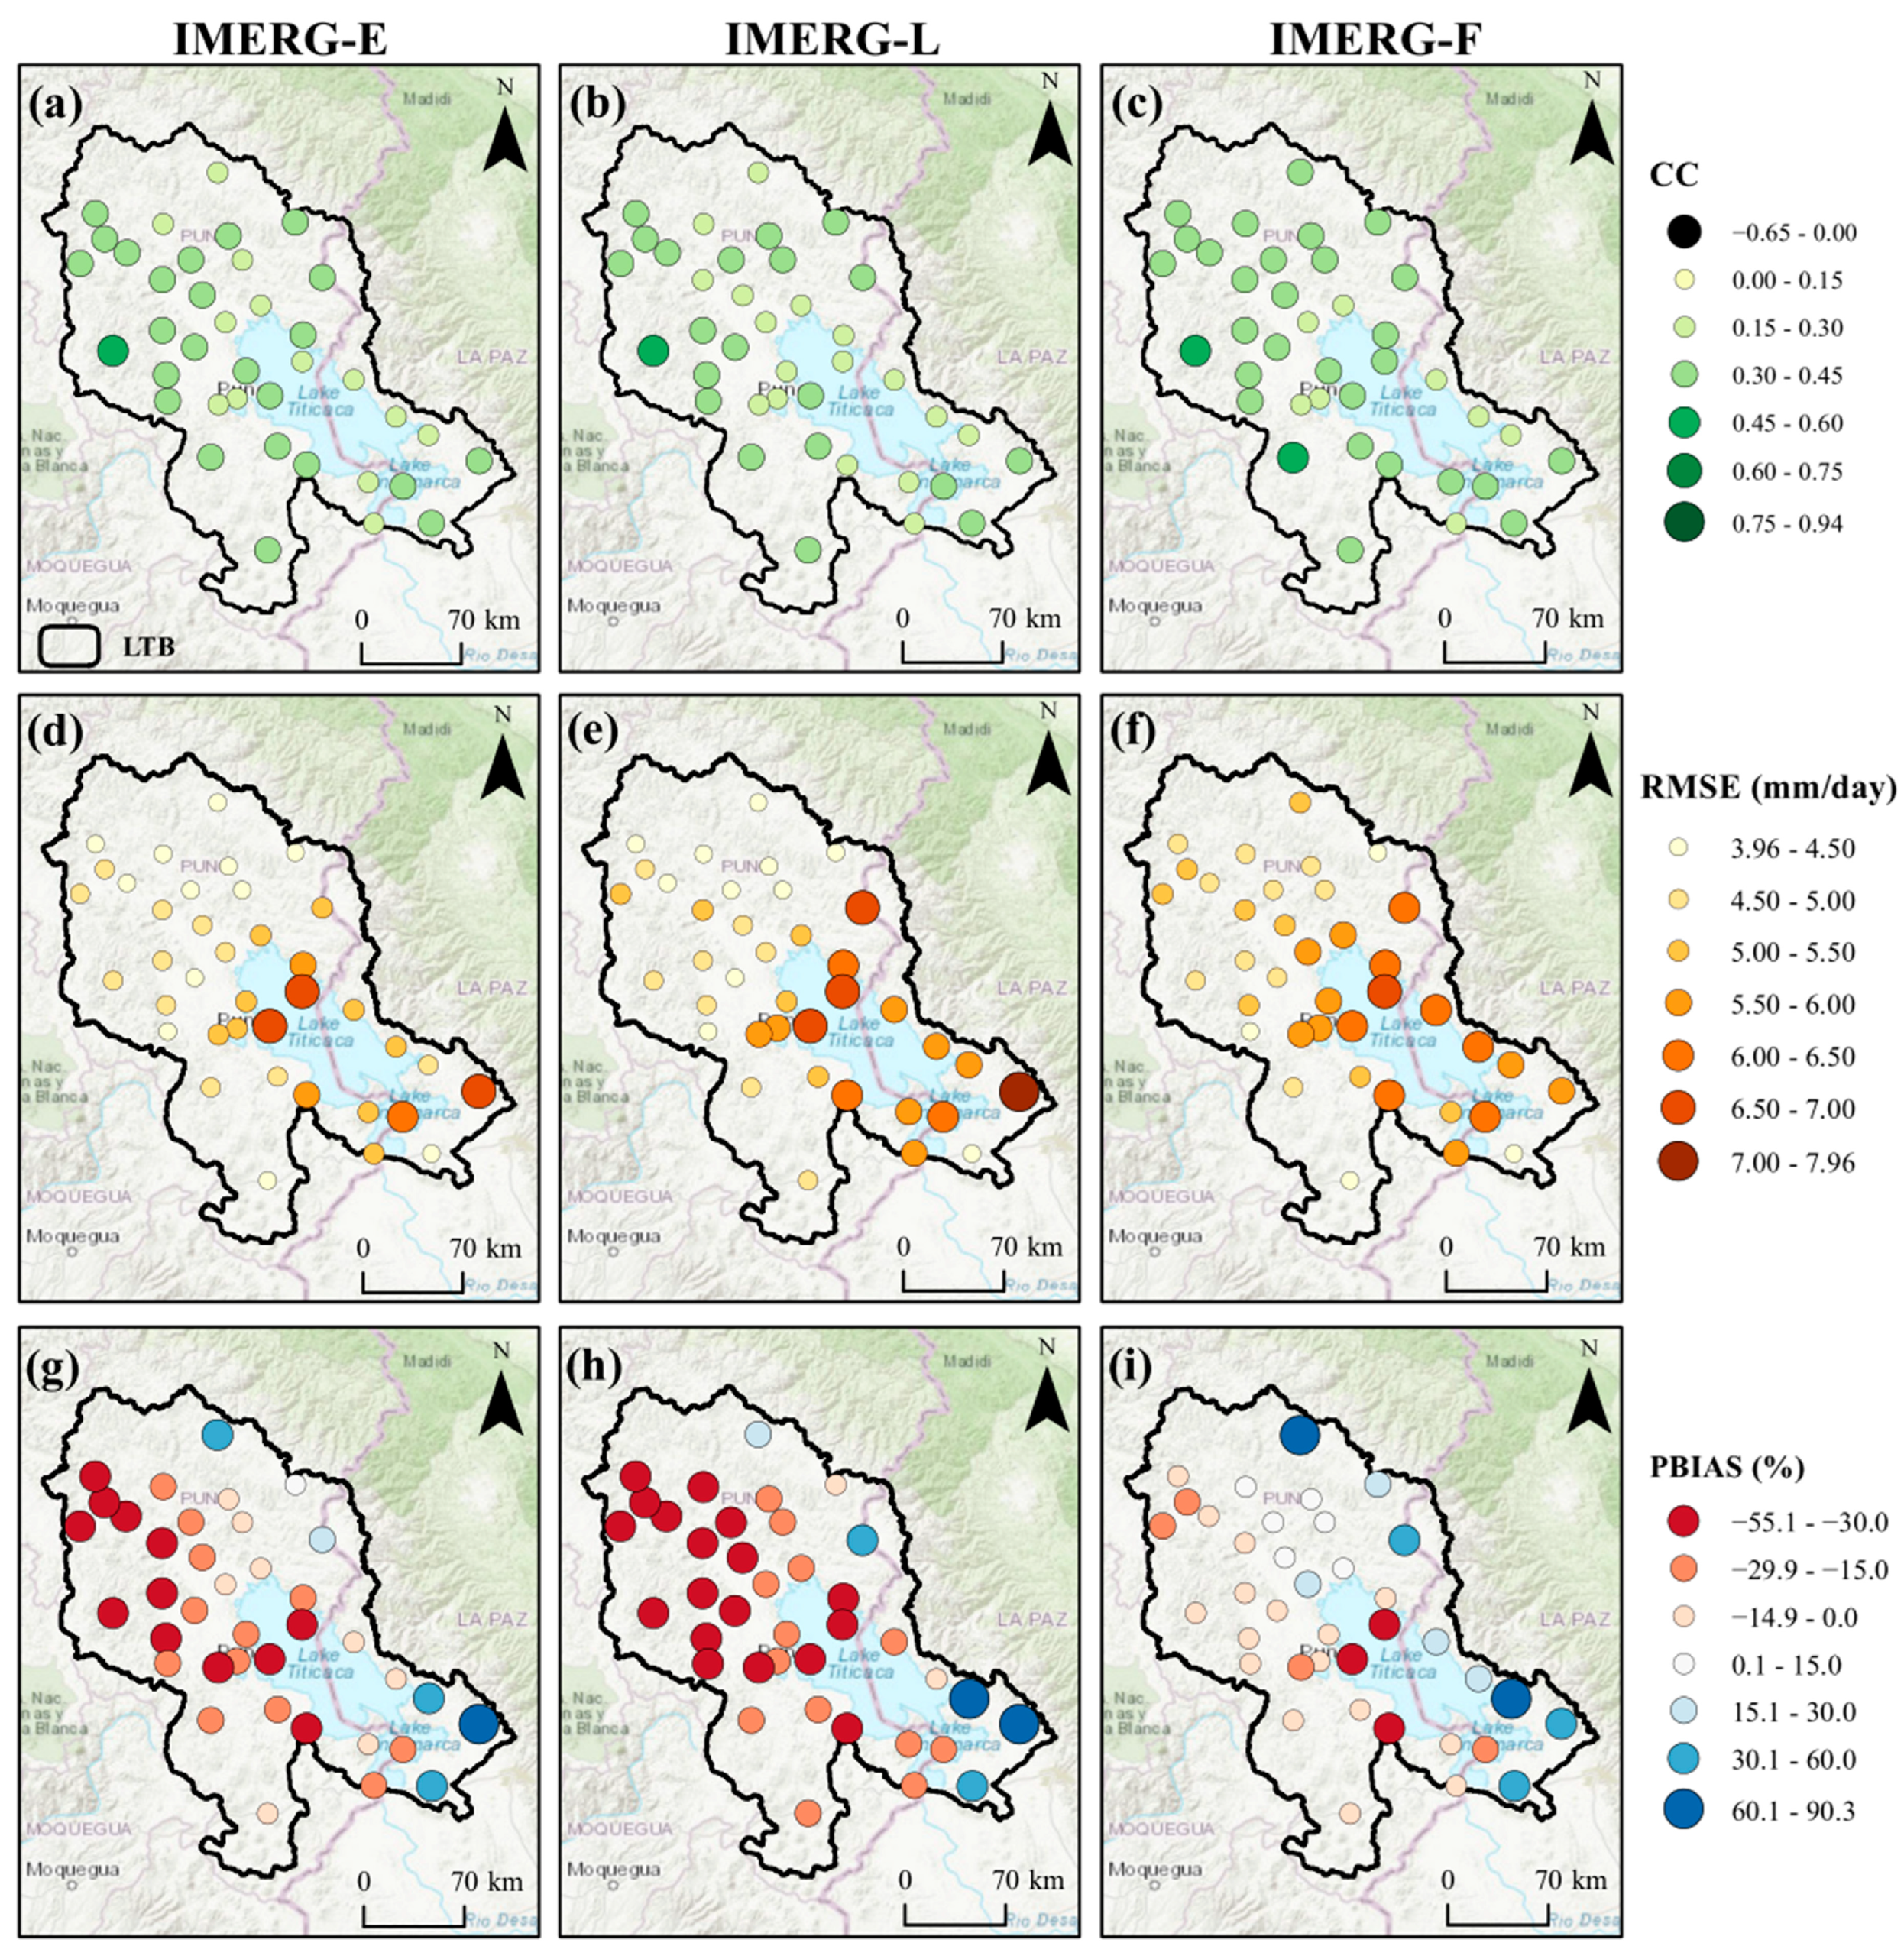
3.1. Daily Evaluation

Figure 2 shows the distribution of continuous statistical quantities compared between rain gauge measurements and the three IMERGs. In summary, the mean CC values in relation to the rain gauge for IMERG-E, IMERG-L and IMERG-F were 0.33, 0.32 and 0.35, respectively. Although low values of CC could be seen, IMERG-F appears to be more consistent with rain gauge observations at the LTB (Figure 2a–c). The mean RMSE value (Figure 2d–f) is between a range of 3.96 mm/day and 7.96 mm/day (mean 5.19 mm/day) for the three IMERGs evaluated. The spatial distribution of PBIAS (Figure 2g–i) showed an underestimation (overestimation) of precipitation at 77% (23%) (mean) of the stations, with overestimates of precipitation in the eastern and northeastern part of the LTB for all the three IMERGs. The mean PBIAS values were −13.52% (IMERG-E), −20.54% (IMERG-L) and 2.68% (IMERG-F).

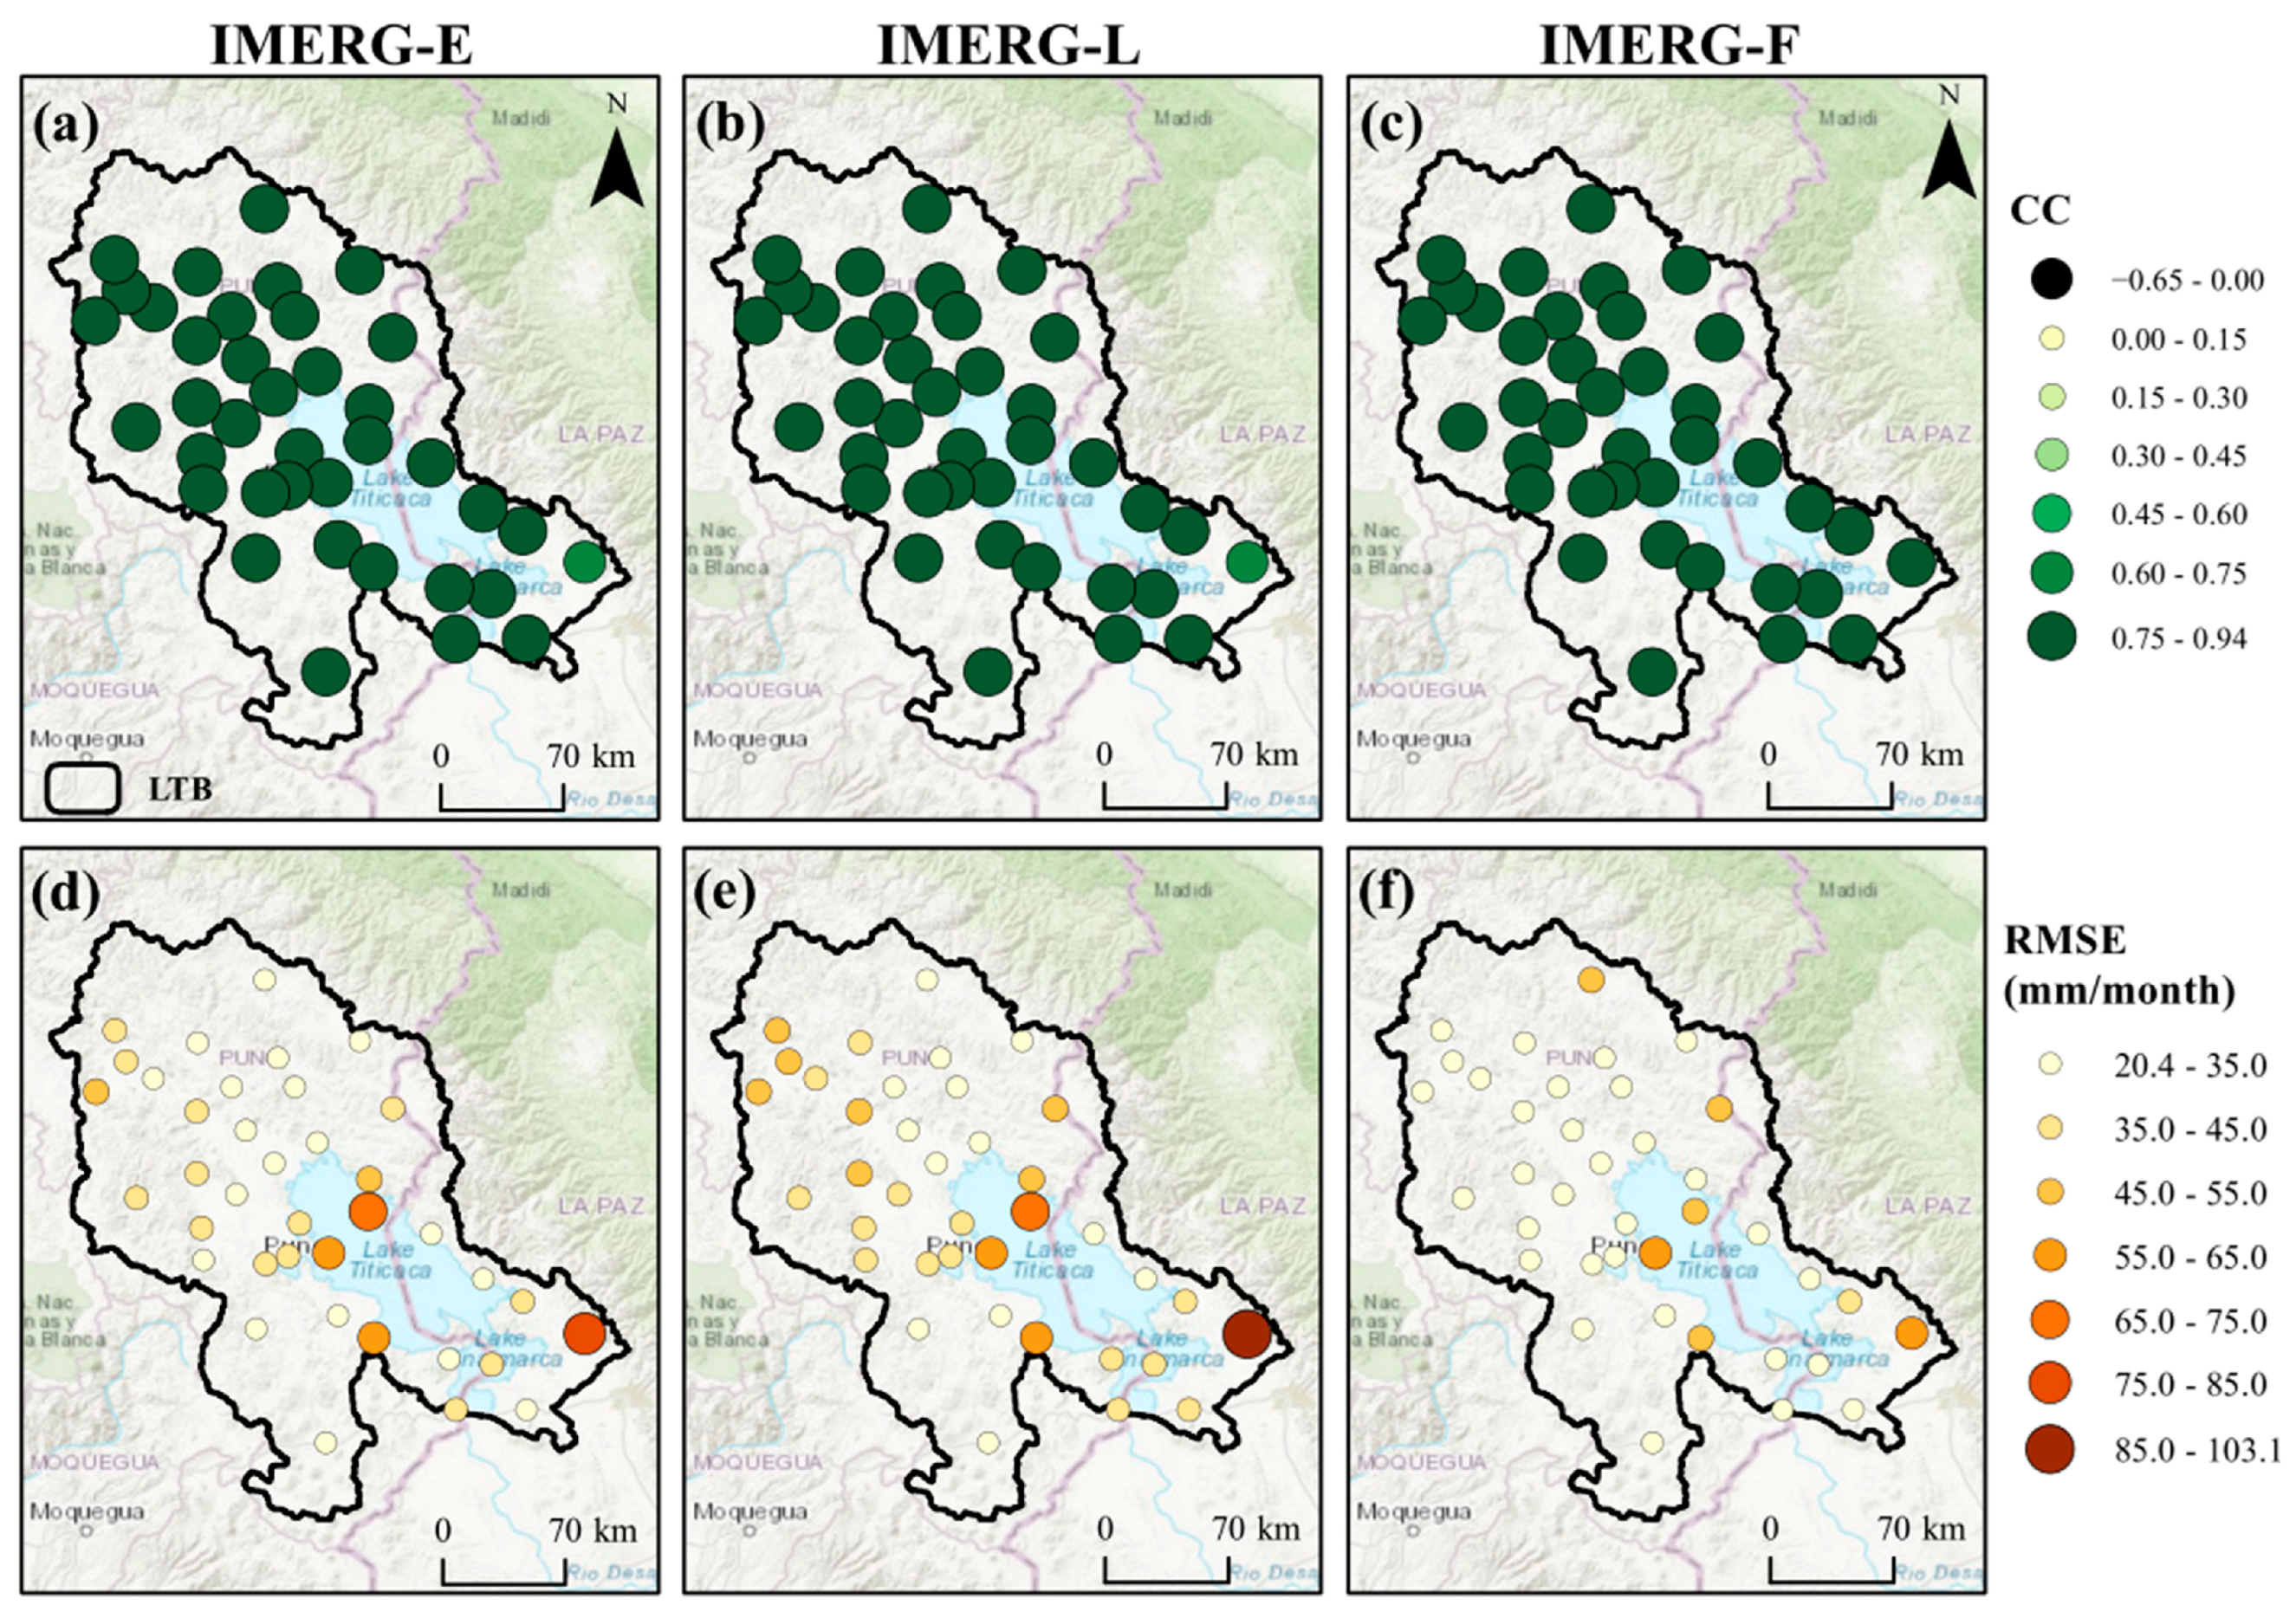
3.2. Monthly Evaluation

The results indicate that IMERG-F was relatively better. The highest correlation (Figure 3a–c) of the monthly evaluation was observed in IMERG-F data in relation to the rain gauges with a mean CC value of 0.90 (the lowest correlation was observed in IMERG-E with a mean CC value of 0.85). IMERG-F showed a correlation greater than 0.79, with a maximum value of 0.94, followed by IMERG-E with a correlation greater than 0.70 and a maximum value of 0.92, while the CC of IMERG-L was between a range of 0.68 and 0.92. The monthly RMSE results (Figure 3d–f) were between a mean range of 32.01 mm/month (IMERG-F) and 42.22 mm/month (IMERG-L) compared to the rain gauge data. IMERG-F compared to IMERG-L and E obtained lower errors at most stations (Figure 3f).

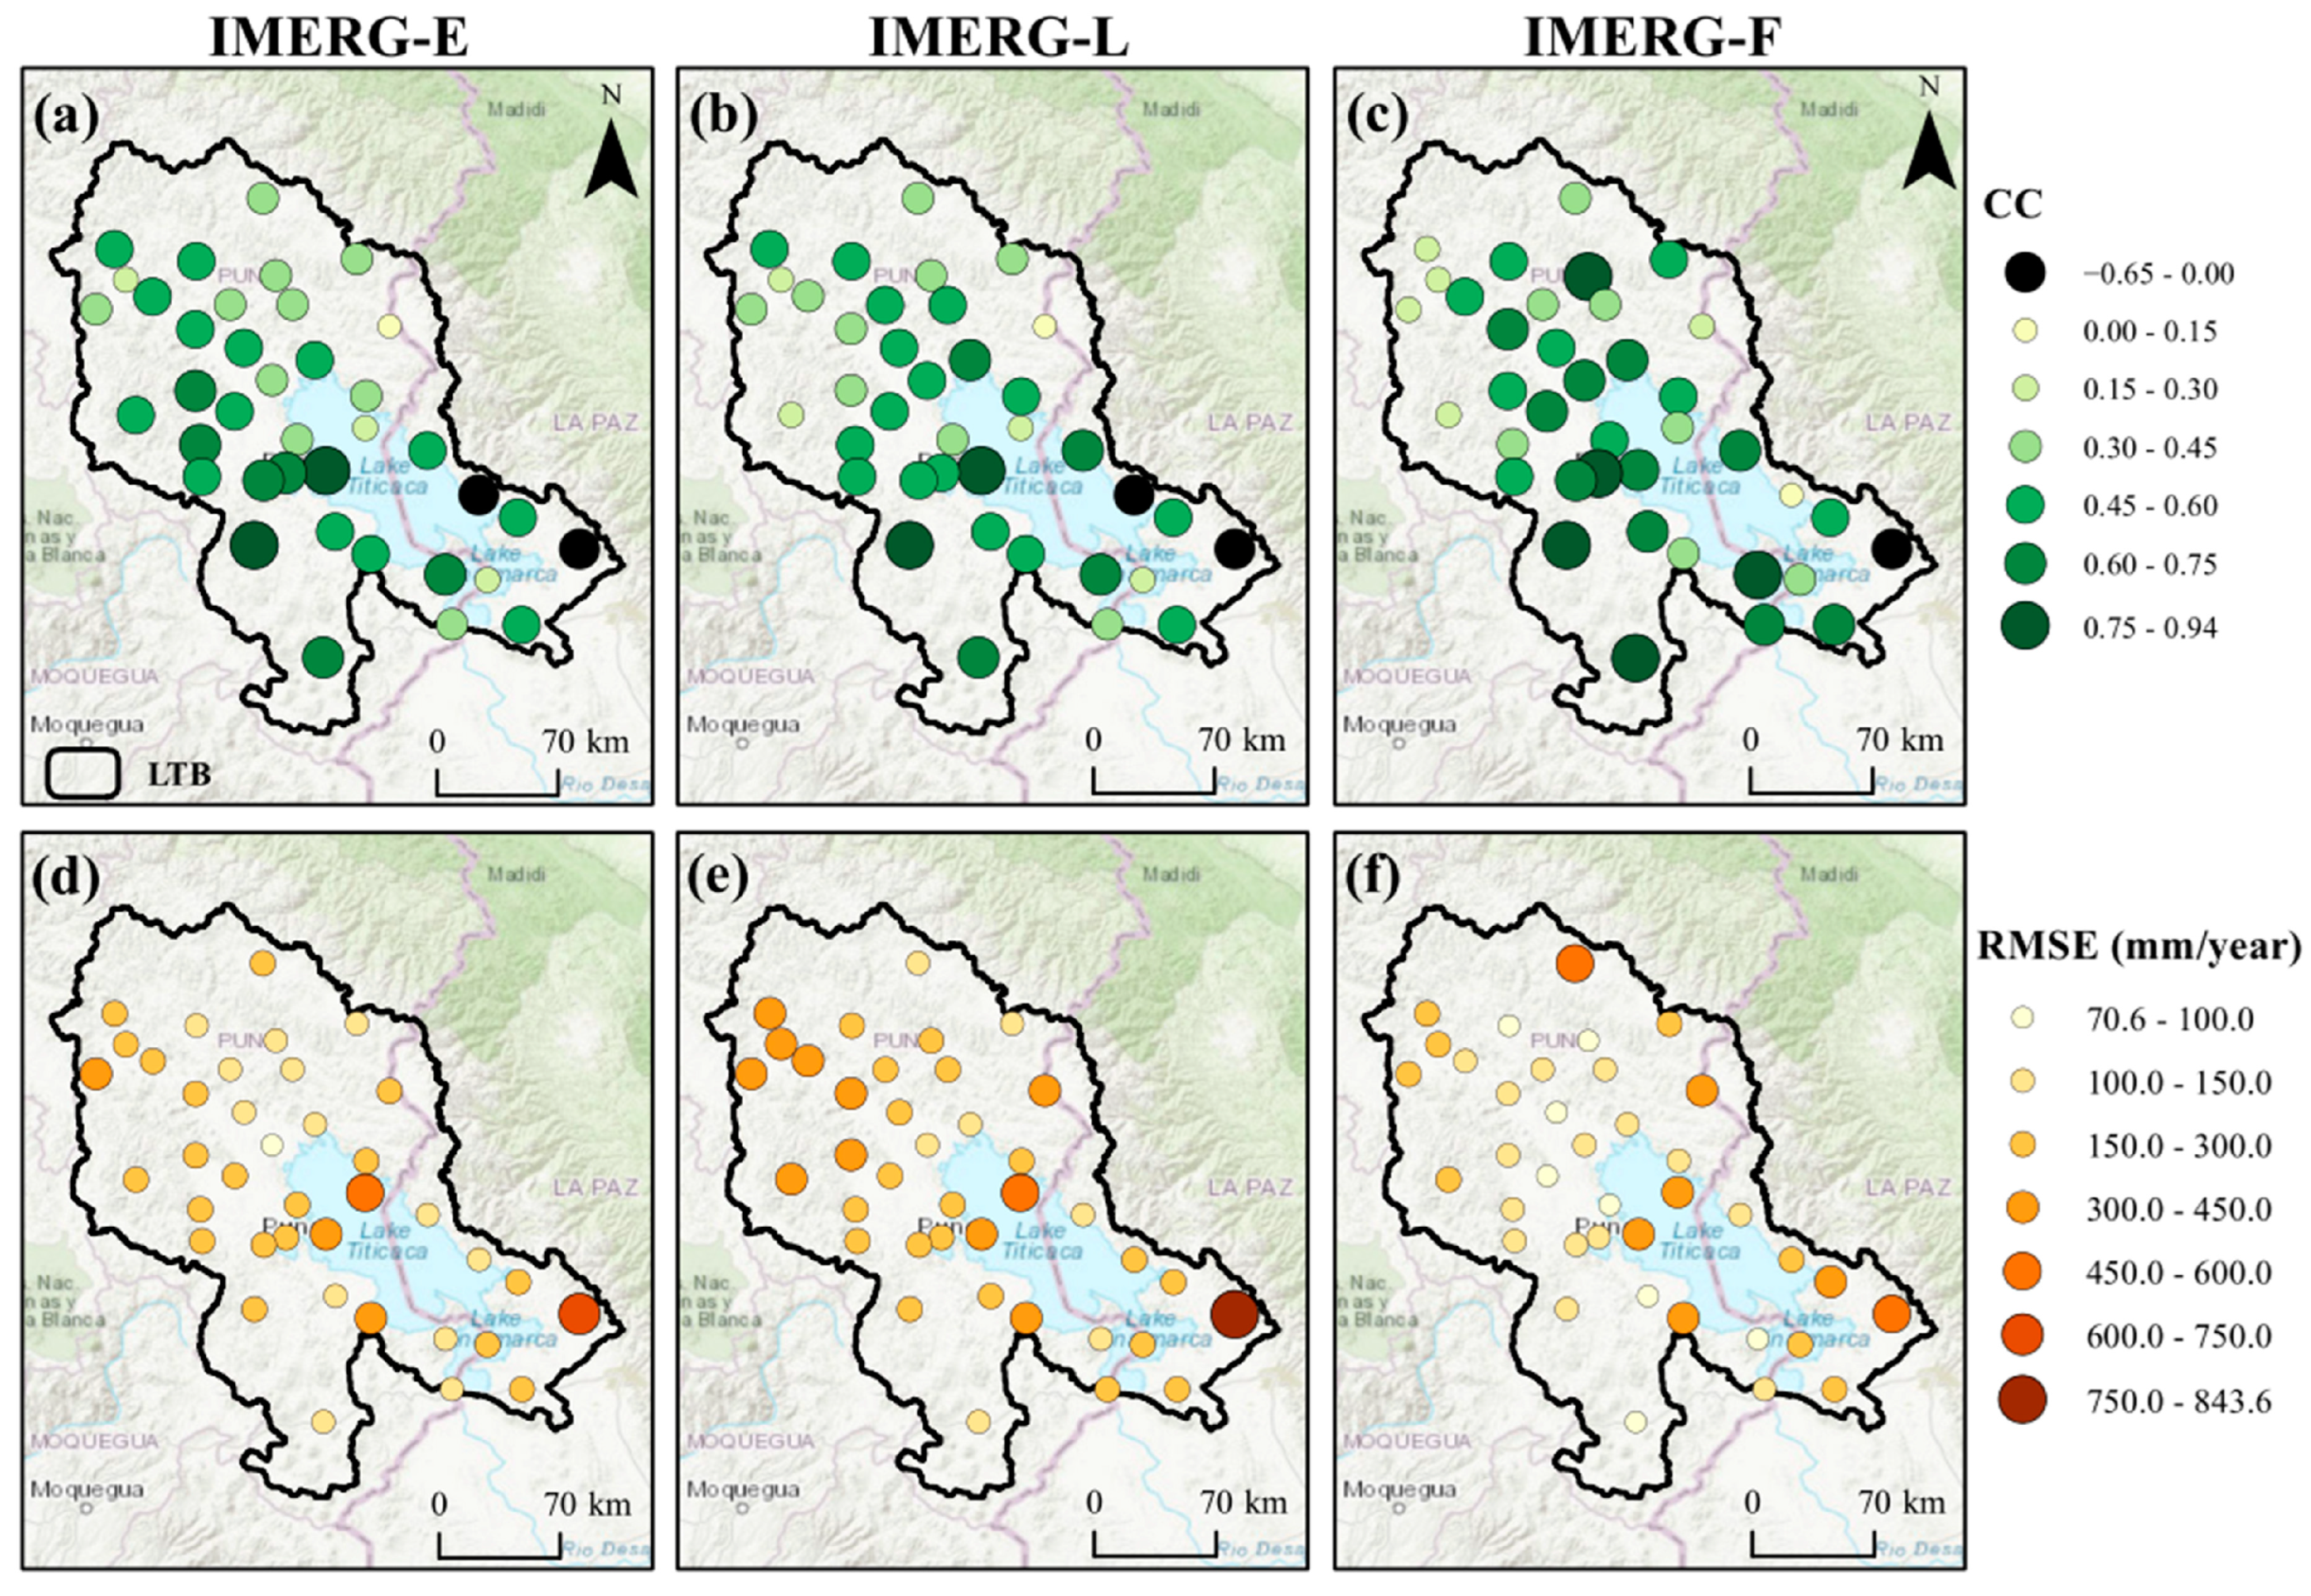
3.3. Annual Evaluation

In the annual IMERG products, the error increases and the correlation decreases with respect to the monthly evaluation, becoming worse in some stations. Figure 4 shows the spatial distribution of the continuous statistical quantities compared between annual rain gauge measurements and the three IMERGs. The highest correlation (Figure 4a–c) of the annual assessment was observed in the IMERG-F data relative to the rain gauge data with a mean CC value of 0.50 (the lowest correlation was observed in the IMERG-L with a mean CC value of 0.43). IMERG-F showed a CC between −0.55 and 0.85, followed by IMERG-E with a CC between −0.58 and 0.91, while the CC of IMERG-L ranged from −0.65 to 0.92. For IMERG-E, -L and -F, negative correlations were found at 5%, 5% and 3%, while a 3% resulted with a CC < 0.15 (0.11, 0.09 and 0.06) of the total of stations, respectively. Consequently, the CC was greater than 0.15 in 92% of the stations evaluated, with a mean of 0.51 for the three IMERGs. On the other hand, the annual RMSE results (Figure 4d–f) were between a mean range of 175.28 mm/year (IMERG-F) and 262.84 mm/year (IMERG-L) compared to the rain gauge data.

4. Discussion

Validation of precipitation products is very important for climate and hydrological studies [31]. In general, it was possible to find an accuracy of the SPP IMERG on increasing time scales (daily, monthly and annual). Performance was better for monthly data in representing local precipitation in the LTB. The accuracy of the monthly IMERG data relative to the rain gauge data shows variance at some stations, and on average the CC at a monthly scale shows a high acceptance value unlike the other scales (i.e., monthly > annual > daily). This is similar to what was reported at other places [16,17,19]. However, when evaluating the annual IMERG data, negative values of CC and close to zero were found, indicating a deficiency in the measurement of annual precipitation by IMERG. The accuracy of IMERG is good with higher latency and lower with medium latency (i.e., IMERG-F > IMERG-E > IMERG-L), which is why IMERG-F is recommended for use in the LTB. The main reason for the difference in performance is that SPPs are calibrated with terrestrial data [23]. However, the choice of IMERG product will depend, to a greater extent, on the type of application in the LTB. The accuracy of IMERG data may also be affected by the magnitude of precipitation, and there are indeed considerable biases for all the latencies.

5. Conclusions

In this study, the evaluation of the GPM IMERG performance over the lake Titicaca Basin at different time scales was performed by validating an IMERG grid point with rain gauge measurements.
This study concluded that in general, IMERG products provide a valuable opportunity to understand the precipitation characteristics detected by remote sensors. However, the performance could differ on different time scales, with the most promising result, according to the performance metrics, being the monthly time scale, especially IMERG-F, followed by the annual and then the daily scale. The difference between IMERG-E and IMERG-L were minimal due to the fact that they maintain a faster latency. Despite this, considerable biases can be observed in the IMERG data and in future research, bias correction is necessary before using the data for consideration in various hydrometeorological applications.

Author Contributions

Conceptualization, L.A.Q., E.P. and E.L.; methodology, L.A.Q. and E.P.; software, L.A.Q. and E.P.; validation, L.A.Q., E.P. and E.L.; formal analysis, L.A.Q., E.P. and E.L.; investigation, L.A.Q. and E.P.; data curation, L.A.Q.; writing—original draft preparation, L.A.Q. and E.P.; writing—review and editing, L.A.Q., E.P. and E.L.; visualization, L.A.Q. and E.P.; supervision, E.L. All authors have read and agreed to the published version of the manuscript.

Funding

This research received no external funding.

Institutional Review Board Statement

Not applicable.

Informed Consent Statement

Not applicable.

Data Availability Statement

Not applicable.

Acknowledgments

The authors would like to thank the Servicio Nacional de Meteorología e Hidrología of Peru and Bolivia for providing the set of rain gauge measurements and GIOVANNI—NASA for providing the SPPs GPM IMERG V06.

Conflicts of Interest

The authors declare no conflict of interest.

References

  1. Carrasco, M.; Yarlequé, C.; Posadas, A. Datos faltantes de precipitación pluvial diaria mediante la Transformada Wavelet. Rev. Peru. Geo-Atmosférica 2010, 88, 76–88. [Google Scholar]
  2. Hamill, T.; Kiladis, G. Comparison of Global Precipitation Estimates across a Range of Temporal and Spatial Scales. J. Clim. 2016, 29, 7773–7795. [Google Scholar] [CrossRef]
  3. Lee, J.; Lee, E.; Seol, K. Validation of Integrated MultisatellitE Retrievals for GPM (IMERG) by using gauge-based analysis products of daily precipitation over East Asia. Theor. Appl. Climatol. 2019, 137, 2497–2512. [Google Scholar] [CrossRef]
  4. Katiraie-boroujerdy, P.; Nasrollahi, N.; Hsu, K.; Sorooshian, S. Evaluation of satellite-based precipitation estimation over Iran. J. Arid. Environ. 2013, 97, 205–219. [Google Scholar] [CrossRef] [Green Version]
  5. Mahmoud, M.T.; Mohammed, S.A.; Hamouda, M.A.; Mohamed, M.M. Impact of topography and rainfall intensity on the accuracy of imerg precipitation estimates in an arid region. Remote Sens. 2021, 13, 13. [Google Scholar] [CrossRef]
  6. Sun, Q.; Miao, C.; Duan, Q.; Ashouri, H.; Sorooshian, S.; Hsu, K.L. A Review of Global Precipitation Data Sets: Data Sources, Estimation, and Intercomparisons. Rev. Geophys. 2018, 56, 79–107. [Google Scholar] [CrossRef] [Green Version]
  7. Ahuja, S.; Dhanya, C. Regionalization of Rainfall Using RCDA Cluster Ensemble Algorithm in India. J. Softw. Eng. Appl. 2012, 5, 568–573. [Google Scholar] [CrossRef] [Green Version]
  8. Mahmoud, M.T.; Al-Zahrani, M.A.; Sharif, H.O. Assessment of global precipitation measurement satellite products over Saudi Arabia. J. Hydrol. 2018, 559, 1–12. [Google Scholar] [CrossRef]
  9. Huffman, G.J.; Bolvin, D.T.; Braithwaite, D.; Hsu, K.L.; Joyce, R.J.; Kidd, C.; Nelkin, E.J.; Sorooshian, S.; Stocker, E.F.; Tan, J.; et al. Integrated multi-satellite retrievals for the global precipitation measurement (GPM) mission (IMERG). Satell. Precip. Meas. 2020, 1, 343–353. [Google Scholar]
  10. Chen, F.; Li, X. Evaluation of IMERG and TRMM 3B43 monthly precipitation products over mainland China. Remote Sens. 2016, 8, 472. [Google Scholar] [CrossRef] [Green Version]
  11. Gadelha, A.; Coelho, V.; Xavier, A.; Barbosa, L.; Melo, D.C.; Xuan, Y.; Huffman, G.; Petersen, W.; Almeida, C. Grid box-level evaluation of IMERG over Brazil at various space and time scales. Atmos. Res. 2019, 218, 231–244. [Google Scholar] [CrossRef] [Green Version]
  12. Li, R.; Shi, J.; Ji, D.; Zhao, T.; Plermkamon, V.; Moukomla, S.; Kuntiyawichai, K.; Kruasilp, J. Evaluation and hydrological application of TRMM and GPM precipitation products in a tropical monsoon basin of Thailand. Water 2019, 11, 818. [Google Scholar] [CrossRef] [Green Version]
  13. Moazami, S.; Najafi, M. A Comprehensive Evaluation of GPM-IMERG V06 and MRMS with Hourly Ground- Based Precipitation Observations across Canada. J. Hydrol. 2021, 594, 125929. [Google Scholar] [CrossRef]
  14. Sharifi, E.; Steinacker, R.; Saghafian, B. Assessment of GPM-IMERG and other precipitation products against gauge data under different topographic and climatic conditions in Iran: Preliminary results. Remote Sens. 2016, 8, 135. [Google Scholar] [CrossRef] [Green Version]
  15. Tan, M.; Duan, Z. Assessment of GPM and TRMM precipitation products over Singapore. Remote Sens. 2017, 9, 720. [Google Scholar] [CrossRef] [Green Version]
  16. Tan, M.; Santo, H. Comparison of GPM IMERG, TMPA 3B42 and PERSIANN-CDR satellite precipitation products over Malaysia. Atmos. Res. 2018, 202, 63–76. [Google Scholar] [CrossRef]
  17. Tang, G.; Clark, M.; Papalexiou, S.; Ma, Z.; Hong, Y. Have satellite precipitation products improved over last two decades? A comprehensive comparison of GPM IMERG with nine satellite and reanalysis datasets. Remote Sens. Environ. 2020, 240, 111697. [Google Scholar] [CrossRef]
  18. Tapiador, F.; Navarro, A.; García-Ortega, E.; Merino, A.; Sánchez, J.L.; Marcos, C.; Kummerow, C. The contribution of rain gauges in the calibration of the IMERG product: Results from the first validation over Spain. J. Hydrometeorol. 2020, 21, 161–182. [Google Scholar] [CrossRef]
  19. Veloria, A.; Perez, G.; Tapang, G.; Comiso, J. Improved rainfall data in the Philippines through concurrent use of GPM IMERG and ground-based measurements. Remote Sens. 2021, 13, 2859. [Google Scholar] [CrossRef]
  20. Wang, W.; Lu, H.; Zhao, T.; Jiang, L.; Shi, J. Evaluation and comparison of daily rainfall from latest GPM and TRMM products over the Mekong River Basin. IEEE J. Sel. Top. Appl. Earth Obs. Remote Sens. 2017, 10, 2540–2549. [Google Scholar] [CrossRef]
  21. Xu, S.; Shen, Y.; Niu, Z. Evaluation of the IMERG version 05B precipitation product and comparison with IMERG version 04A over mainland China at hourly and daily scales. Adv. Space Res. 2019, 63, 2387–2398. [Google Scholar] [CrossRef]
  22. Yuan, F.; Zhang, L.; Soe, K.M.; Ren, L.; Zhao, C.; Zhu, Y.; Jiang, S.; Liu, Y. Applications of TRMM- and GPM-era multiple- satellite precipitation products for flood simulations at sub-daily scales in a sparsely gauged watershed in Myanmar. Remote Sens. 2019, 11, 140. [Google Scholar] [CrossRef] [Green Version]
  23. Zhou, Z.; Guo, B.; Xing, W.; Zhou, J.; Xu, F.; Xu, Y. Comprehensive evaluation of latest GPM era IMERG and GSMaP precipitation products over mainland China. Atmos. Res. 2020, 246, 105132. [Google Scholar] [CrossRef]
  24. Asurza, F.; Ramos, C.; Lavado, W. Assessment of Tropical Rainfall Measuring Mission (TRMM) and Global Precipitation Measurement (GPM) products in hydrological modeling of the Huancane river basin, Peru. Sci. Agropecu. 2018, 9, 53–62. [Google Scholar] [CrossRef]
  25. Jarvis, A.; Reuter, H.; Nelson, A.; Guevara, E. Hole-Filled Seamless SRTM Data V4, International Centre for Tropical Agriculture (CIAT). 2008. Available online: http://srtm.csi.cgiar.org (accessed on 16 September 2022).
  26. Sungmin, O.; Foelsche, U.; Kirchengast, G.; Fuchsberger, J.; Tan, J.; Petersen, W.A. Evaluation of GPM IMERG Early, Late, and Final rainfall estimates using WegenerNet gauge data in southeastern Austria. Hydrol. Earth Syst. Sci. 2017, 21, 6559–6572. [Google Scholar] [CrossRef] [Green Version]
  27. Chiew, F.; Siriwardena, L. Trend/Change Detection Software. USER GUIDE; CRC for Catchment Hydrology: Clayton, Australia, 2005. [Google Scholar]
  28. van Buuren, S.; Groothuis-Oudshoorn, K. Mice: Multivariate imputation by chained equations in R. J. Stat. Softw. 2011, 45, 1–67. [Google Scholar] [CrossRef] [Green Version]
  29. Tomas-Burguera, M.; Vicente-Serrano, S.M.; Beguería, S.; Reig, F.; Latorre, B. Reference 634 crop evapotranspiration database in Spain (1961–2014). Earth Syst. Sci. Data 2019, 11, 1917–1930. [Google Scholar] [CrossRef] [Green Version]
  30. Woldesenbet, T.A.; Elagib, N.A.; Ribbe, L.; Heinrich, J. Gap filling and homogenization of climatological datasets in the headwater region of the Upper Blue Nile Basin, Ethiopia. Int. J. Climatol. 2017, 37, 2122–2140. [Google Scholar] [CrossRef]
  31. Wong, J.S.; Razavi, S.; Bonsal, B.R.; Wheater, H.S.; Asong, Z.E. Inter-comparison of daily precipitation products for large-scale hydro-climatic applications over Canada. Hydrol. Earth Syst. Sci. 2017, 21, 2163–2185. [Google Scholar] [CrossRef] [Green Version]
Figure 1. Location of LTB with weather stations in relation to South America.
Environsciproc 25 00065 g001
Figure 2. Spatial distribution of CC (ac), RMSE (df) and PBIAS (gi) of daily rain gauge data in relation to IMERG.
Environsciproc 25 00065 g002
Figure 3. Spatial distribution of CC (ac) and RMSE (df) of monthly rain gauge data in relation to IMERG.
Environsciproc 25 00065 g003
Figure 4. Spatial distribution of CC (ac) and RMSE (df) of annual rain gauge data in relation to IMERG.
Environsciproc 25 00065 g004
Table 1. Statistical performance metrics.
MetricsEquationRangeOptimal Value
Root mean square error (RMSE) R M S E = 1 n   i = 1 n ( O i S i ) 2 0.0 to ∞0.0
Correlation coefficient (CC) C C = i = 1   n O i O ¯ S i S ¯ i = 1 n O i O ¯ 2   i = 1 n S i S ¯ 2 −1.0 to 1.01.0
Percentage bias (PBIAS) P B I A S = i = 1 n O i S i i = 1 n O i ×   100 −∞ to ∞0.0
S is the satellite measurement; O the rain gauge measurement; S ¯ and O ¯ denote the mean values of S and O respectively; n indicates the number of data pairs.
Disclaimer/Publisher’s Note: The statements, opinions and data contained in all publications are solely those of the individual author(s) and contributor(s) and not of MDPI and/or the editor(s). MDPI and/or the editor(s) disclaim responsibility for any injury to people or property resulting from any ideas, methods, instructions or products referred to in the content.

