
A GIS-Based Fuzzy Hierarchical Modeling for Flood Susceptibility Mapping: A Case Study in Ontario, Eastern Canada †


Abstract
:1. Introduction
2. Materials and Methods
2.1. Study Area
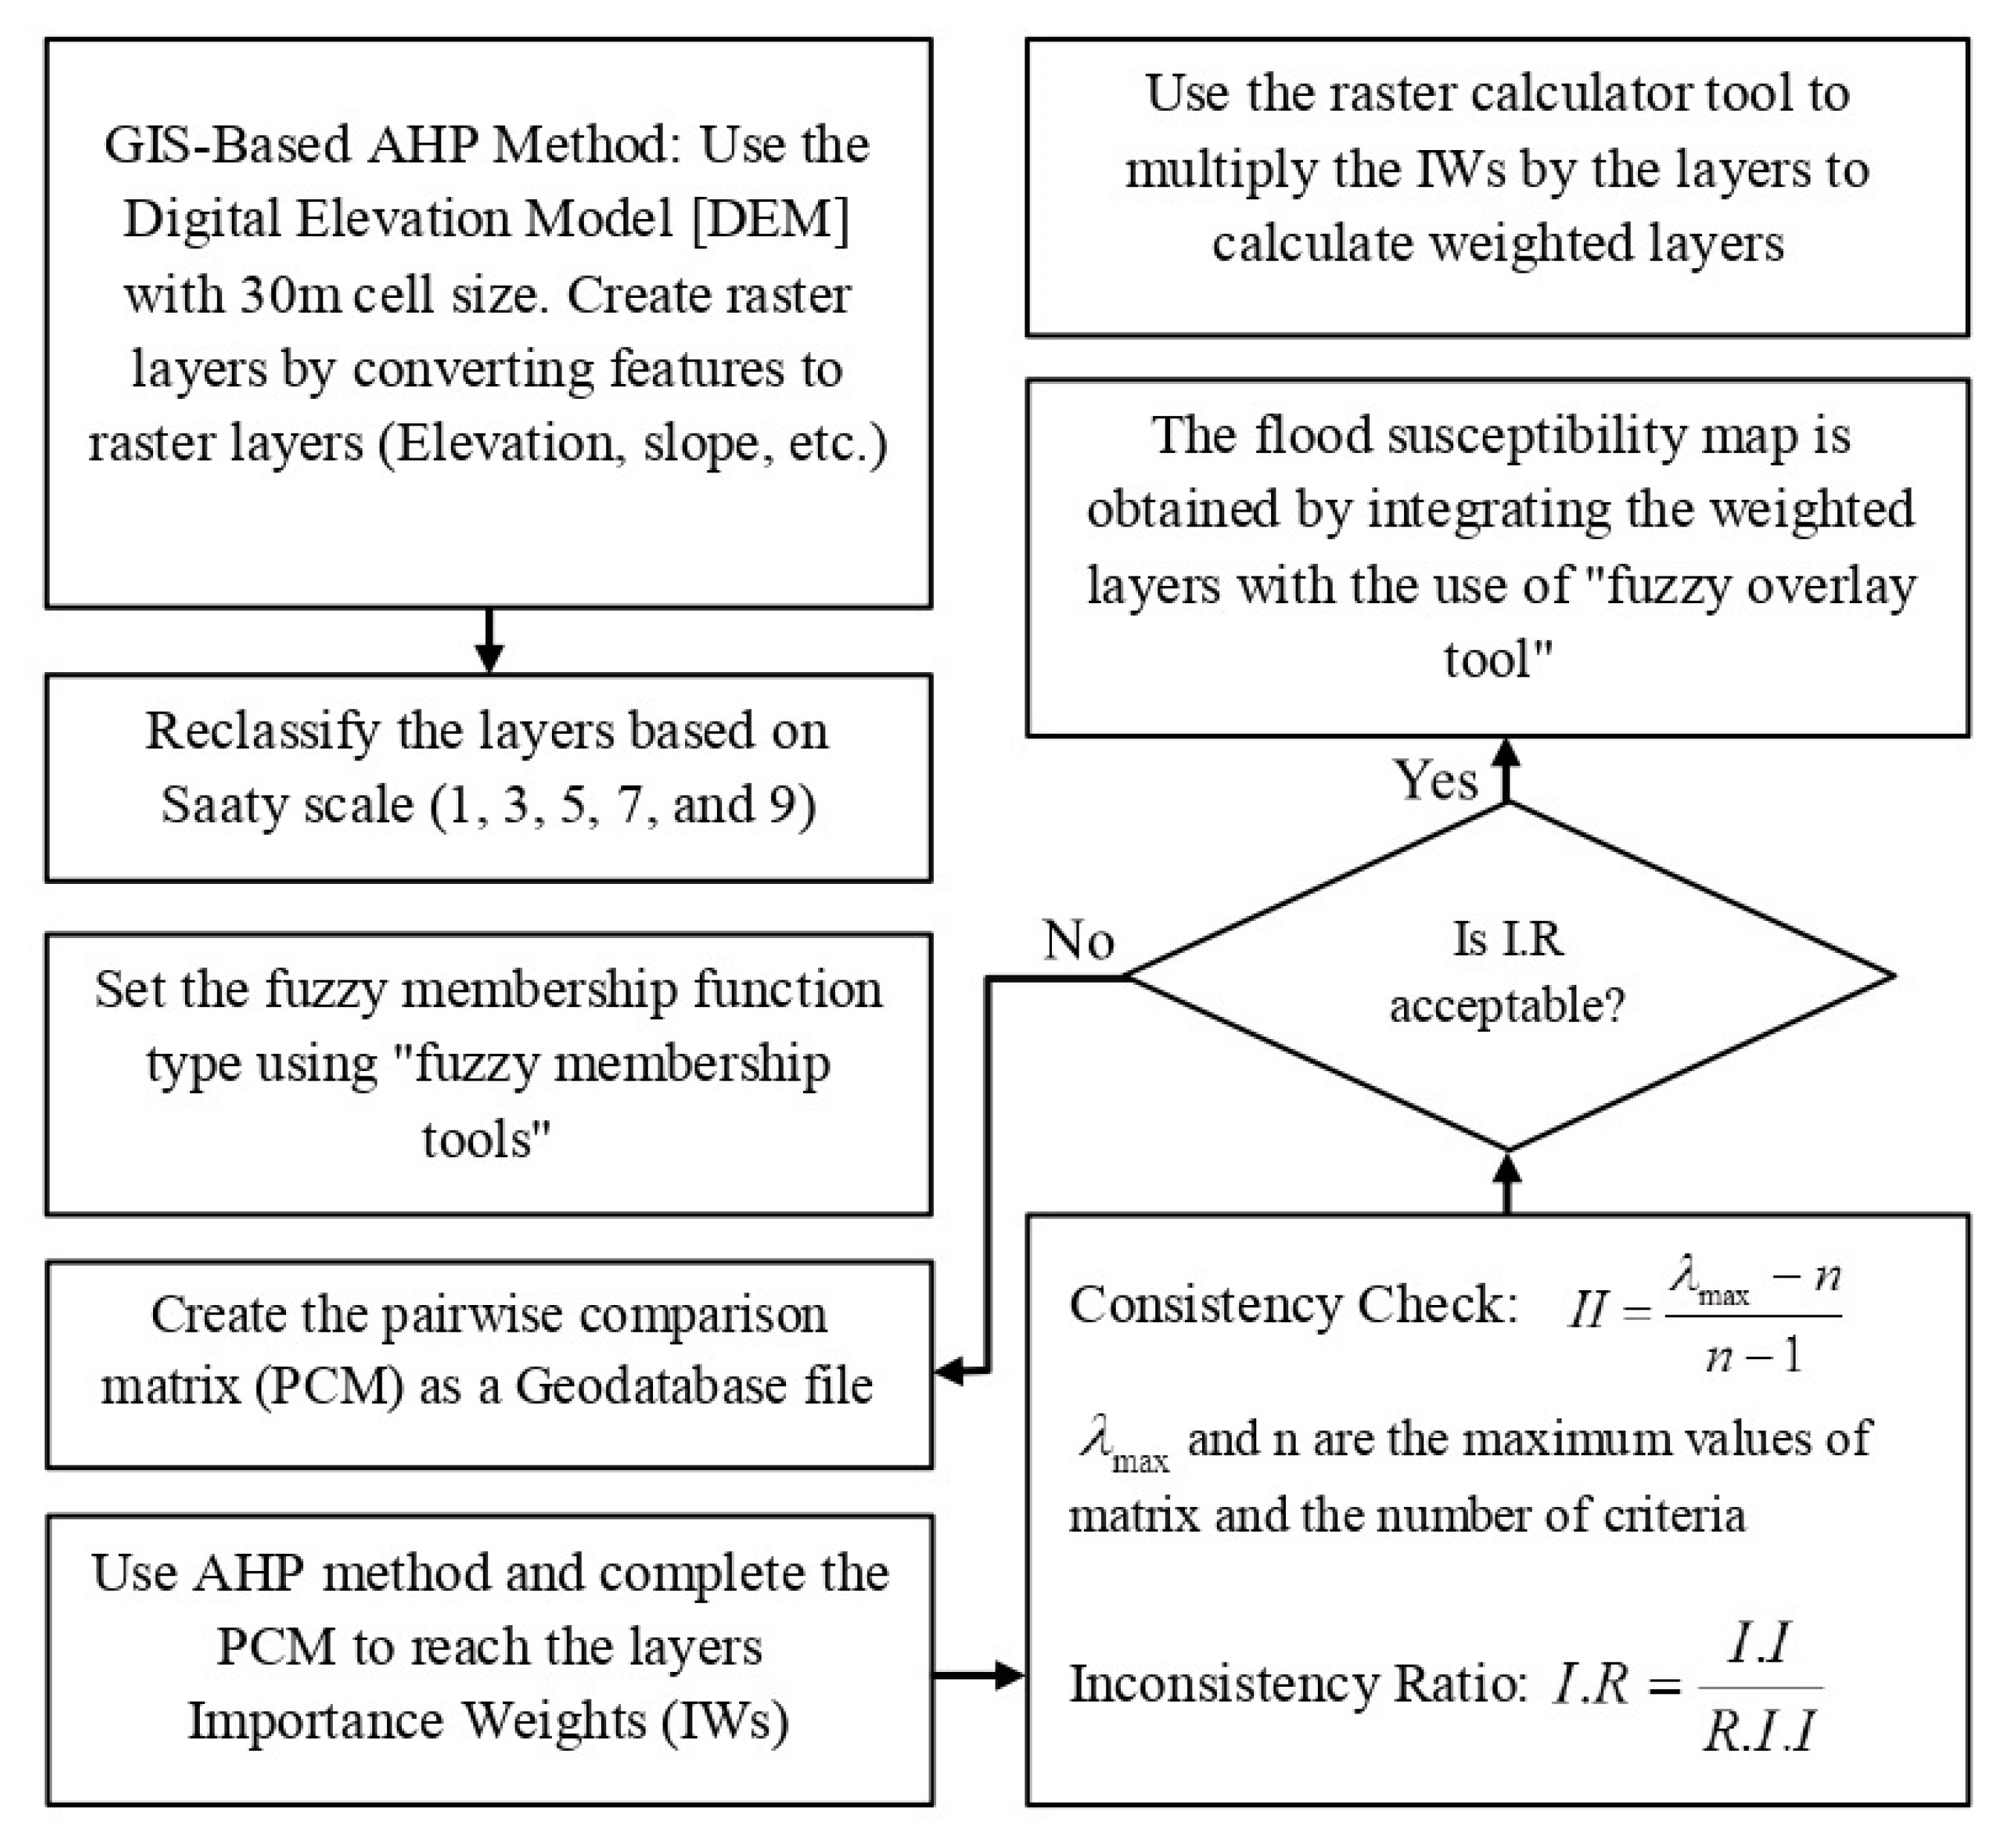
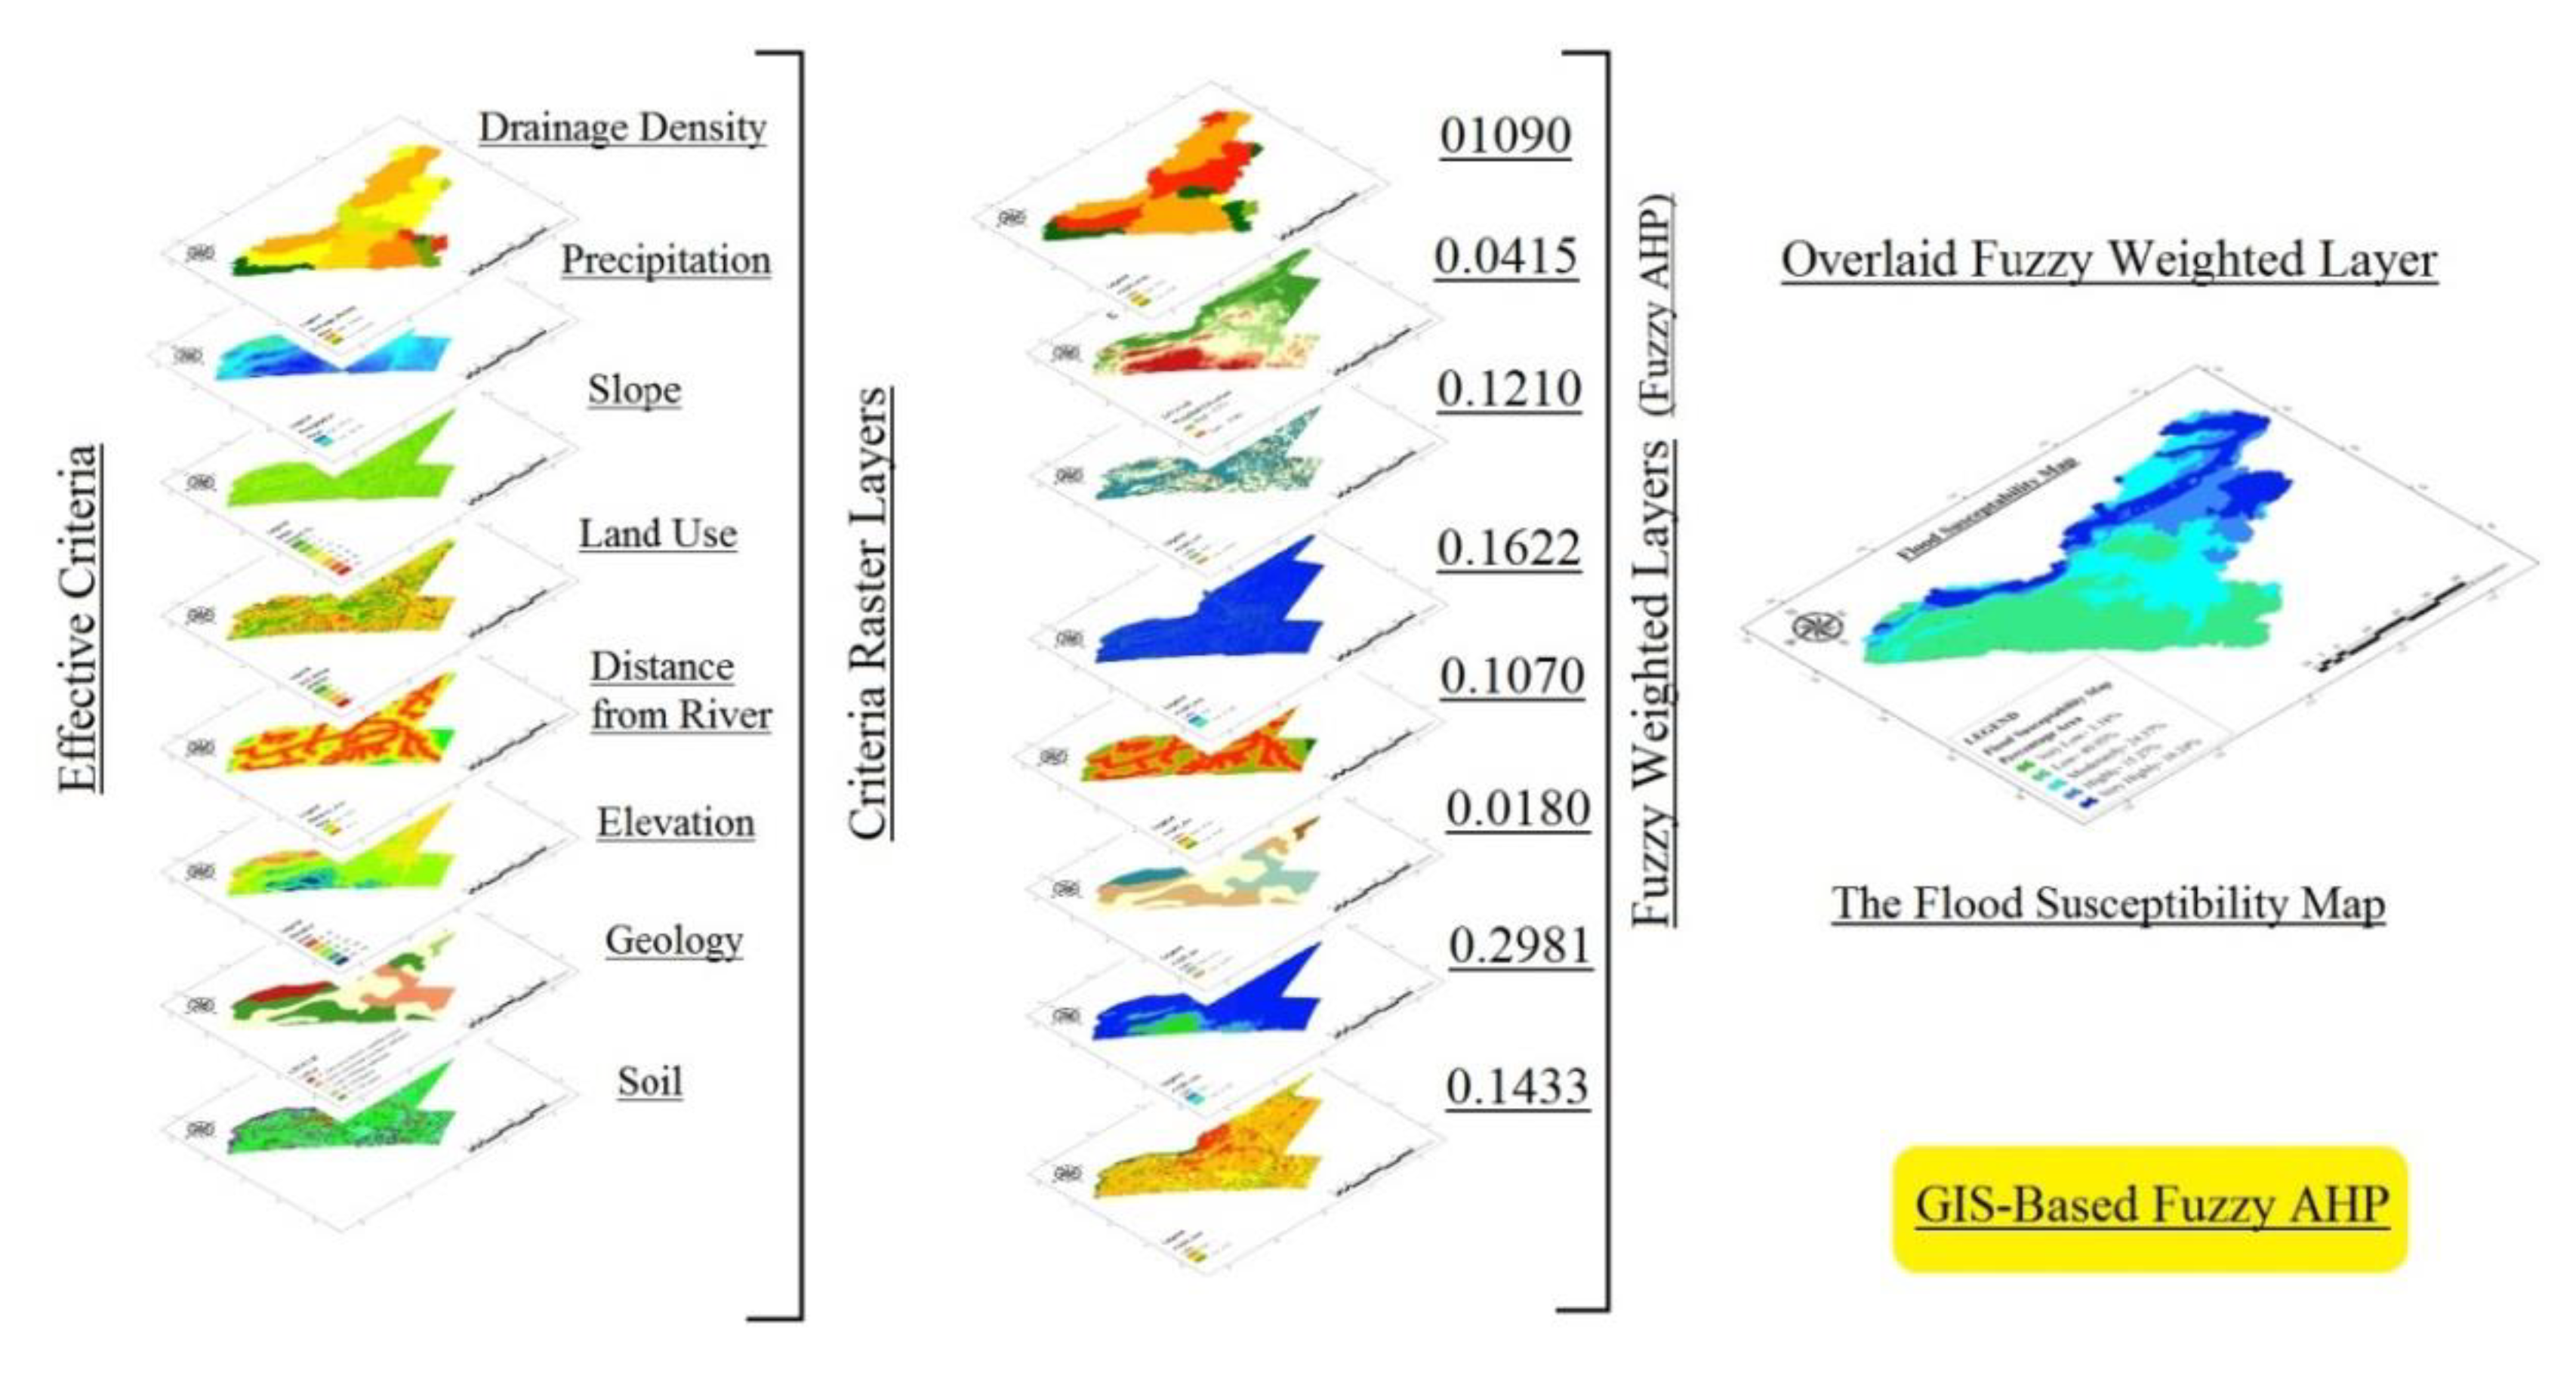
2.2. Methodology
3. Results and Discussion
4. Conclusions
Author Contributions
Funding
Institutional Review Board Statement
Informed Consent Statement
Data Availability Statement
Conflicts of Interest
References
- Yahaya, S.; Ahmad, N.; Abdalla, R.F. Multicriteria analysis for flood vulnerable areas in Hadejia-Jama’are River basin, Nigeria. Eur. J. Sci. Res. 2010, 42, 71–83. [Google Scholar]
- Rahmati, O.; Haghizadeh, A.; Stefanidis, S. Assessing the Accuracy of GIS-Based Analytical Hierarchy Process for Watershed Prioritization; Gorganrood River Basin, Iran. Water Resour. Manag. 2016, 30, 1131–1150. [Google Scholar] [CrossRef]
- Green, C.H.; Parker, D.J.; Tunstall, S.M. Assessment of flood control and management options. Thematic Review IV.4 prepared as an input to the World Commission on Dams, Cape Town. Available online: https://citeseerx.ist.psu.edu/document?repid=rep1&type=pdfdoi=4dc46bb21cde02a58213f2adba2d1216216a7529 (accessed on 1 November 2000).
- Fekete, A.; Sandholz, S. Here Comes the Flood, but Not Failure? Lessons to Learn after the Heavy Rain and Pluvial Floods in Germany 2021. Water 2021, 13, 3016. [Google Scholar] [CrossRef]
- Swain, K.; Singha, C.; Nayak, L. Flood Susceptibility Mapping through the GIS-AHP Technique Using the Cloud. ISPRS Int. J. Geo-Inf. 2020, 9, 720. [Google Scholar] [CrossRef]
- Black, R.; Kniveton, D.; Schmidt-Verkerk, K. Migration and Climate Change: Towards an Integrated Assessment of Sensitivity. Environ. Plan. A Econ. Space 2011, 43, 431–450. [Google Scholar] [CrossRef]
- Hapuarachchi, H.A.P.; Wang, Q.J.; Pagano, T.C. A review of advances in flash flood forecasting. Hydrol. Process. 2011, 25, 2771–2784. [Google Scholar] [CrossRef]
- Bout, B.; Jetten, V. The validity of flow approximations when simulating catchment-integrated flash floods. J. Hydrol. 2018, 556, 674–688. [Google Scholar] [CrossRef]
- Saaty, T.L.; Vargas, L.G. The possibility of group choice: Pairwise comparisons and merging functions. Soc. Choice Welf. 2012, 38, 481–496. [Google Scholar] [CrossRef]
- Salimi, A.H.; Noori, A.; Bonakdari, H.; Samakosh, J.M.; Sharifi, E.; Hassanvand, M.; Gharabaghi, B.; Agharazi, M. Exploring the Role of Advertising Types on Improving the Water Consumption Behavior: An Application of Integrated Fuzzy AHP and Fuzzy VIKOR Method. Sustainability 2020, 12, 1232. [Google Scholar] [CrossRef]
- Al-Abadi, A.M.; Shahid, S.; Al-Ali, A.K. A GIS-based integration of catastrophe theory and analytical hierarchy process for mapping flood susceptibility: A case study of Teeb area, Southern Iraq. Environ. Earth Sci. 2016, 75, 687. [Google Scholar] [CrossRef]
- Noori, A.; Bonakdari, H.; Morovati, K.; Gharabaghi, B. The optimal dam site selection using a group decision-making method through fuzzy TOPSIS model. Environ. Syst. Decis. 2018, 38, 471–488. [Google Scholar] [CrossRef]
- Noori, A.; Bonakdari, H.; Salimi, A.H.; Gharabaghi, B. A group Multi-Criteria Decision-Making method for water supply choice optimization. Socio-Econ. Plan. Sci. 2021, 77, 101006. [Google Scholar] [CrossRef]
- Li, Q.; Zhou, J.; Liu, D.; Jiang, X. Research on flood risk analysis and evaluation method based on variable fuzzy sets and information diffusion. Saf. Sci. 2012, 50, 1275–1283. [Google Scholar] [CrossRef]
- Noori, A.; Bonakdari, H.; Hassaninia, M.; Morovati, K.; Khorshidi, I.; Noori, A.; Gharabaghi, B. A reliable GIS-based FAHP-FTOPSIS model to prioritize urban water supply management scenarios: A case study in semi-arid climate. Sustain. Cities Soc. 2022, 81, 103846. [Google Scholar] [CrossRef]
- Zou, Q.; Zhou, J.; Zhou, C.; Song, L.; Guo, J. Comprehensive flood risk assessment based on set pair analysis-variable fuzzy sets model and fuzzy AHP. Stoch. Environ. Res. Risk Assess. 2013, 27, 525–546. [Google Scholar] [CrossRef]
- Hammami, S.; Zouhri, L.; Souissi, D.; Souei, A.; Zghibi, A.; Marzougui, A.; Dlala, M. Application of the GIS based multi-criteria decision analysis and analytical hierarchy process (AHP) in the flood susceptibility mapping (Tunisia). Arab. J. Geosci. 2019, 12, 653. [Google Scholar] [CrossRef]
- Msabi, M.M.; Makonyo, M. Flood susceptibility mapping using GIS and multi-criteria decision analysis: A case of Dodoma region, central Tanzania. Remote Sens. Appl. Soc. Environ. 2021, 21, 100445. [Google Scholar] [CrossRef]
- Souissi, D.; Zouhri, L.; Hammami, S.; Msaddek, M.H.; Zghibi, A.; Dlala, M. GIS-based MCDM—AHP modeling for flood susceptibility mapping of arid areas, southeastern Tunisia. Geocarto Int. 2020, 35, 991–1017. [Google Scholar] [CrossRef]
- Rincón, D.; Khan, U.T.; Armenakis, C. Flood Risk Mapping Using GIS and Multi-Criteria Analysis: A Greater Toronto Area Case Study. Geosciences 2018, 8, 275. [Google Scholar] [CrossRef]
- Drobne, S.; Lisec, A. Multi-attribute decision analysis in GIS: Weighted linear combination and ordered weighted averaging. Informatica 2009, 33, 459–474. [Google Scholar]
- Noori, A.; Bonakdari, H.; Morovati, K.; Gharabaghi, B. Development of optimal water supply plan using integrated fuzzy Delphi and fuzzy ELECTRE III methods—Case study of the Gamasiab basin. Expert Syst. 2020, 37, e12568. [Google Scholar] [CrossRef]
- Saaty, T.L. Planning, Priority Setting, Resource Allocation; RWS Publications: Pittsburgh, PA, USA, 1980; p. 281. [Google Scholar]
- de Voogd, N.; Rooijen, H.D. Thin-layer response and spectral bandwidth. Geophysics 1983, 48, 12–18. [Google Scholar] [CrossRef]
- Elkhrachy, I. Flash Flood Hazard Mapping Using Satellite Images and GIS Tools: A case study of Najran City, Kingdom of Saudi Arabia (KSA). Egypt. J. Remote Sens. Space Sci. 2015, 18, 261–278. [Google Scholar] [CrossRef]


| Numerical Value | Definition |
|---|---|
| 1 | Equal important |
| 3 | Weakly more important |
| 5 | Strongly more important |
| 7 | Very Strongly more important |
| 9 | Absolutely more important |
| 2, 4, 6, and 8 | Intervals of adjacent expressions |
| n | 1 | 2 | 3 | 4 | 5 | 6 | 7 | 8 | 9 | 10 |
|---|---|---|---|---|---|---|---|---|---|---|
| R.I.I | 0 | 0 | 0.58 | 0.9 | 1.12 | 1.24 | 1.32 | 1.41 | 1.45 | 1.49 |
| Criteria | References | Attribute Class |
|---|---|---|
| Slope | Digital Elevation Model (DEM) of Canada, cell size 30 m | It is of greater significance to have a lower value Slopes 0–2%: the most critical, Slopes exceeding 45%: the least significant [15] |
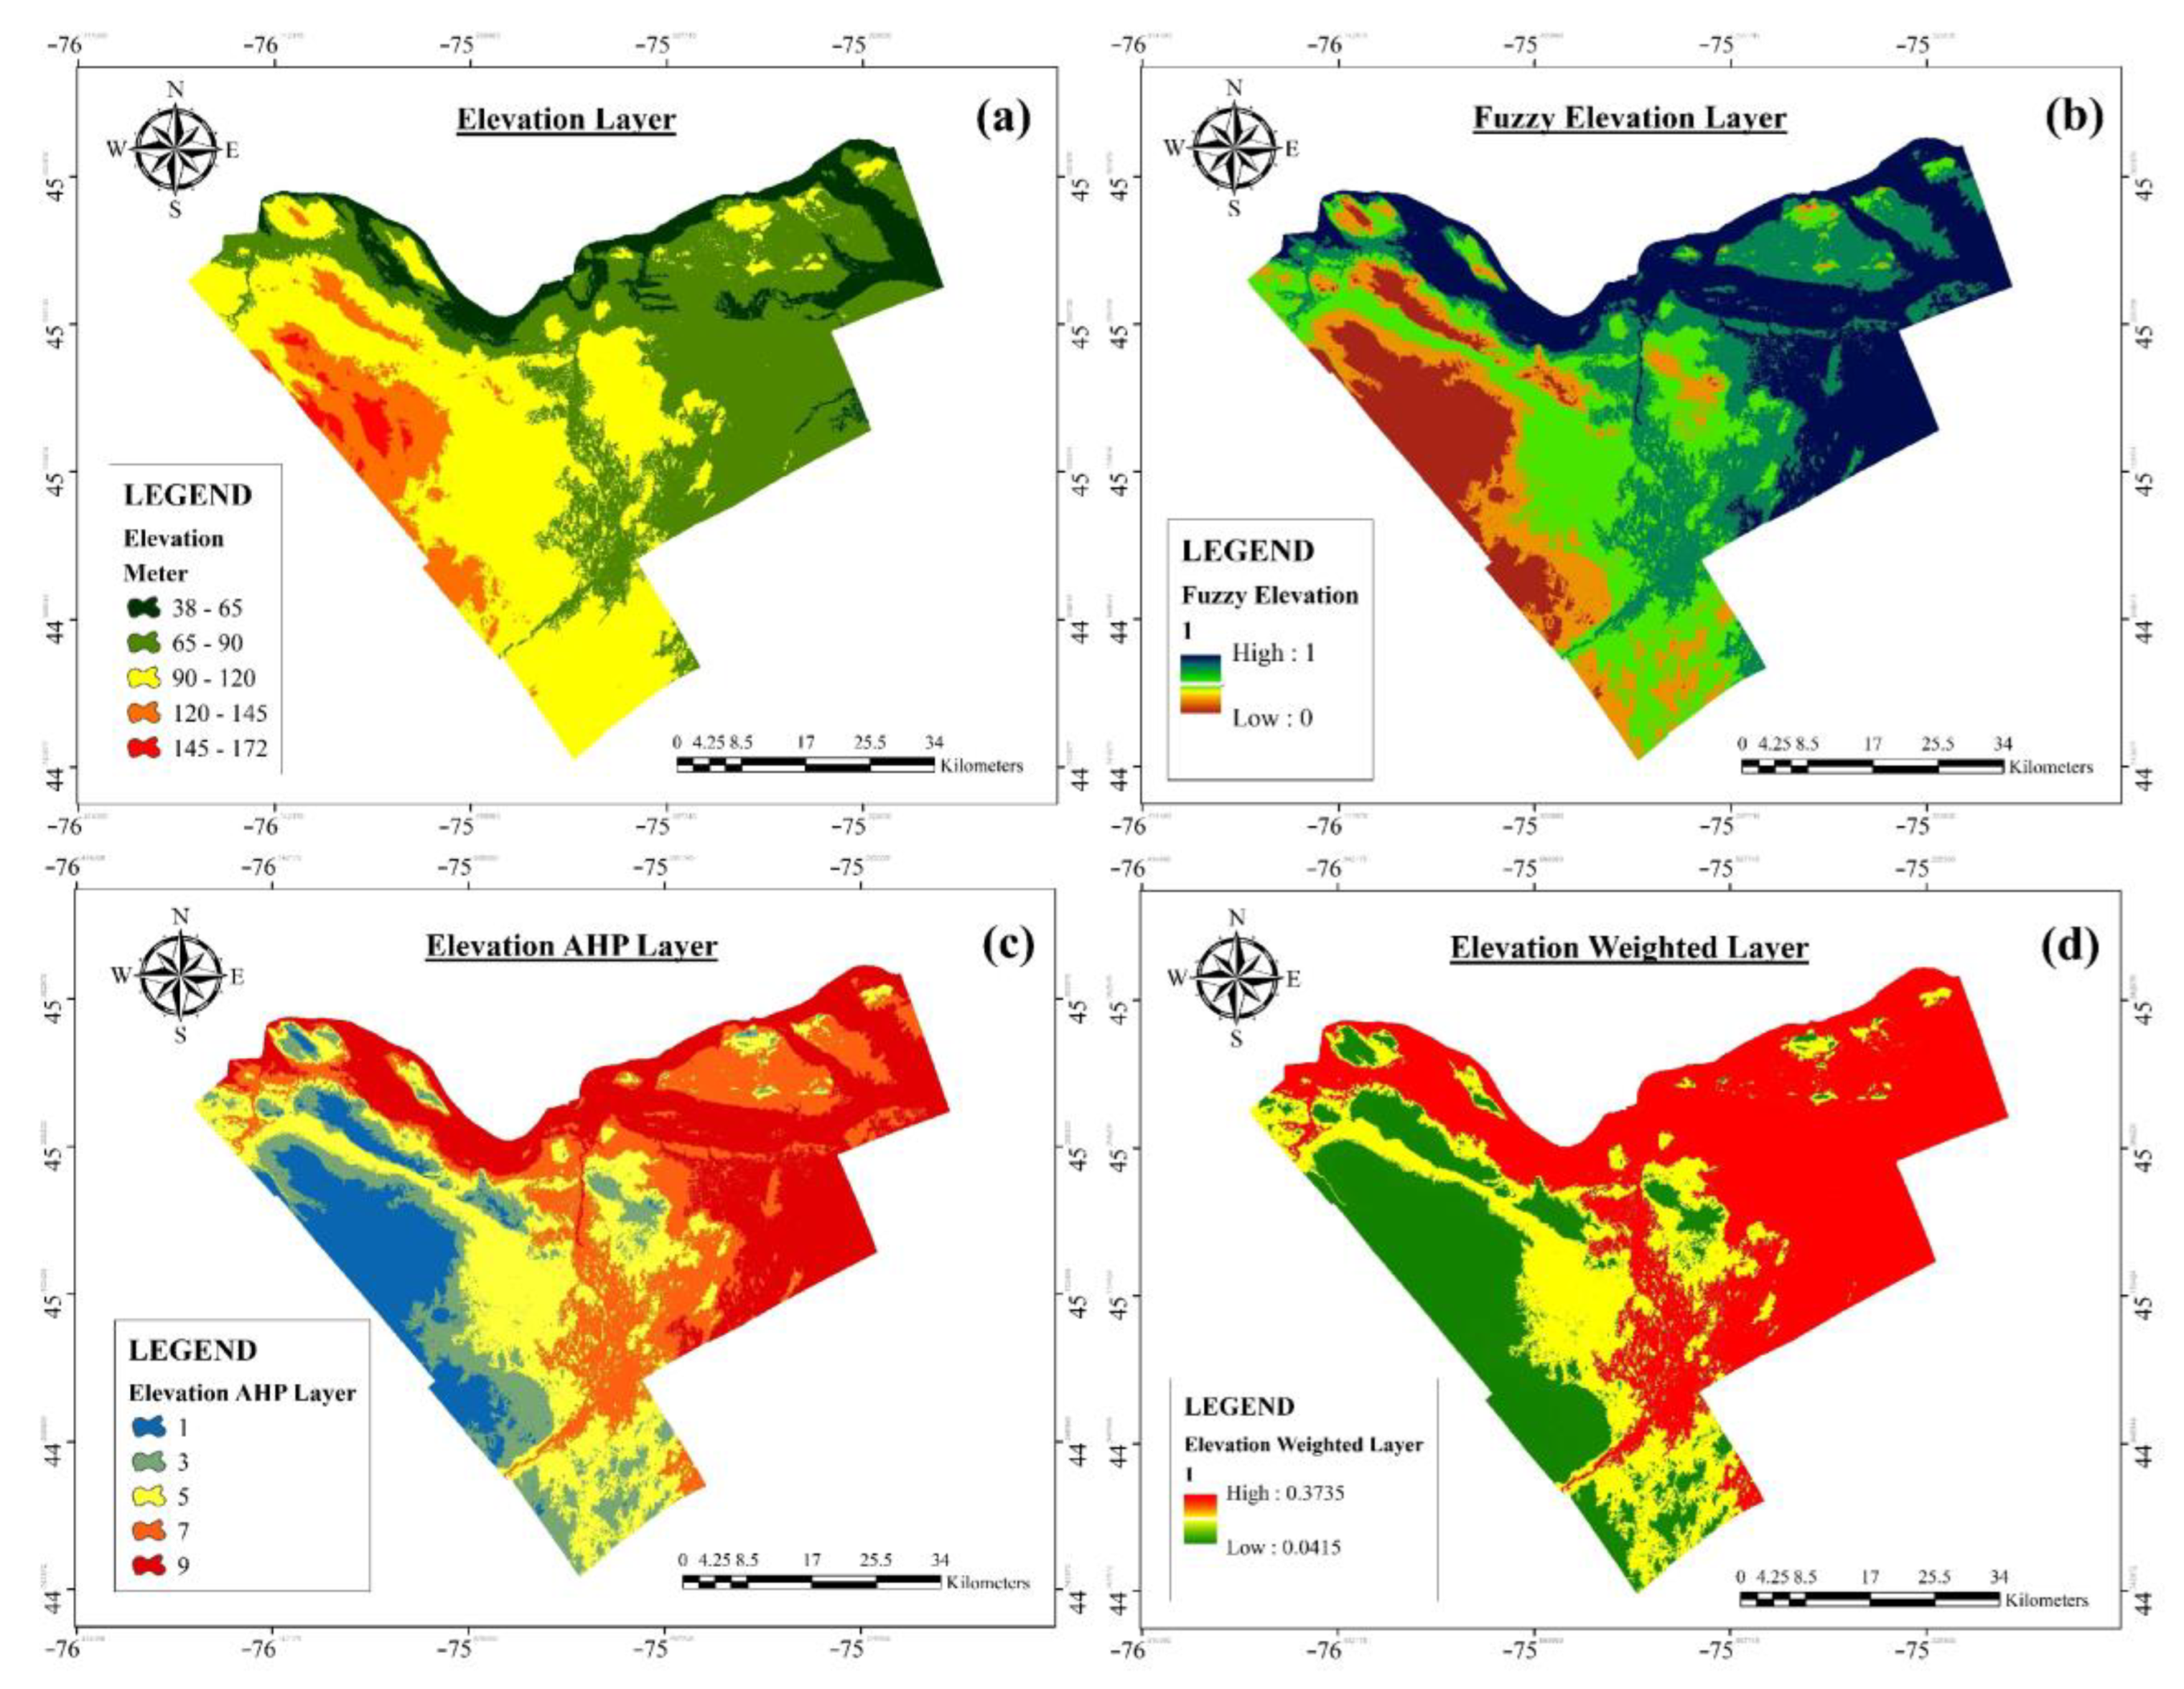
| Elevation | DEM of Canada, cell size 30 m | A lower value has higher significance, Altitudes higher than 2500 m have the least importance [15] |
| Geological class | Canada Geological map with a scale of 1:250,000 | The higher value represents more importance of sensitivity level |
| Precipitation | Annual long-term average precipitation of 6-gauge stations from 1985 to 2022. | More amount of precipitation is more important |
| Land-Use | Canada Land-use/land cover map with a scale of 1:500,000 | Denser landcover has lower importance |
| Soil-Type | Soil-type classification map with a scale of 1:1,000,000 | Soil near the ground level is more significant than the deeper soil below. Additionally, soils that can either shrink or expand are of lesser significance [15] |
| Distance from River | Shape file rivers of Ontario | Having a shorter distance to the river is considered more important |
| Drainage Density | shape file rivers and sub-basin boundaries of Ontario | Higher river density of the basin is more important |
| Layer Name | Soil | Slope | Precipitation | Land Use | Geology | Elevation | Drainage Density | Distance from River | Weight |
|---|---|---|---|---|---|---|---|---|---|
| Soil | 1 | 0.33 | 0.2 | 3 | 6 | 7 | 5 | 3 | 0.143 |
| Slope | 3 | 1 | 0.2 | 5 | 7 | 1 | 0.25 | 7 | 0.162 |
| Precipitation | 5 | 5 | 1 | 4 | 8 | 3 | 4 | 7 | 0.298 |
| Land Use | 0.33 | 0.2 | 0.25 | 1 | 7 | 7 | 7 | 0.2 | 0.121 |
| Geology | 0.167 | 0.143 | 0.125 | 0.143 | 1 | 0.5 | 0.2 | 0.143 | 0.018 |
| Elevation | 0.143 | 1 | 0.33 | 0.143 | 2 | 1 | 0.167 | 0.143 | 0.041 |
| Drainage Density | 0.2 | 4 | 0.25 | 0.143 | 5 | 6 | 1 | 1 | 0.109 |
| Distance from River | 0.33 | 0.143 | 0.143 | 5 | 7 | 7 | 1 | 1 | 0.107 |
| I.R | 0.041 | The matrix is satisfactory in term of consistency | |||||||
Disclaimer/Publisher’s Note: The statements, opinions and data contained in all publications are solely those of the individual author(s) and contributor(s) and not of MDPI and/or the editor(s). MDPI and/or the editor(s) disclaim responsibility for any injury to people or property resulting from any ideas, methods, instructions or products referred to in the content. |
© 2023 by the authors. Licensee MDPI, Basel, Switzerland. This article is an open access article distributed under the terms and conditions of the Creative Commons Attribution (CC BY) license (https://creativecommons.org/licenses/by/4.0/).
Share and Cite
Noori, A.; Bonakdari, H. A GIS-Based Fuzzy Hierarchical Modeling for Flood Susceptibility Mapping: A Case Study in Ontario, Eastern Canada. Environ. Sci. Proc. 2023, 25, 62. https://doi.org/10.3390/ECWS-7-14242
Noori A, Bonakdari H. A GIS-Based Fuzzy Hierarchical Modeling for Flood Susceptibility Mapping: A Case Study in Ontario, Eastern Canada. Environmental Sciences Proceedings. 2023; 25(1):62. https://doi.org/10.3390/ECWS-7-14242
Chicago/Turabian StyleNoori, Amir, and Hossein Bonakdari. 2023. "A GIS-Based Fuzzy Hierarchical Modeling for Flood Susceptibility Mapping: A Case Study in Ontario, Eastern Canada" Environmental Sciences Proceedings 25, no. 1: 62. https://doi.org/10.3390/ECWS-7-14242
APA StyleNoori, A., & Bonakdari, H. (2023). A GIS-Based Fuzzy Hierarchical Modeling for Flood Susceptibility Mapping: A Case Study in Ontario, Eastern Canada. Environmental Sciences Proceedings, 25(1), 62. https://doi.org/10.3390/ECWS-7-14242