Proceeding Paper

Integrated Water Resource Management Using Water Evaluation and Planning Model: A Case Study of Lower Bari Doab Canal, Pakistan †

by
Hira Khanam
1,*,
Sikandar Ali
1,2,*,
Muhammad Zaman
1,
Muhammad Adnan Shahid
1,2,*,
Hafsa Muzammal
1,2,
Muhammad Zeeshan Khan
1,
Muhammad Safdar
1,2 and
Muhammad Danish Majeed
1,2
1
Department of Irrigation & Drainage, University of Agriculture, Faisalabad 38000, Punjab, Pakistan
2
Agricultural Remote Sensing Lab (ARSL), University of Agriculture, Faisalabad 38000, Punjab, Pakistan
*
Authors to whom correspondence should be addressed.
Presented at the 7th International Electronic Conference on Water Sciences, 15–30 March 2023; Available online: https://ecws-7.sciforum.net.
Environ. Sci. Proc. 2023, 25(1), 55; https://doi.org/10.3390/ECWS-7-14202
Published: 14 March 2023
(This article belongs to the Proceedings of The 7th International Electronic Conference on Water Sciences)

Abstract

:
Freshwater scarcity is a global concern and is caused by the overuse of water, exceeding the sustainable level. In Pakistan, overpopulation, climate change alleviation, and economic development influence the asset of water. For water management, development, and conservation, policymakers need to formulate the right plans and projects. For this purpose, they need to evaluate the impact of different projects and plans and evaluate considerable data and information. Different tools are being adopted for integrated water resource management. Among them, WEAP is user-friendly, reliable, and efficient, and is used widely across the globe. It will aid the policymakers to develop suitable projects and plans. This study was carried out by using WEAP, in the Lower Bari Doab Canal command area (LBDC), Punjab, Pakistan. This study sheds light on the current water allocation situation and simulated scenarios of population growth rates and economic growth to evaluate the future water demand situation. The results of the current account year (2015) show that the domestic water demand of Okara (101.51 MCM) and the agricultural water demand (1713 MCM) of Sahiwal was seen to be the maximum among the four districts. Unmet demand was found to be maximum for the districts laying in the tail end (Sahiwal and Khanewal). The results of the scenarios show that, if the current water consumption, population growth, and economic development continue, unmet demand will increase in the future, and if the population grows at a higher rate and economic development increases, it will result in higher unmet water demand in the coming years. WEAP was found to be a user-friendly and efficient model to better understand water demand.

1. Introduction

The sources of water in Pakistan are either natural or artificial. Accessibility to water is declining globally due to environmental and climate changes, industrialization, contamination, and other anthropogenic activities. Around two billion people are living in areas that are under water stress, and they are not able to use freshwater resources due to the uneven distribution of freshwater [1]. The water crisis has been on the list of the top five world crises for the last 6 years and has been placed in fourth position for the year 2019 [2]. Water shortage is a globally escalating phenomenon that endangers the life of whole species of animals and plants.
The system is as follows for the distribution of water in agricultural lands of Pakistan. The water is supplied after 7 days according to the turn of each farmer [3]. This amount of water supplied to each farmer depends on its land holding, i.e., 25 minutes/acre/week. This system is purely supply-based and does not consider the water required by the crops grown within an area. This amount of water is distributed throughout the year, but the water demand varies within a year. Sometimes, more water is supplied than the crops demand and it becomes waste, and sometimes less water is supplied, which results in the inability to fulfill the demand of the crops grown. This ultimately results in increasing the groundwater pumping to fulfill the demand for the crops. Therefore, there is a dire need to develop a system that considers both demand and supply. For the past three decades, many national and international studies were conducted on the water resource management and development of Pakistan. In these studies, water is studied according to different aspects, including water security [4,5], water balance [6], water and food security (GOP, 2017), water sector strategy [7], food, water, and three energy nexuses [8], and these studies use different models, including the Indus Basin Model Revised, to relieve water scarcity.
The inadequate political governance and inappropriate policies also cause the mismanagement of the valuable resource of water. Conducting different studies and implementing different projects and policies requires considerable involvement from various departments; therefore, policymaking in Pakistan is not a facile task. The model used in this study is WEAP. The results obtained from WEAP will help to combat the problems caused by climate change, industrialization, and population growth to water resources and to redesign the water allocation policies by considering both demand and supply. It provides an all-inclusive, adaptable, and easy-to-use structure for planning and policy analysis. WEAP is used for calculating water balance, scenario generation, and policy analysis. It calculates the water balance based on crop water requirements. It also aids in reallocating water resources according to water availability. Different possible future scenarios were built to analyze the water resources. These types of models help to improve water distribution and to achieve efficient water resource management. This work thus aims (1) to investigate the current water allocation scenario in the Lower Bari Doab Canal command area and (2) to evaluate the water allocation plans under different possible future scenarios.

2. Materials and Methods

2.1. Description of Study Area

This study was carried out in the command area of the Lower Bari Doab Canal. This canal originates from Balloki Headworks, which lies on the left bank of the River Ravi beside the Balloki barrage as shown in Figure 1. The gross command area of LBDC is found between the 29°53′0″ to 31°13′6″ N latitudes and the 71°34′49″ to 73°51′56″ E longitudes. Most of the water reaching the LBDC is from River Jehlum and River Chenab via a link canal. The gross command area and culturable command area of LBDC are 0.728 M hac and 0.676 M hac, respectively. The length of the main canal is 124 miles, and it irrigates the districts of Kasur, Okara, Sahiwal, and Khanewal. It provides irrigation supplies to 65 nos. of taking channels and 3500 watercourse outlets. The irrigated area for Rabi is 1,579,003.594 acres, and the irrigated area for Kharif is 1,448,764.597 acres. The average temperature of the study area is 24.77 °C. Its designed head capacity is 9841 cusecs with a water allowance of 33.3 cusecs/1000 acres. The length of the main canal is 201 km.

2.2. Data Collection

The water evaluation and planning model used in this study is found to be very effective for calculating water demand and unmet demand. It is also used for evaluating and analyzing different plans and projects before implementation [9]. Data required to fulfill the objectives of the study and to obtain the results from the WEAP include climatic data (maximum temperature, minimum temperature, wind speed, precipitation, cloudiness fraction, average humidity, wind speed measurement height), crops grown in the area, existing cropping pattern, rotation of crops, the population in the area, domestic demand, and soil types data. Data on the flow in the Lower Bari Doab Canal in all the concerned years are also required. All the mentioned data are collected from various departments. The data along with their sources and format are given in Table 1 below.

2.2.1. Soil Data

Soil types within the study area were identified from the world soil map by using different commands in ArcGIS. These commands include the extraction of the study area soil map from the world soil map which was classified and studied to determine the soil types within the area as shown in Table 2. The soil map for the study area is shown in Figure 2 below.

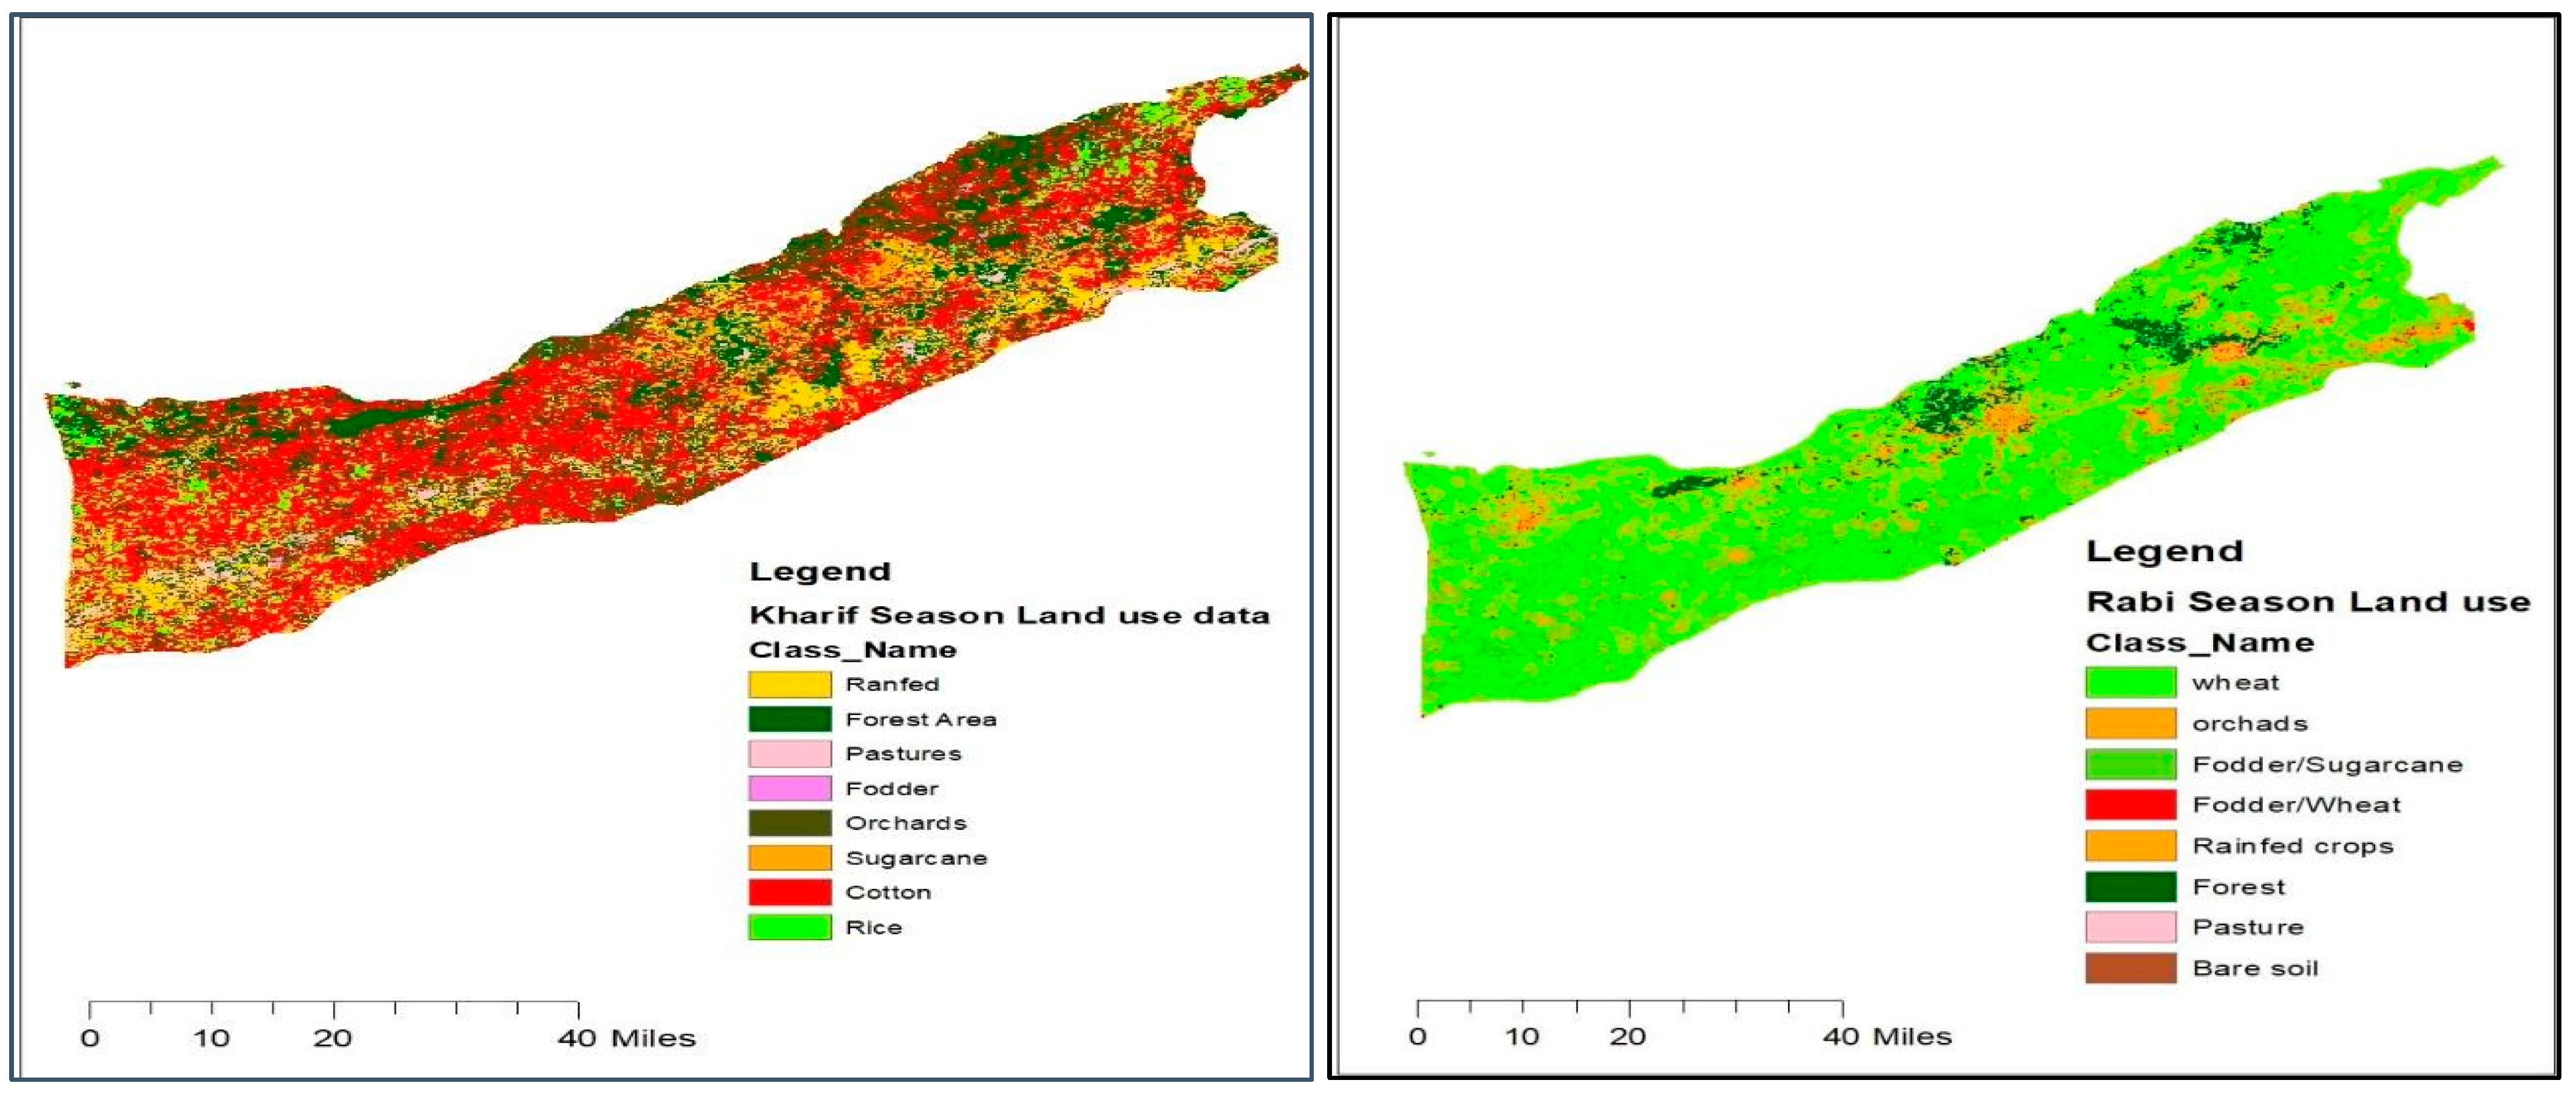
2.2.2. Agricultural Land Utilization Data

These data were collected from the classification of the land use data of Pakistan in GIS. An arc map has been used to superposition this land use with canal command areas. The land use data for both Rabi and Kharif seasons in each of the districts were extracted from the land use data of Pakistan for both Rabi and Kharif seasons. The extracted land use data were studied in Excel and changed accordingly to be input into the WEAP. The land use data were input in the CSV format into the WEAP. The data holds information about land utilization in all of the four districts laying in the command area of the Lower Bari Doab Canal. These two growing seasons are seen in this study area, i.e., Rabi and Kharif. The growing season of Rabi is from November to April and the growing season of Kharif is from May to October as shown in Figure 3.

3. Results and Discussion

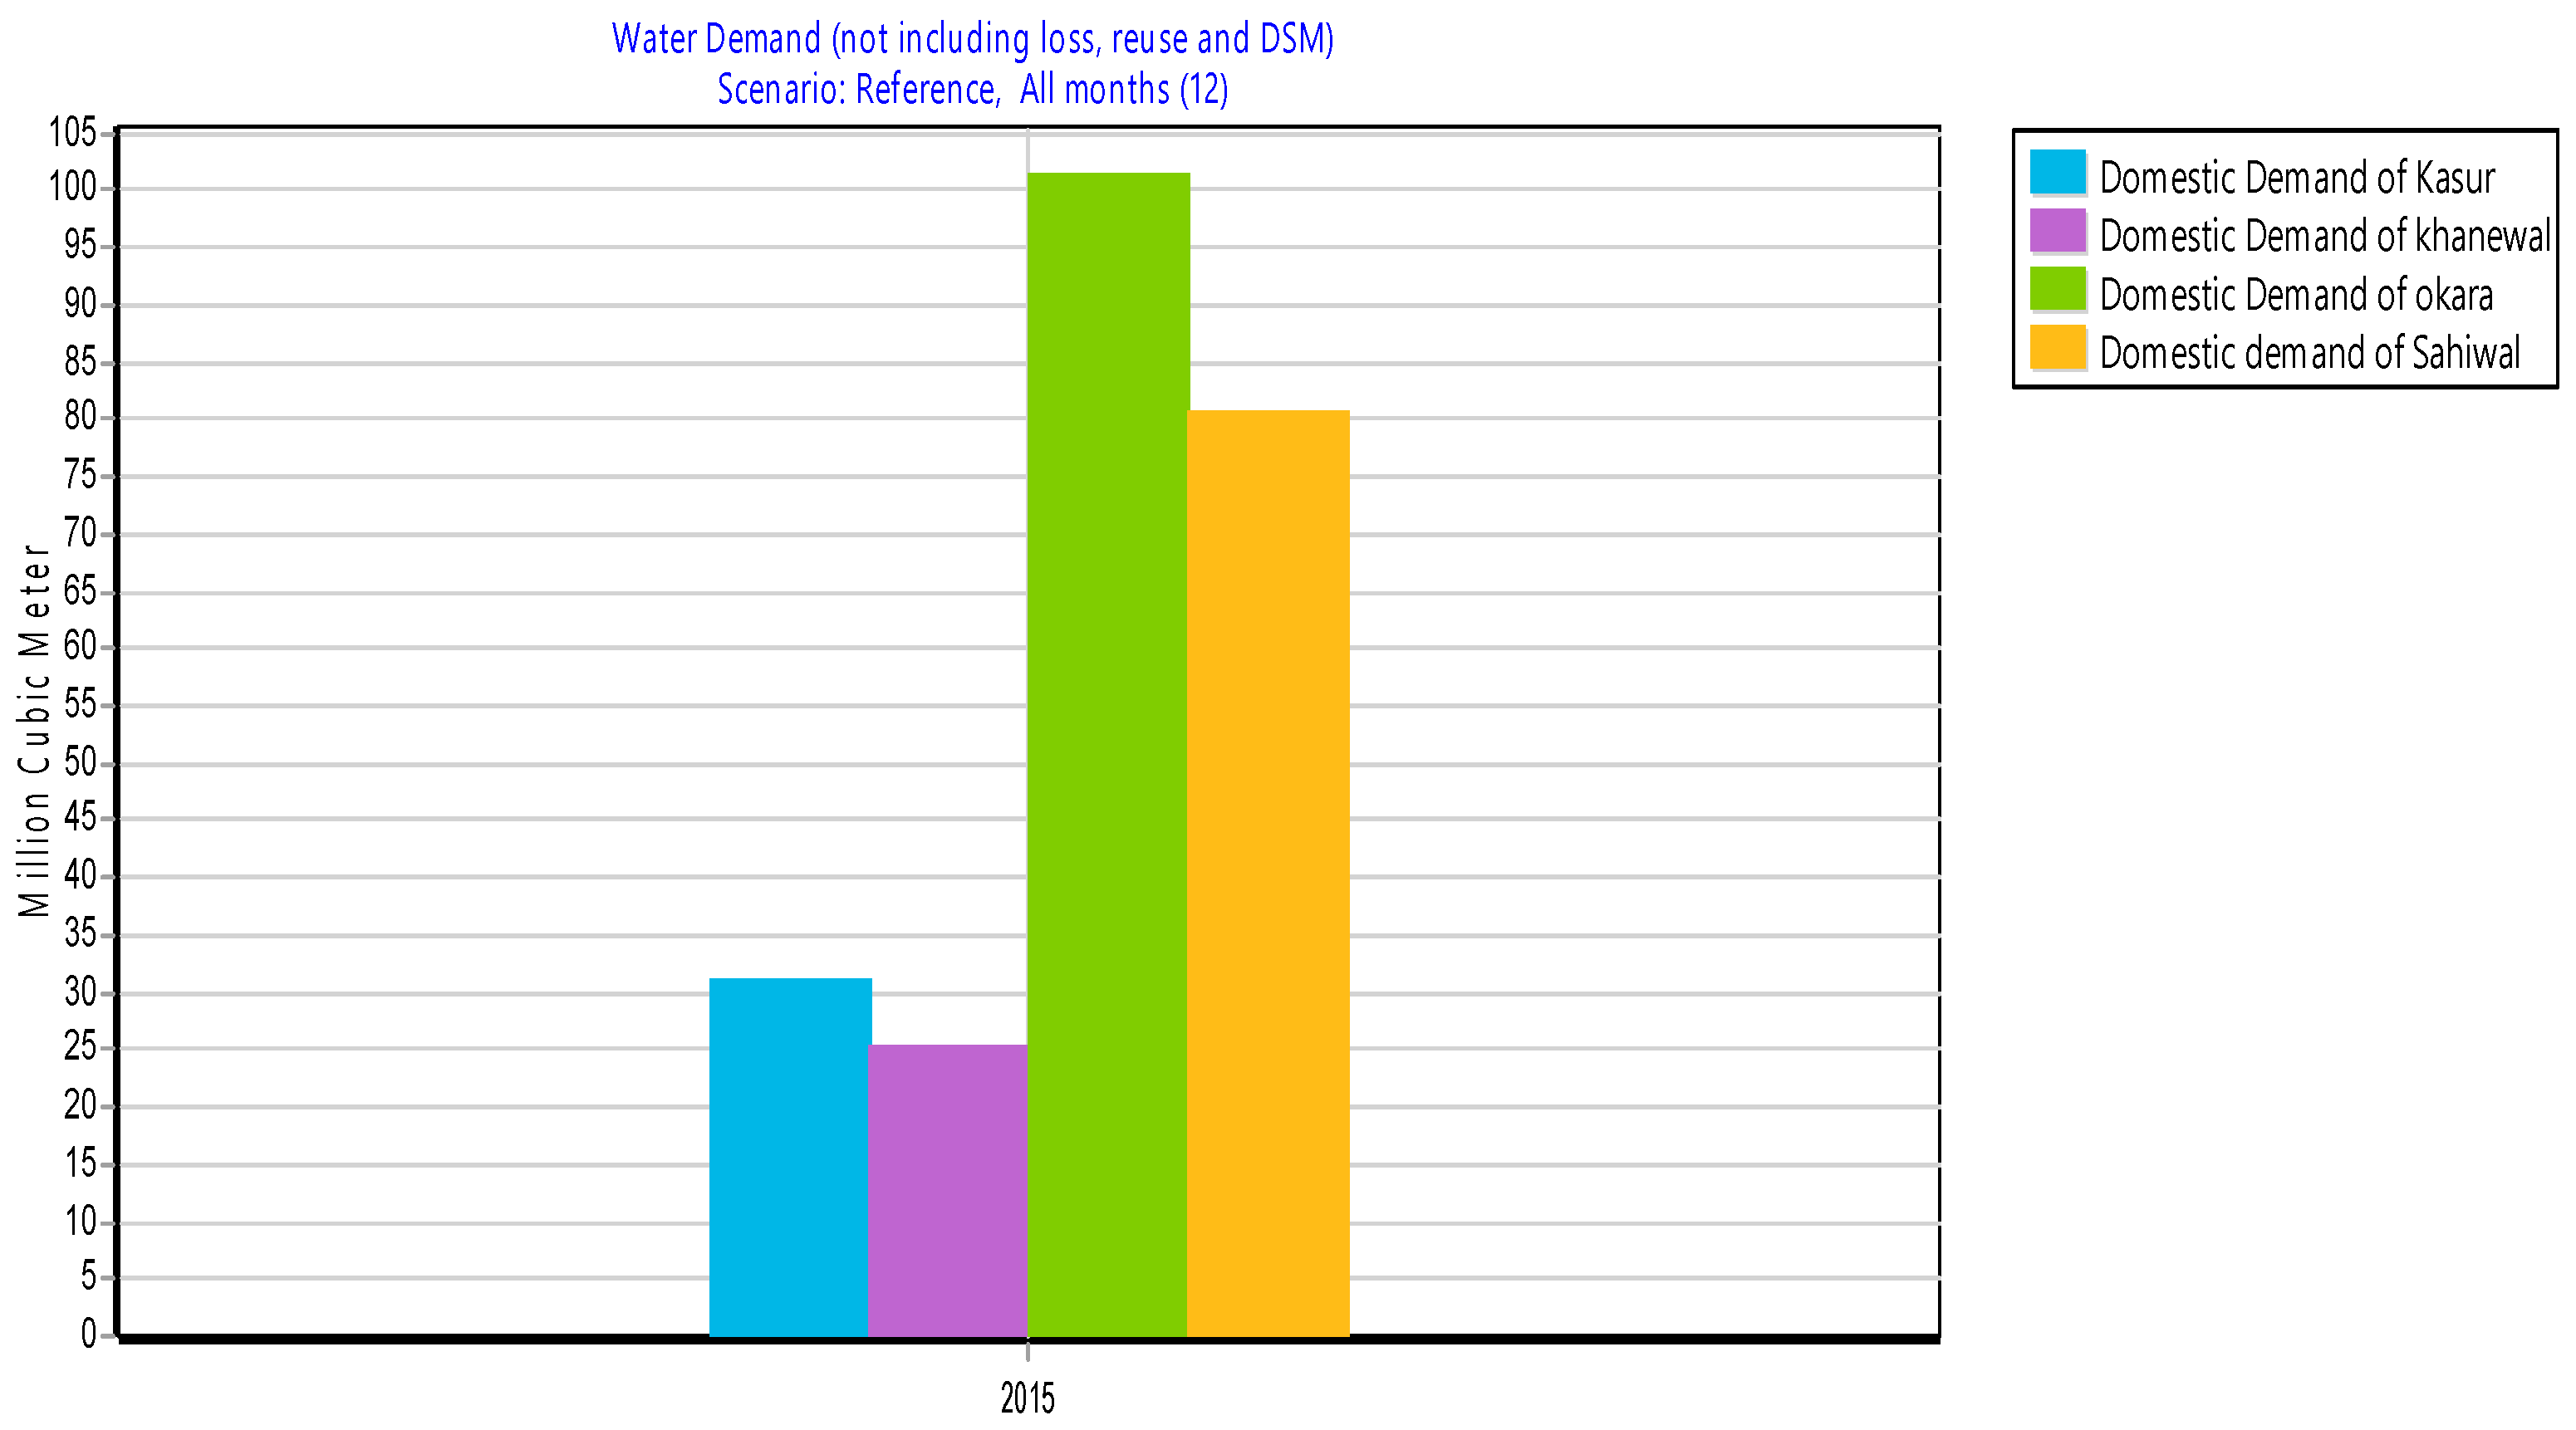
3.1. Domestic Water Demand of Population within Districts for the Current Account Year (2015)

Domestic water demand includes water requirements for drinking, house chores, and personal cleanliness. The annual water demand of a person is taken as 33.5 m3. The observed population of Kasur, Okara, Sahiwal, and Khanewal in the year 2015 was 792,045, 2,915,324, 2,414,994, and 730,928, respectively. The corresponding domestic water demand for 2015 for Kasur, Okara, Sahiwal, and Khanewal was found to be 31.21 MCM, 101.51 MCM, 80.6 MCM, and 24.45 MCM, respectively. The demand for Okara was seen to be the maximum demand among the districts as the population of Okara was observed to be 2,915,342, which is the maximum among the four districts. The lowest domestic water demand was found to be for the district of Khanewal due to it comprising the lowest population among these districts. However, the total domestic water demand within the command area was seen to be 238.82 MCM for the year 2015 as shown in Figure 4.

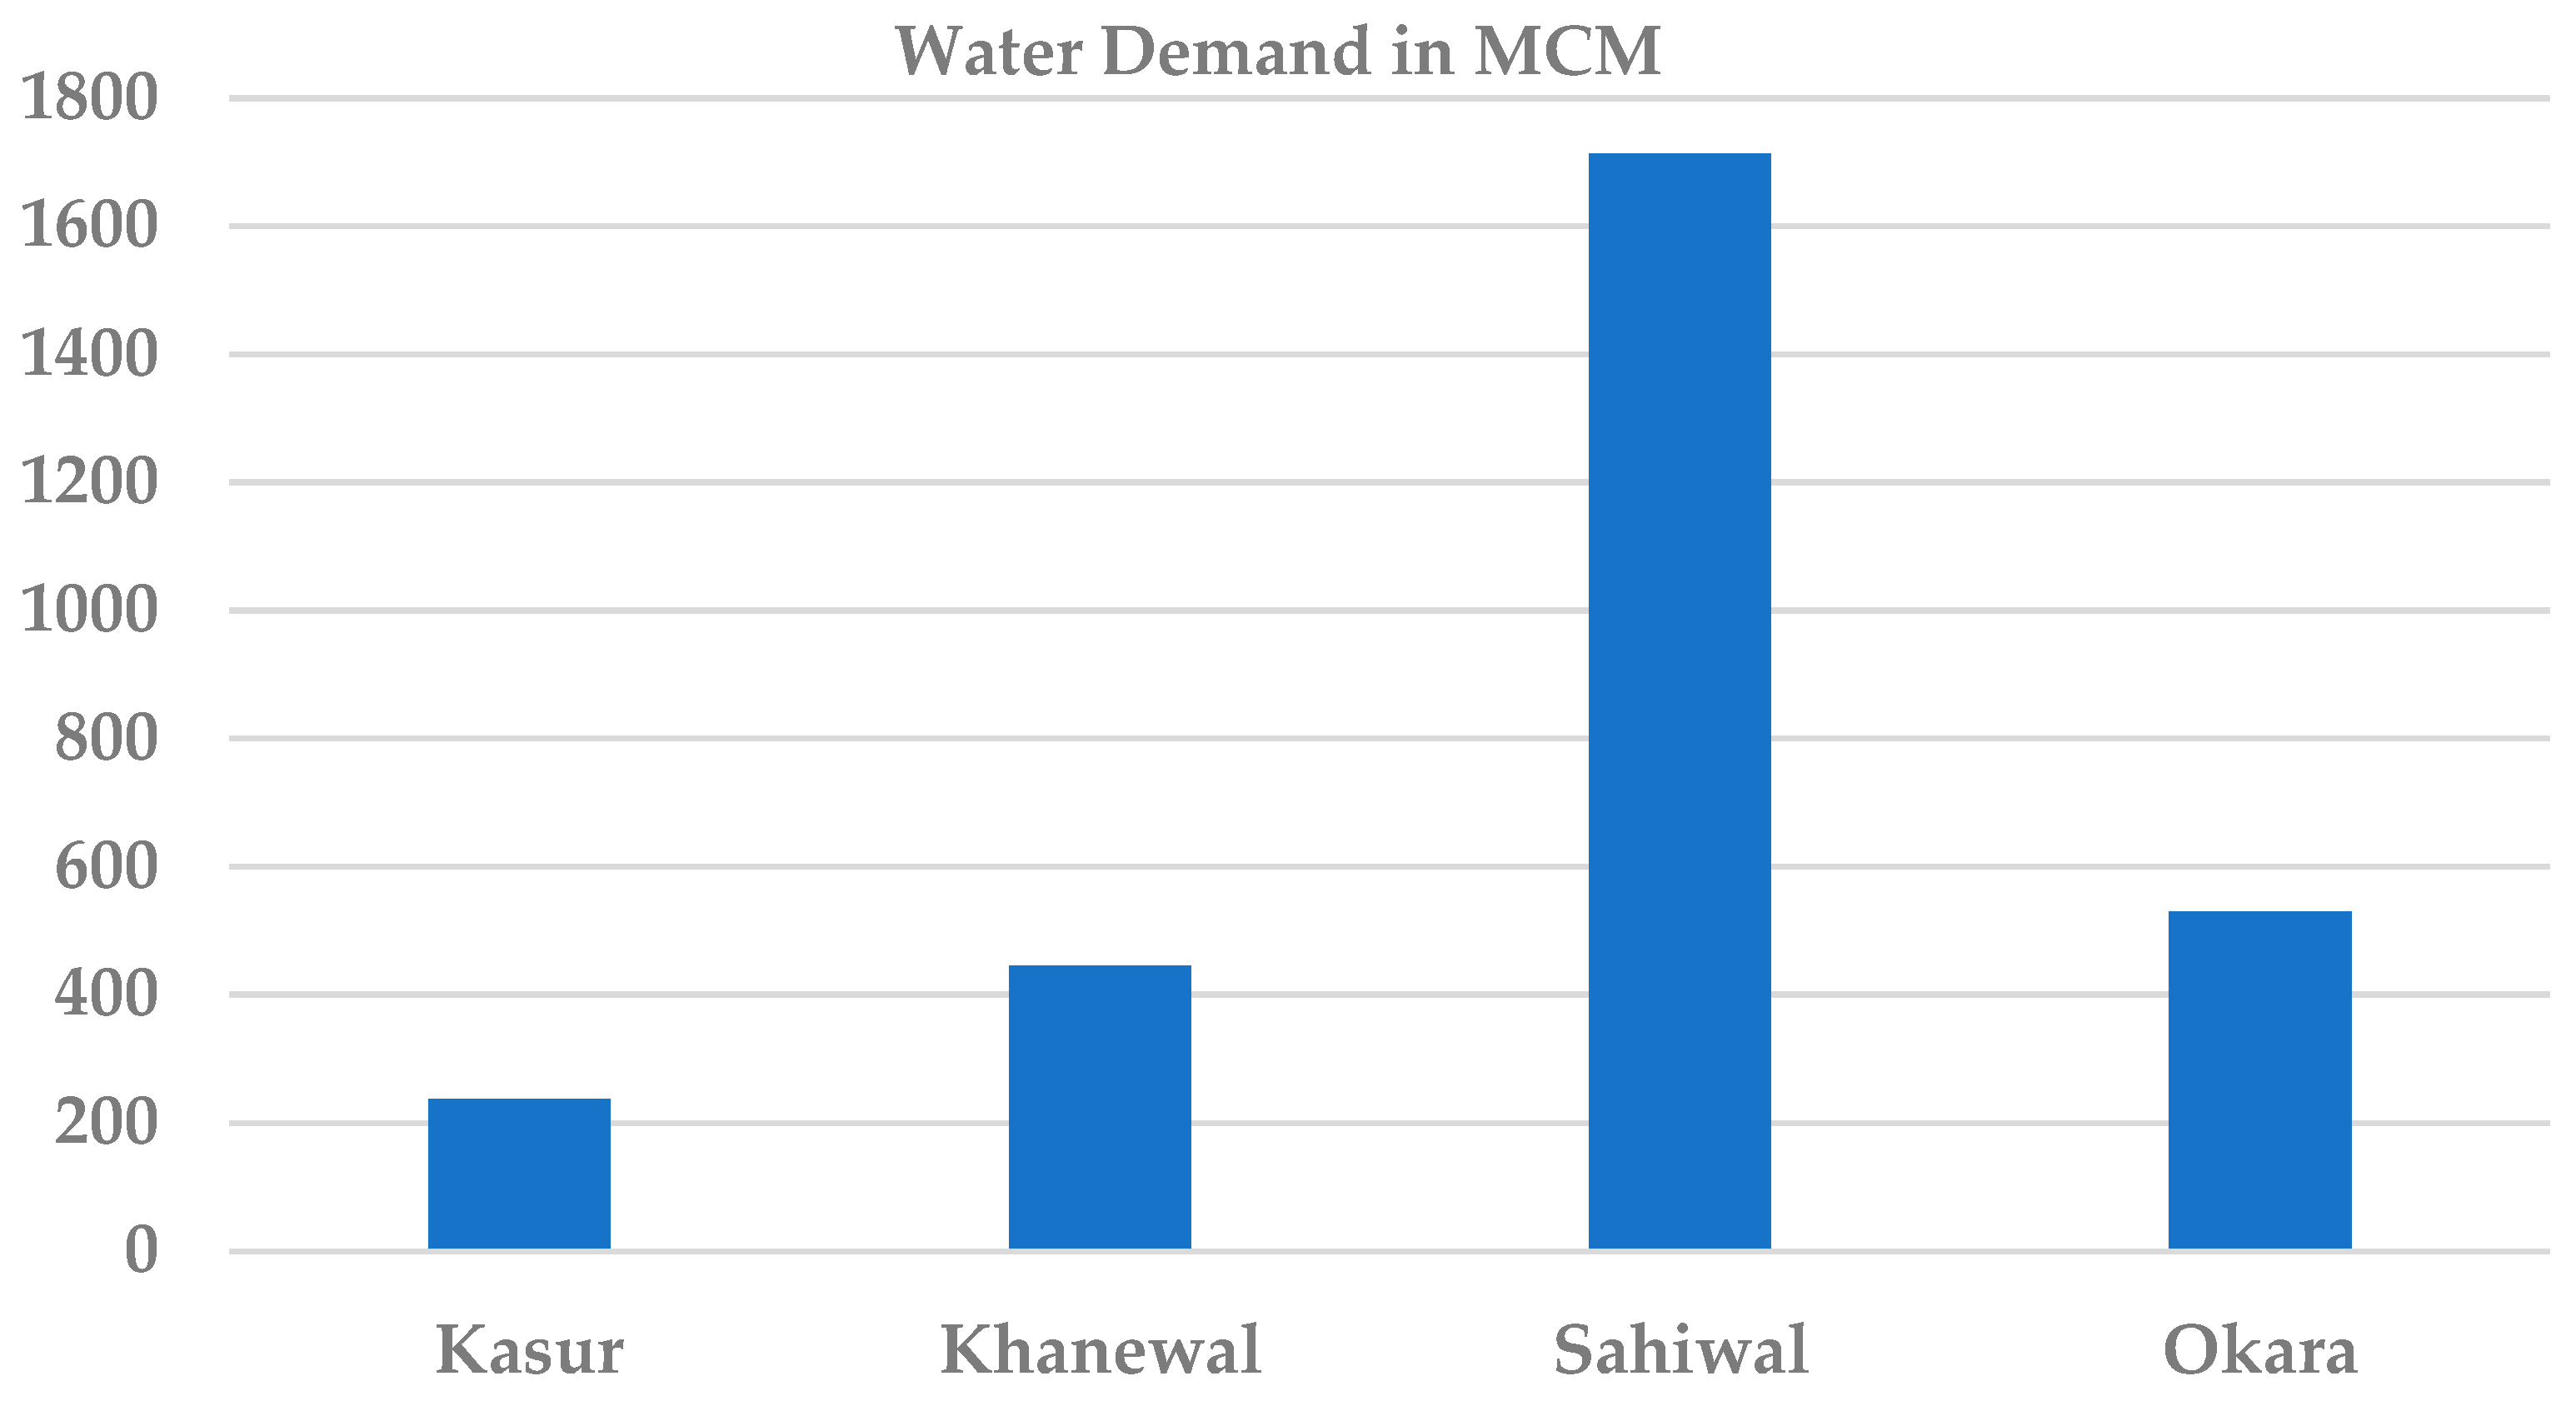
3.2. Water Demand for Agriculture for the Current Account Year (2015)

Water demand for each of the districts was determined and the water demand of Sahiwal was found to be the most at 1713 MCM as the land cover area in the Sahiwal was almost 742731 hectares, which is the largest land cover of crops among the districts. For ease of understanding, the land cover in the southern and northern buffers was also summed up in the Sahiwal. Moreover, the demand priority of Sahiwal was taken as 3, i.e., its demand will be fulfilled after the demand of Kasur and Okara. Water demand for the district of Kasur was the lowest and calculated as 237.517 MCM as the land use area of crops for Kasur was 17,251 hectares, which is also the lowest land use among the districts. The water demand of Okara was 530.3362, followed by the water demand of Khanewal which was approximated as 445.308 MCM because the land covered by agriculture for Okara was more than that for Khanewal as shown in Figure 5.

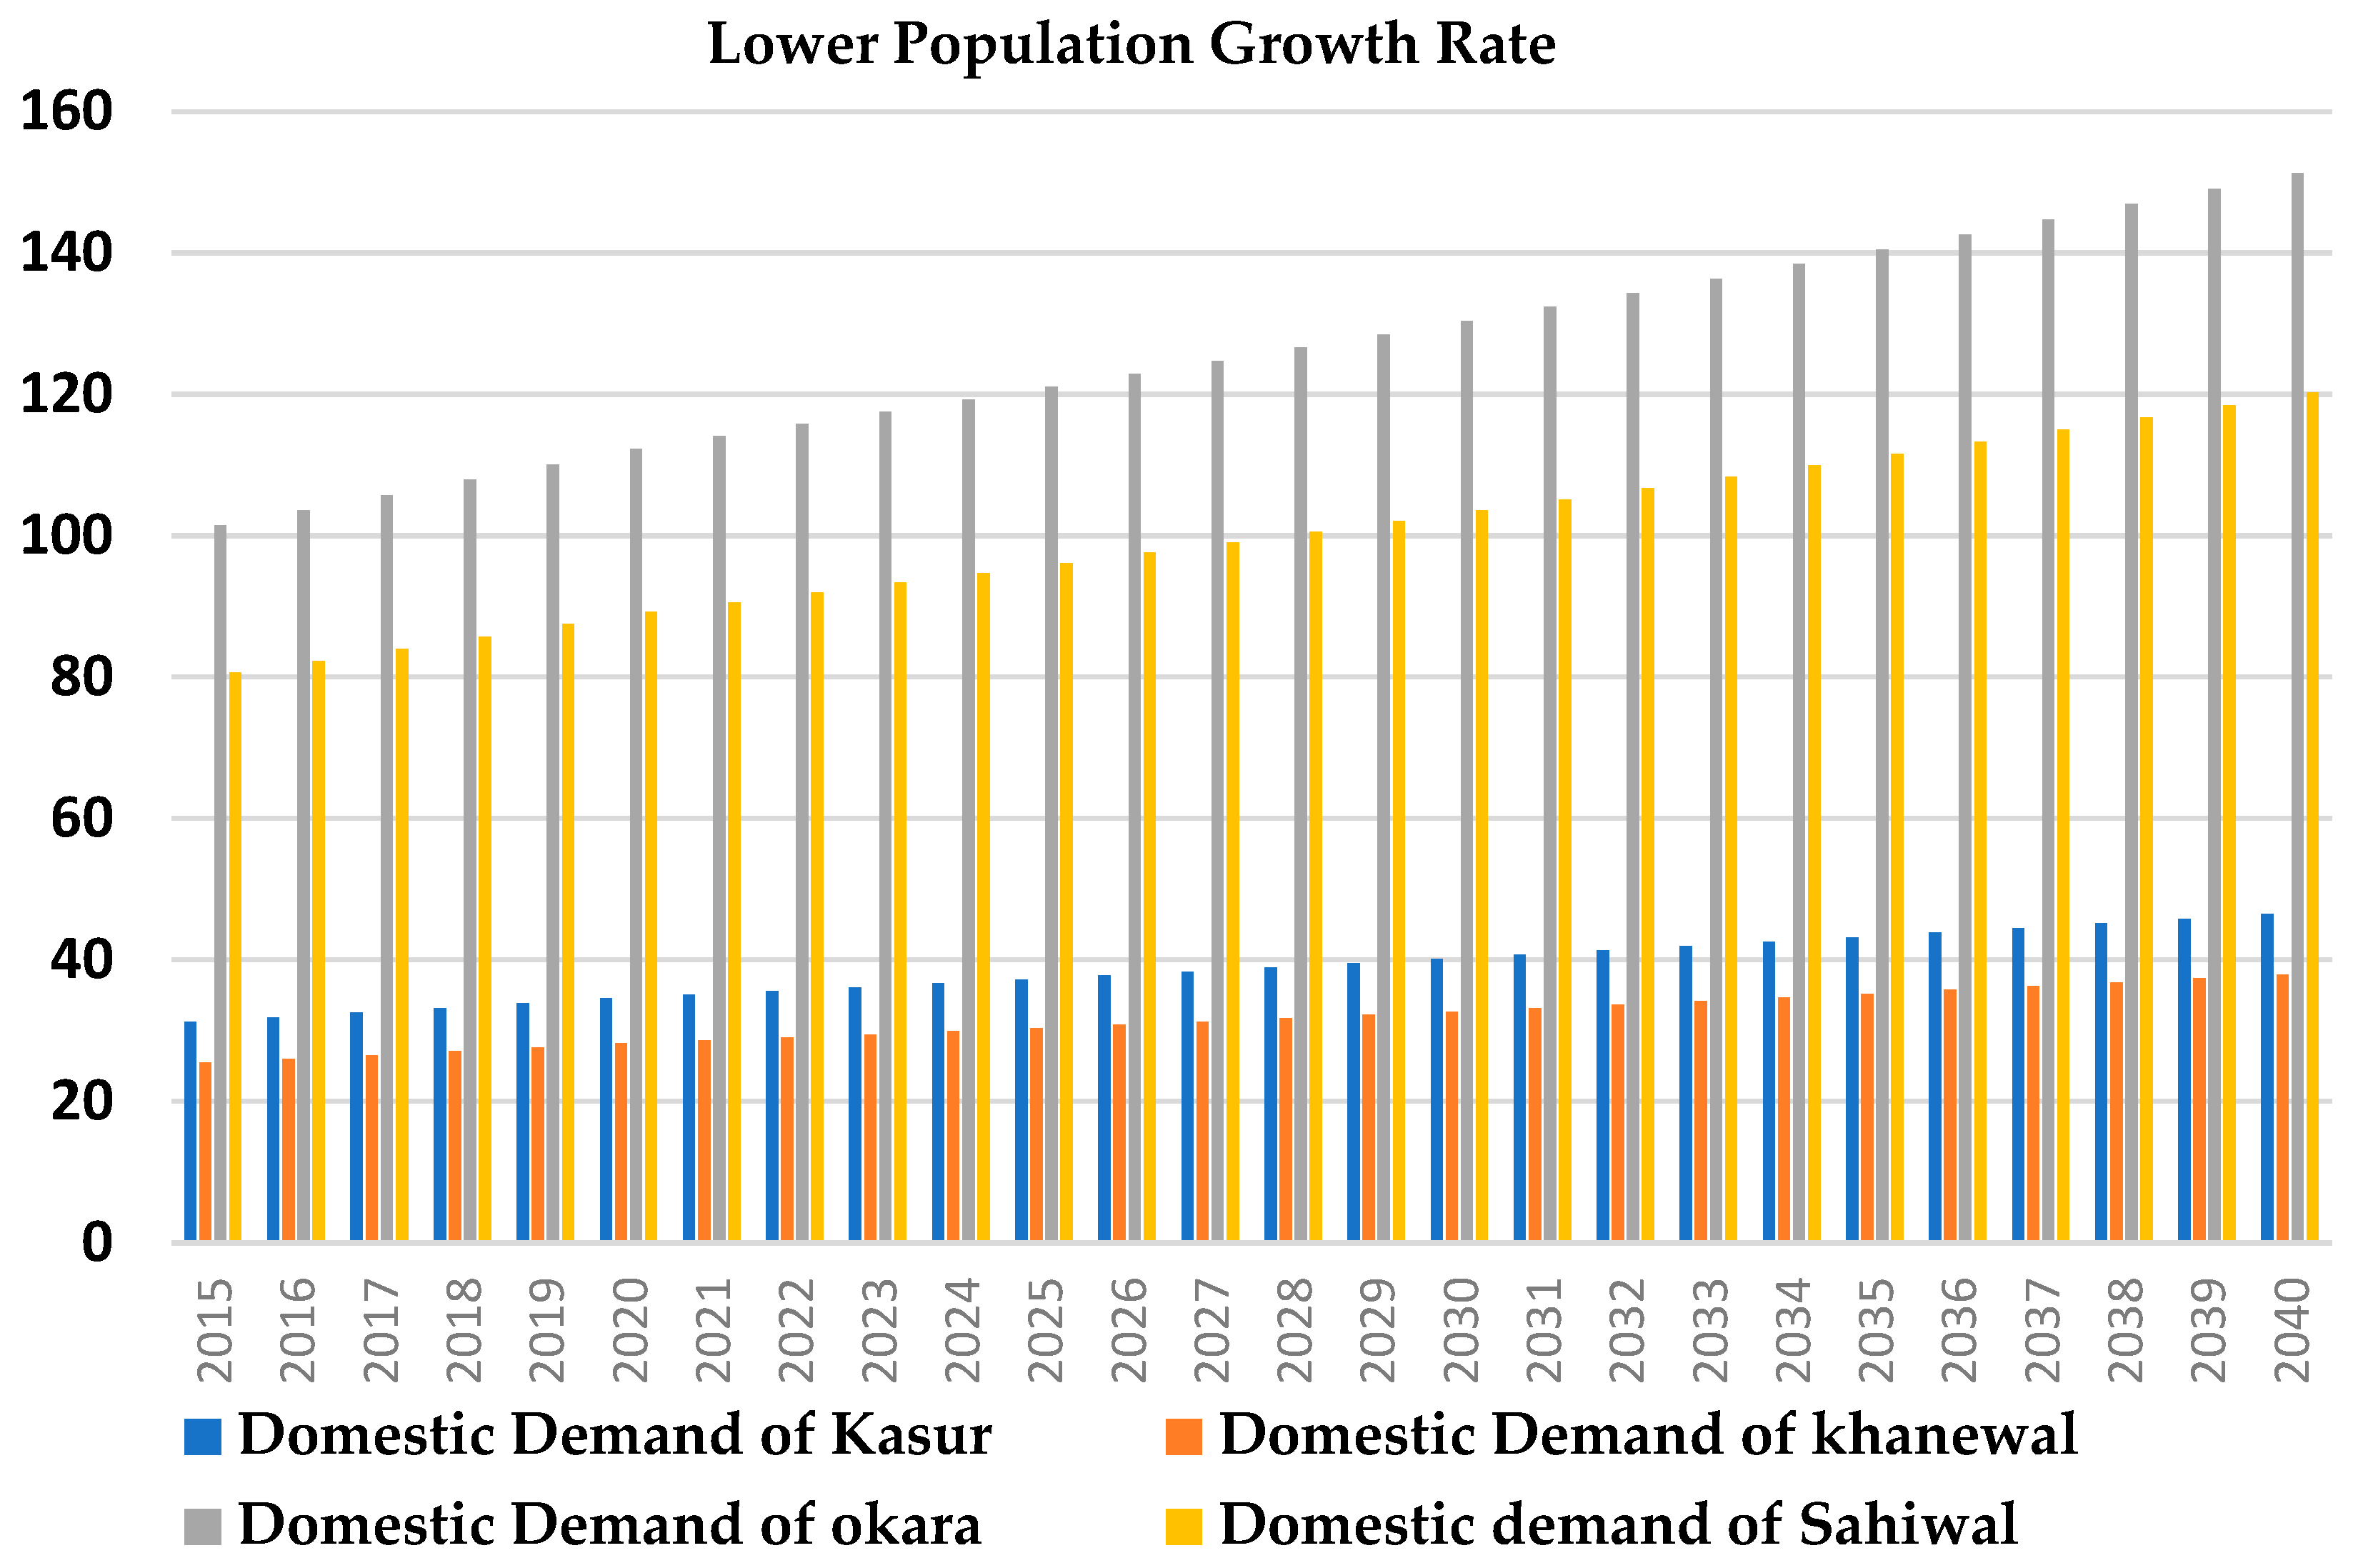
3.3. Unmet Demand for Kasur, Okara, Sahiwal, and Khanewal for the Current Account Year (2015)

A demand priority of 1, 2, 3, and 4 were given to the agricultural demand site of Kasur, Okara, Sahiwal, and Khanewal, respectively. Demand priority explains the sequence of fulfilling the water demand of the demand sites. The unmet demand for the districts of Kasur and Okara was almost zero because Kasur lies at the start of the LBDC and there is more rainfall within the district of Kasur. Similarly, Okara lies after Kasur and its demand were full before Sahiwal and Khanewal. The unmet demand for Sahiwal was 567.69 MCM and the unmet demand for Khanewal was approximated as 344.57 MCM. The unmet demand of Sahiwal was more because its land cover was more than that of Khanewal. This increased cropping pattern results in increased water demand and unmet demand for the district of Sahiwal as shown in Figure 6.

3.3.1. Low Population Growth Rate

This scenario considers that the population is growing at a lower rate of 1.5% after 2020. Following this growth rate, the water demand will be lower for all of the considered years as compared to the higher population growth rate. For Kasur, water demand is approximated as 31.20 MCM in 2015, 34.53 MCM in 2020, 37.20 MCM in 2025, 40.044 MCM in 2030, and 46.511 in 2030. For Khanewal, the domestic water demand was estimated to be 25.449 MCM in 2015, 28.163 MCM in 2020, 32.684 MCM in 2030, and 37.931 MCM in 2040. The highest water demand was observed in Okara for all of the years up to 2040, as compared to all other districts. Okara’s water demand sees a rise to 151.291 MCM in 2040. Sahiwal’s water demand was observed to be 89.26 MCM in 2020 and 120.22 MCM in 2040 as shown in Figure 7.

3.3.2. Medium Population Growth Rate

The scenario of a medium population growth rate took a 2.03% growth rate per year. Following this growth rate, the water demand in Kasur was observed as 31.206 MCM in 2015, 34.53 MCM in 2020, 42.22 MCM in 2030, and 51.61 MCM in 2040. Water demand increases from 25.44 MCM in 2015 to 42.095 MCM in 2040. Water demand for Sahiwal was observed as 80.66 MCM in 2015, 89.260 in 2020, 109.128 in 2030, and 133.418 in 2040. The highest water demand was observed to be for the district of Okara for all of the years at 101.507 MCM in 2015, increasing to 112.32 MCM in 2020, 137.33 MCM in 2030, and its highest in 2040 for 167.9 MCM in. Similarly, ref [10] took a growth rate of 2.41% for Sindh and 2.13% for Punjab, according to which the water demand will aggravate from 177.8 BCM in 2017 to 192.7 BCM in 2040 as shown in Figure 8.

3.3.3. High Population Growth Rate

This scenario assumes that the high population growth alone results in more development and economic growth. The agricultural land is decreasing as there is more urbanization. Fields are being reduced day by day to make new settlements for a growing population. Economic growth results in an increase in water demand per person and year. This scenario considers the increase in water demand to be of 55 m3/year. This increase in water use results in a rapid increase in water demand up to the year 2040. In the higher population growth rate scenario, domestic water demand increased to 56.581 MCM, 46.148 MCM, 184.0645 MCM, and 146.263 MCM in Kasur, Okara Sahiwal, and Khanewal, respectively, in 2040. However, this scenario considers the increase in the annual water use rate per person to be 55 m3/year and the higher population growth rate, i.e., 2.5 %/year. Domestic water demand for Kasur district increased from 31.026 MCM in 2015 to 93.183 MCM in 2040, following the higher population growth rate and increase in annual water use by a person. For the district of Khanewal, the domestic water demand increased from 25.449 MCM to 54.808 in 2020, 62.01 MCM in 2025, 70.15 in 2030, 79.379 in 2035, and 89.810 in 2040 as shown in Figure 9.

3.4. Higher Living Standard Scenario

The highest domestic water demand was seen to be for the district of Okara, for which the water demand was recorded as 101.507 MCM in 2015, 218.606 in 2020, 279.83 in 2030, and 358.21 MCM in 2040. For the district of Sahiwal, the water demand was estimated to be 80.66 MCM in 2015, which increased to 284.645 MCM in 2040. Ref. [11] also used WEAP to access the impact of higher population growth rate and urbanization on water demand in the Upper Indus Basin. The water demand increased in both situations. He also concluded that an increase in population and more urbanization results in an increase in water demand and ultimately higher unmet demand. The higher unmet demand will lead to an increase in groundwater abstraction, which causes the rapid deterioration of groundwater quantity and quality as shown in Figure 10.

4. Conclusions and Recommendations

Water demand is increasing with increasing population, economic growth, urbanization, industrialization, and climate change. Water demand for the Sahiwal district was found to be at the maximum because it has the largest land use area for crops. Unmet demand was found to be the highest for the districts of Sahiwal and Khanewal. WEAP is user-friendly and can be used easily for the evaluation of different water management strategies and policies before implementation. The constraints faced include the unavailability of institutional support, sufficient and reliable information, and political conflicts.
To meet the unmet demand, protect the groundwater resource from deterioration, and mitigate the effects of climate change, the water should be supplied on a demand basis rather than a supply basis. The wastewater can be treated and then can be used for irrigation purposes. This can help to reduce the irrigation demand, changing the cropping pattern and the use of water-efficient crops in the districts of Sahiwal and Khanewal can reduce the water demand in these areas. Efficient irrigation methods such as sprinklers and drip irrigation can also help in reducing water demand. The domestic demand can be reduced by maintaining a low population growth rate and using water-efficient taps in the houses. Consumer education and awareness level may affect water use and practices, which could result in water demand reduction. WEAP is user-friendly and can be used for identifying the impact of different water management strategies and policies.

Author Contributions

Conceptualization, H.K. and S.A.; Introduction, M.Z. and M.A.S.; Materials and Methods, H.K. and M.Z.K.; Data Collection; H.M.; Results and Discussions, M.S. and M.D.M.; Conclusions and Recommendations, S.A. and M.A.S. writing original draft preparation H.K.; editing, M.S. All authors have read and agreed to the published version of the manuscript.

Funding

This research received no external funding.

Institutional Review Board Statement

Not applicable.

Informed Consent Statement

Not applicable.

Data Availability Statement

Not applicable.

Conflicts of Interest

The authors declare no conflict of interest.

References

  1. Oki, T.; Kanae, S. Global hydrological cycles and world water resources. Science 2006, 313, 1068–1072. [Google Scholar] [CrossRef] [PubMed]
  2. Anonymous. Global Risks Report 2019; World Economic Forum: Geneva, Switzerland, 2019; p. 114. [Google Scholar]
  3. Hoff, H.; Bonzi, C.; Joyce, B.; Tielbörger, K. A water resources planning tool for the Jordan River basin. Water 2011, 3, 718–736. [Google Scholar] [CrossRef]
  4. Ishaque, W.; Shaikh, S. Water and Energy Security for Pakistan; A retrospective analysis. Grassroots 2017, 51, 1–14. [Google Scholar]
  5. Mahmood, Z.; Liepach, W. A Productive, and Water-Secure Pakistan: Infrastructure, Institutions, Strategy, the Report of the Water Sector Task Force of the Friends of Democratic Pakistan; Water Sector Task Force: Islamabad, Pakistan, 2012. [Google Scholar]
  6. Hussain, I.; Hussain, Z.; Sial, M.; Akram, W.; Farhan, M. Water Balance, Supply and Demand and Irrigation Efficiency of Indus Basin. Water 2011, 49, 13–38. [Google Scholar]
  7. GOP. Pakistan Vision 2025: One Nationa—One Vision; Ministry of Planning Development and Reform: Islamabad, Pakistan, 2017. [Google Scholar]
  8. Rasul, G.; Sharma, B. The nexus approach to water–energy–food security: An option for adaptation to climate change. Clim. Policy 2016, 16, 682–702. [Google Scholar] [CrossRef]
  9. Levite, H.; Sally, H.; Cour, J. Testing water demand management scenarios in a water-stressed basin in South Africa: Application of the WEAP model. Phys. Chem. Earth 2003, 28, 779–786. [Google Scholar] [CrossRef]
  10. Hassan, D.; Rais, M.; Ahmed, W.; Bano, R.; Burian, S.; Ijaz, M.; Bhatti, F. Future water demand modeling using water evaluation and planning: A case study of the Indus Basin in Pakistan. Sustain. Water Resour. Manag. 2019, 5, 1903–1915. [Google Scholar] [CrossRef]
  11. Amin, A.; Iqbal, J.; Asghar, A.; Ribbe, L. Analysis of current and future water demands in the Upper Indus Basin under IPCC climate and socio-economic scenarios using a hydroeconomic WEAP Model. Water 2018, 10, 537. [Google Scholar] [CrossRef]
Figure 1. Location of Lower Bari Doab Canal command area.
Environsciproc 25 00055 g001
Figure 2. Soil map.
Figure 2. Soil map.
Environsciproc 25 00055 g002
Figure 3. Rabi and Kharif season land use data.
Environsciproc 25 00055 g003
Figure 4. Water demand in MCM.
Environsciproc 25 00055 g004
Figure 5. Water demand for Kasur, Okara, Sahiwal, and Khanewal.
Environsciproc 25 00055 g005
Figure 6. Unmet demand for Sahiwal and Khanewal.
Environsciproc 25 00055 g006
Figure 7. Low population growth.
Environsciproc 25 00055 g007
Figure 8. Medium population growth rate.
Environsciproc 25 00055 g008
Figure 9. High population growth rate.
Environsciproc 25 00055 g009
Figure 10. High living standards.
Environsciproc 25 00055 g010
Table 1. Data used and their sources and format for LBDC command area.
DataSourcesTime
Climatic dataPakistan Meteorological Dept., Monthly and global assembled and satellite datasetsDaily, Monthly
Flows of LBDCIrrigation department, GOPDaily
Land use dataMODISYearly
Soil dataWorld Soil map.Daily Discharge data
Population (District wise), Water consumption, Growth ratePakistan Bureau of Statistics, World Bank DataYearly record
Table 2. Soil type and code.
Sr. no.SNUMSoil Types
13736Clay Loam
23878Loam
33883Clay Loam
Disclaimer/Publisher’s Note: The statements, opinions and data contained in all publications are solely those of the individual author(s) and contributor(s) and not of MDPI and/or the editor(s). MDPI and/or the editor(s) disclaim responsibility for any injury to people or property resulting from any ideas, methods, instructions or products referred to in the content.

