Next Article in Journal
The Impacts of Climate Change on Monsoon Flood Situations in Pakistan
Previous Article in Journal
Evaluating Methods to Enhance the Taste and Health Benefits of Alternative Potable Waters
 
 
Please note that, as of 4 December 2024, Environmental Sciences Proceedings has been renamed to Environmental and Earth Sciences Proceedings and is now published here.
Proceeding Paper

Artificial Neural Networks and Regression Modeling for Water Resources Management in the Upper Indus Basin †

by
Muhammad Imran
1,
Muhammad Danish Majeed
1,2,*,
Muhammad Zaman
1,*,
Muhammad Adnan Shahid
1,2,
Danrong Zhang
3,
Syeda Mishal Zahra
1,2,
Rehan Mehmood Sabir
1,2,
Muhammad Safdar
1,2 and
Zahid Maqbool
2
1
Department of Irrigation & Drainage, Faculty of Agricultural Engineering & Technology, University of Agriculture, Faisalabad 38000, Pakistan
2
Agricultural Remote Sensing Lab-(ARSL)-NCGSA, University of Agriculture, Faisalabad 38000, Pakistan
3
College of Hydrology and Water Resources, Hohai University, Nanjing 210098, China
*
Authors to whom correspondence should be addressed.
Presented at the 7th International Electronic Conference on Water Sciences, 15–30 March 2023; Available online: https://ecws-7.sciforum.net.
Environ. Sci. Proc. 2023, 25(1), 53; https://doi.org/10.3390/ECWS-7-14199
Published: 14 March 2023
(This article belongs to the Proceedings of The 7th International Electronic Conference on Water Sciences)

Abstract

:
A flood is a natural disaster. Heavy rainfall and overflow frequently cause enclosed land areas to fill with water, resulting in considerable loss of human life and property, including damage to buildings, bridges, electric supply networks, and transportation, and economic concern. This work was carried out in the Upper Indus Basin (UIB). We developed an artificial intelligence model for forecasting the flood events in this study. Long-short term memory (LSTM) and seasonal auto-regressive integrated moving average (SARIMA) were used in this study to forecast flood events. This study used a dataset from 1971–2009 and divided it into training, testing, and forecasting from 1971–2004, 2005–2009, and 2010–2014, respectively. The best statistical analysis result was observed with the LSTM model, which documented the value of root mean squared error (RMSE) at 22.79 and 35.05 for training and testing, respectively. Hence, the results of the study highlight that the LSTM model was the most suitable among the artificial neural networks for flood event forecasts. This current study will help in the forecasting of high storms for effective water resources management.

1. Introduction

Most Asian countries depend on agriculture, and Pakistan is the country most dependent on agriculture. A huge part of the gross domestic production (GDP) of Pakistan is based on agriculture, and the agriculture sector of this country is mostly reliant on irrigation water generated by the Upper Indus Basin. The water scarcity report of the International Monetary Fund (IMF) ranked Pakistan in the third position among water scarcity in the year 2018. The International Panel for Climate Change (IPCC) estimated that the total temperature increased by 0.72 °C in the period from 1951 to 2012. The expected temperature will likely increase from 1 °C to 3 °C until 2050 and from 2 °C to 5 °C until 2100, depending on the different gas emission circumstances documented by IPCC-2013. Water reserves are the core of most crises in countries such as Pakistan, where the economy, culture, and textiles are intimately connected to irrigation water. The effects of warming drift on the outer circle are particularly unique and complex [1].
Throughout history, floods have been recorded as one of the most devastating natural disasters capable of causing severe personal damage as well as destroying property. In recent years, the expansion of flood events has been a problem resulting in a large number of deaths every year. Another main reason is that as the human population is increasing, human communities are becoming closer to water resources. Flood-affected people’s infrastructure and lives have been severely damaged and disturbed [2].
In this study, data-driven approaches based on the statistical relationship between input and output data were used to forecast flood events in the UIB. A possible alternative to the current approaches for the hydrological forecast of streamflow may be data-driven approaches such as ANNs [3].

2. Materials and Methods

2.1. Study Area

Research study area of Indus basin spans within the following geographical points of 33–75° N and 72–78° E covered by the Swat hillock, along with the Mohamad, Mangla Complex in the north, the district of Charsadda in the southwesterly area, and the Kotli, Mangla, Kalam Complex to the west, as shown in Figure 1. Kalam Station is at a high mean sea level of 5821 km and Munda Dam is at a low mean sea level of 376 km. The research region is characterized by climatic lateral tropical and wet temperate zones, with thunderstorms and snowfall. Summers are hot (41.9 °C) and winters are frigid (0.8 °C) in the chosen location. The effluvium ornament is a cardinal aspect in determining water potential. The flow of a locality is defined by its effluvium compactness, which is the relative amount of rainfall that enters. As a result, the lower the runoff, the higher the chances of recharging.

2.2. Data Collection and Model Description

Pakistan is one of the most climatically varied countries due to its wide temperature range, and it has a higher occurrence of rainfall in the UIB including extreme flood events. Extreme climatic devastations specifically in the forms of floods have impacted precious lives and financial losses in Pakistan in the last three decades (e.g., 2011, 2020 and 2022). Data on the extreme events of stream flow were collected for the duration from 1971–2009. The data were collected from the Water and Power Development Authority (WAPDA) and the Pakistan Meteorological Department (PMD) [4].

2.2.1. LSTM Model

Deep learning is a type of neural network that uses a larger number of layers and layer types to model complex systems and interactions. Because traditional neural networks cannot retain temporal information, recurrent neural networks were developed using previous time step information. LSTMs are a deep learning version of recurrent neural networks that can remember information for longer. To change the data, LSTM cells use gates, vector addition, and multiplication to remove or add information.

2.2.2. SARIMA Model

SARIMA is a regression model, and all regression models assume that the values in a dataset are independent of one another. When using regression to predict time series, it is critical to ensure that the data are stationary, which means that statistical properties such as variance do not change over time. In ARIMA, “AR” denotes the “autoregressive” component, which is the lag of the stationary series, “MA” denotes the lags of the forecast errors, and “I” denotes the order of differentiation to make the series stationary. The SARIMA (1, 0, 1) × (0, 1, 1) 12 model was used in this study for the forecasting of flow in the UIB. To ensure that the time series data were stationary, the Dickey–Fuller test was used. The resulting p-value was less than 0.03 and the test static was −3.739768, allowing us to reject the null hypothesis and conclude that the data were stationary. The seasonality period(s) was a 12-month moving average, and the minimum AIC score was 138.065 at 29 time steps.

2.2.3. Model Evaluation Criteria

Root mean square error (RMSE) is a statistical method commonly used to compare predicted values with observed values in hydrology fields to evaluate the performance of forecasting models. Based on the relative range of the data, the RMSE is frequently used to evaluate how closely the predicted values match the observed values.
RMSE = 1 n i = 1 n Y Yi 2
In Equation (1), Y and Yi are actual and predicted discharges at time t, respectively; Y is the mean of actual discharges; and n is the total number of observations.

2.2.4. Model Structure

Our study is related to open-source software libraries. According to the literature, Python [5] is the programming language of choice. The NumPy [6], Pandas [7], and Matplotlib [8] libraries are also imported for data processing, management, and visualization. We created the LSTM model and TensorFlow [9], a Google open-source software library. TensorFlow was originally designed to conduct machine learning, deep learning, and numerical computation research using data flow graphs. However, this framework is comprehensive enough to be applicable to a wide range of domains.

3. Results and Discussions

The forecasting models developed were validated and tested using independent data. When comparing the actual data and forecast values made during the validation and testing process, the RMSE values were used to evaluate the qualitative and quantitative performance of the scenarios. The size of the training datasets varies depending on the scenario. A thirty-four-year dataset (1971–2004) was used for training, while a five-year dataset (2005–2009) was used for testing and a five-year dataset (2010–2014) was used for forecasting.
The RMSE in the two-prediction model for testing and training is shown in Table 1. From the observation of the below RMSE results, the LSTM model performs better for training as well as testing as compared to the SARIMA model.

Training, Testing, and Forecast Results

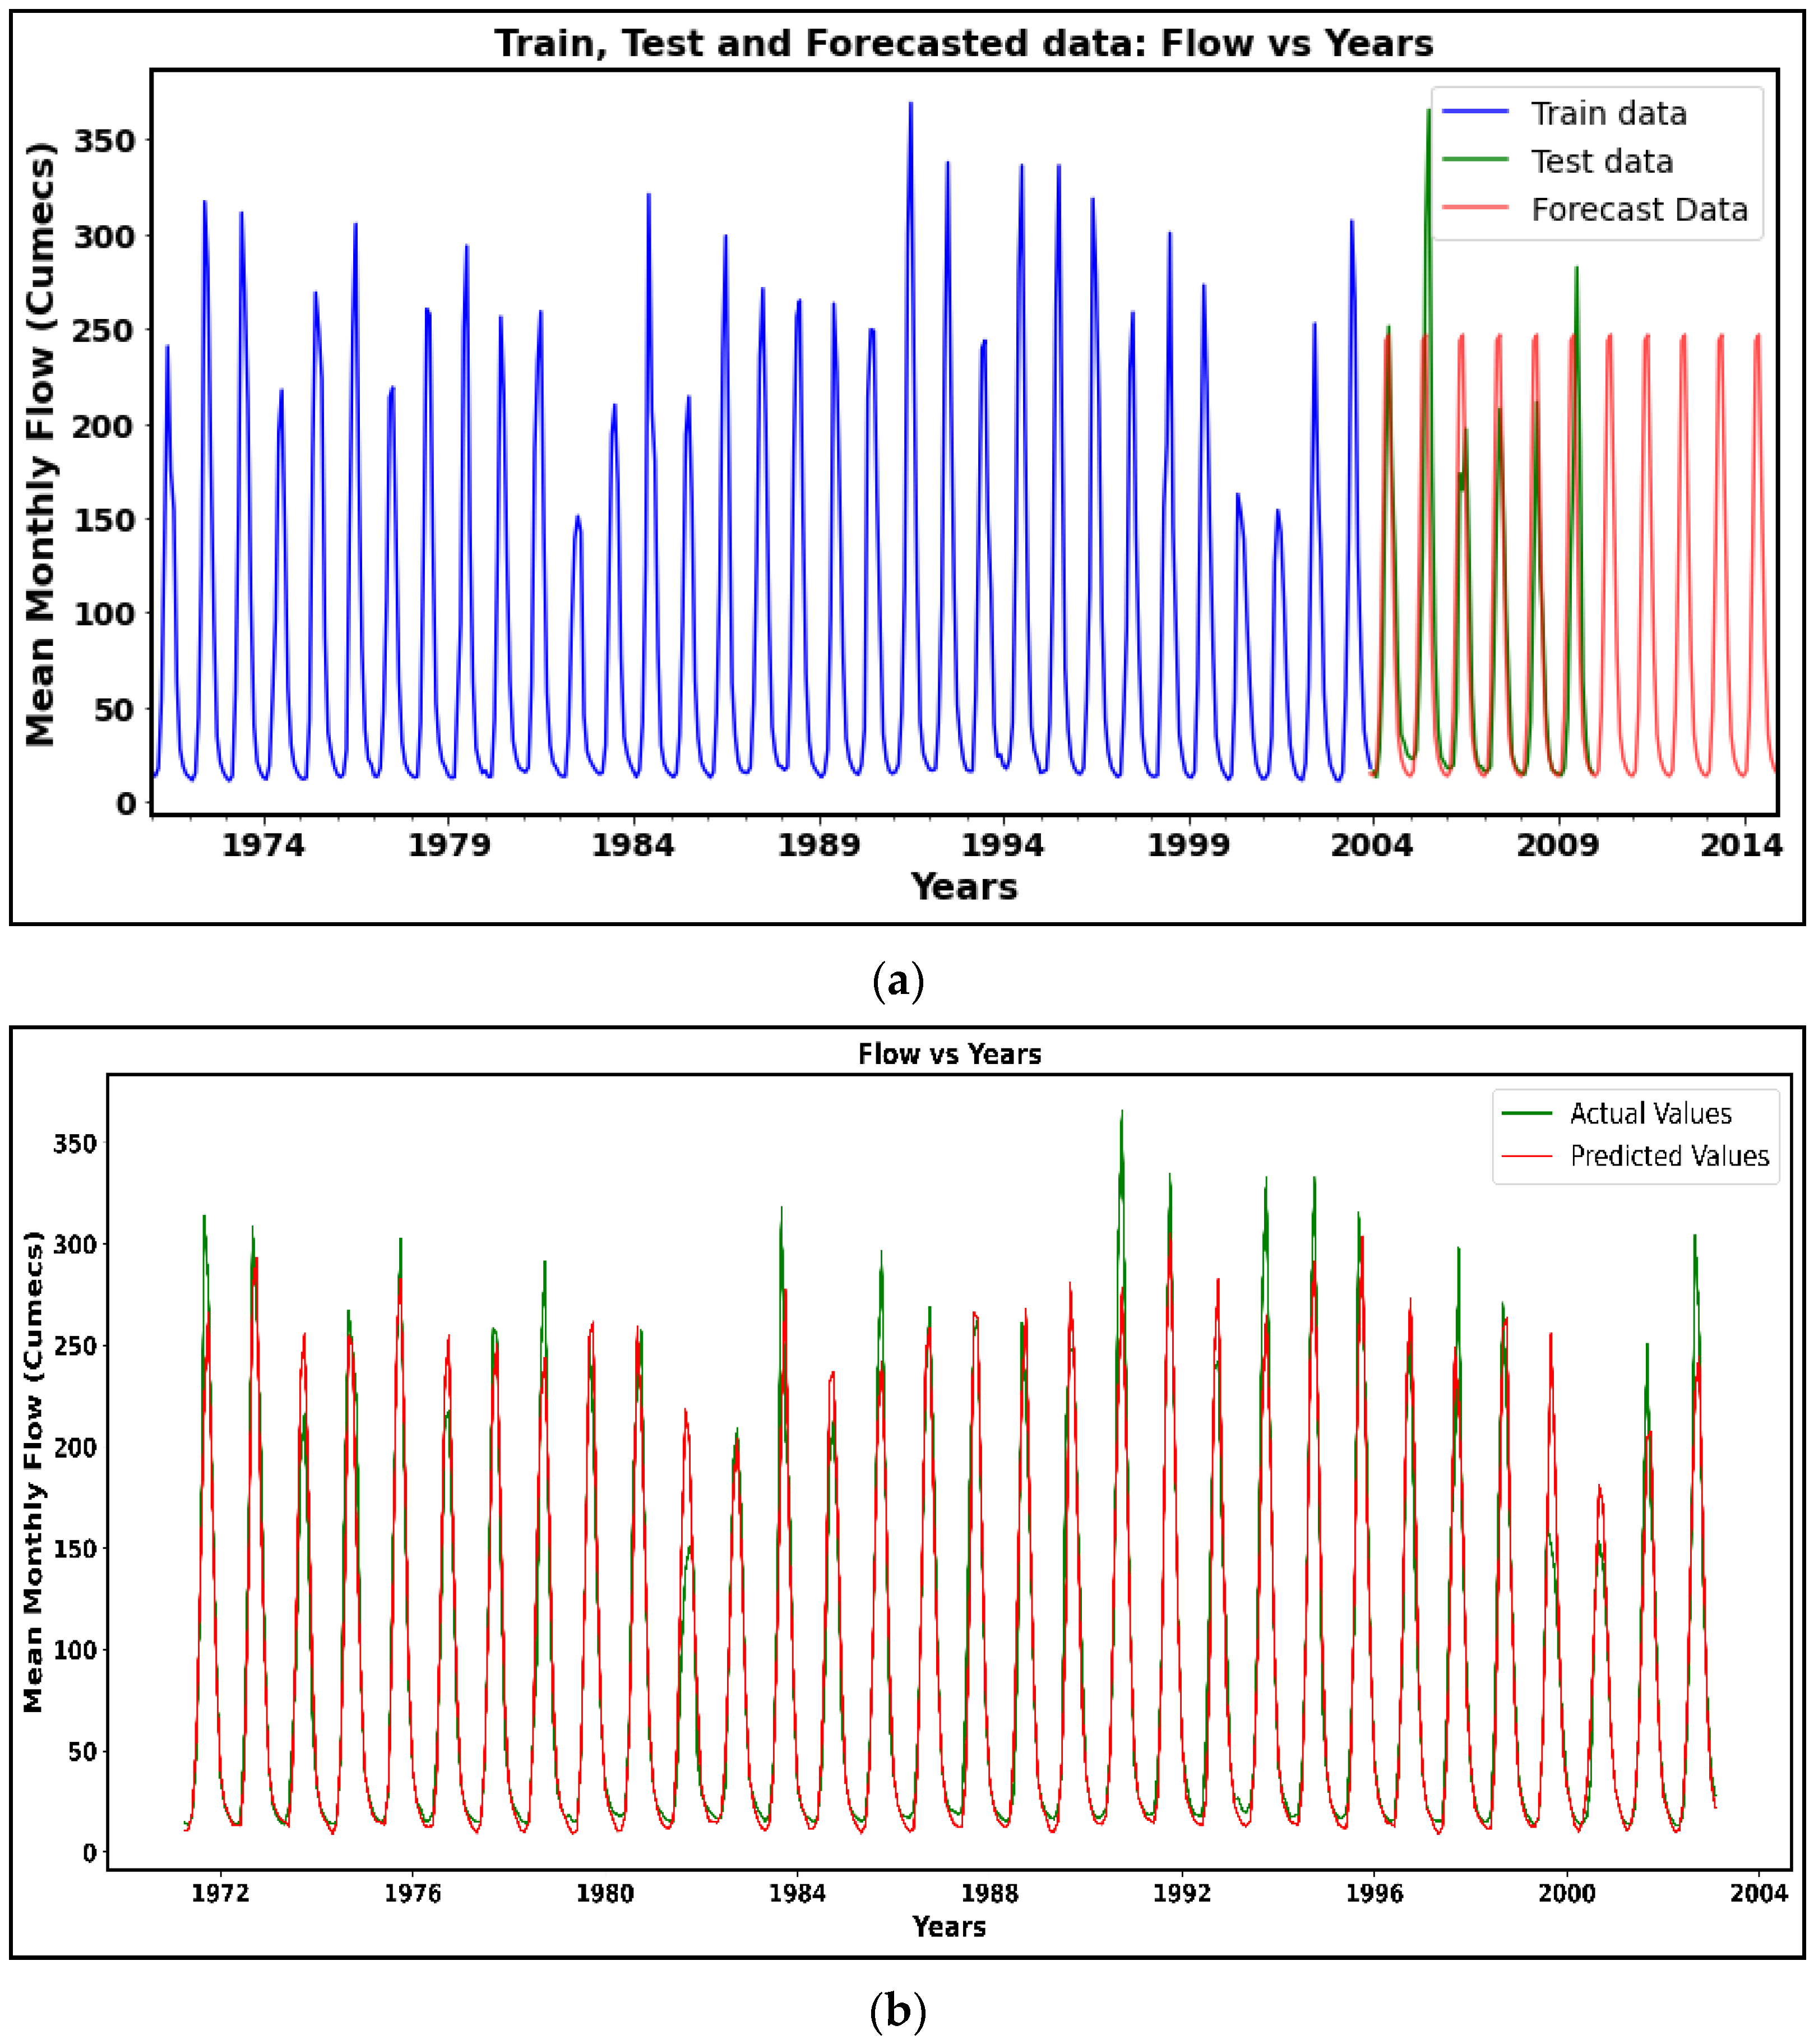
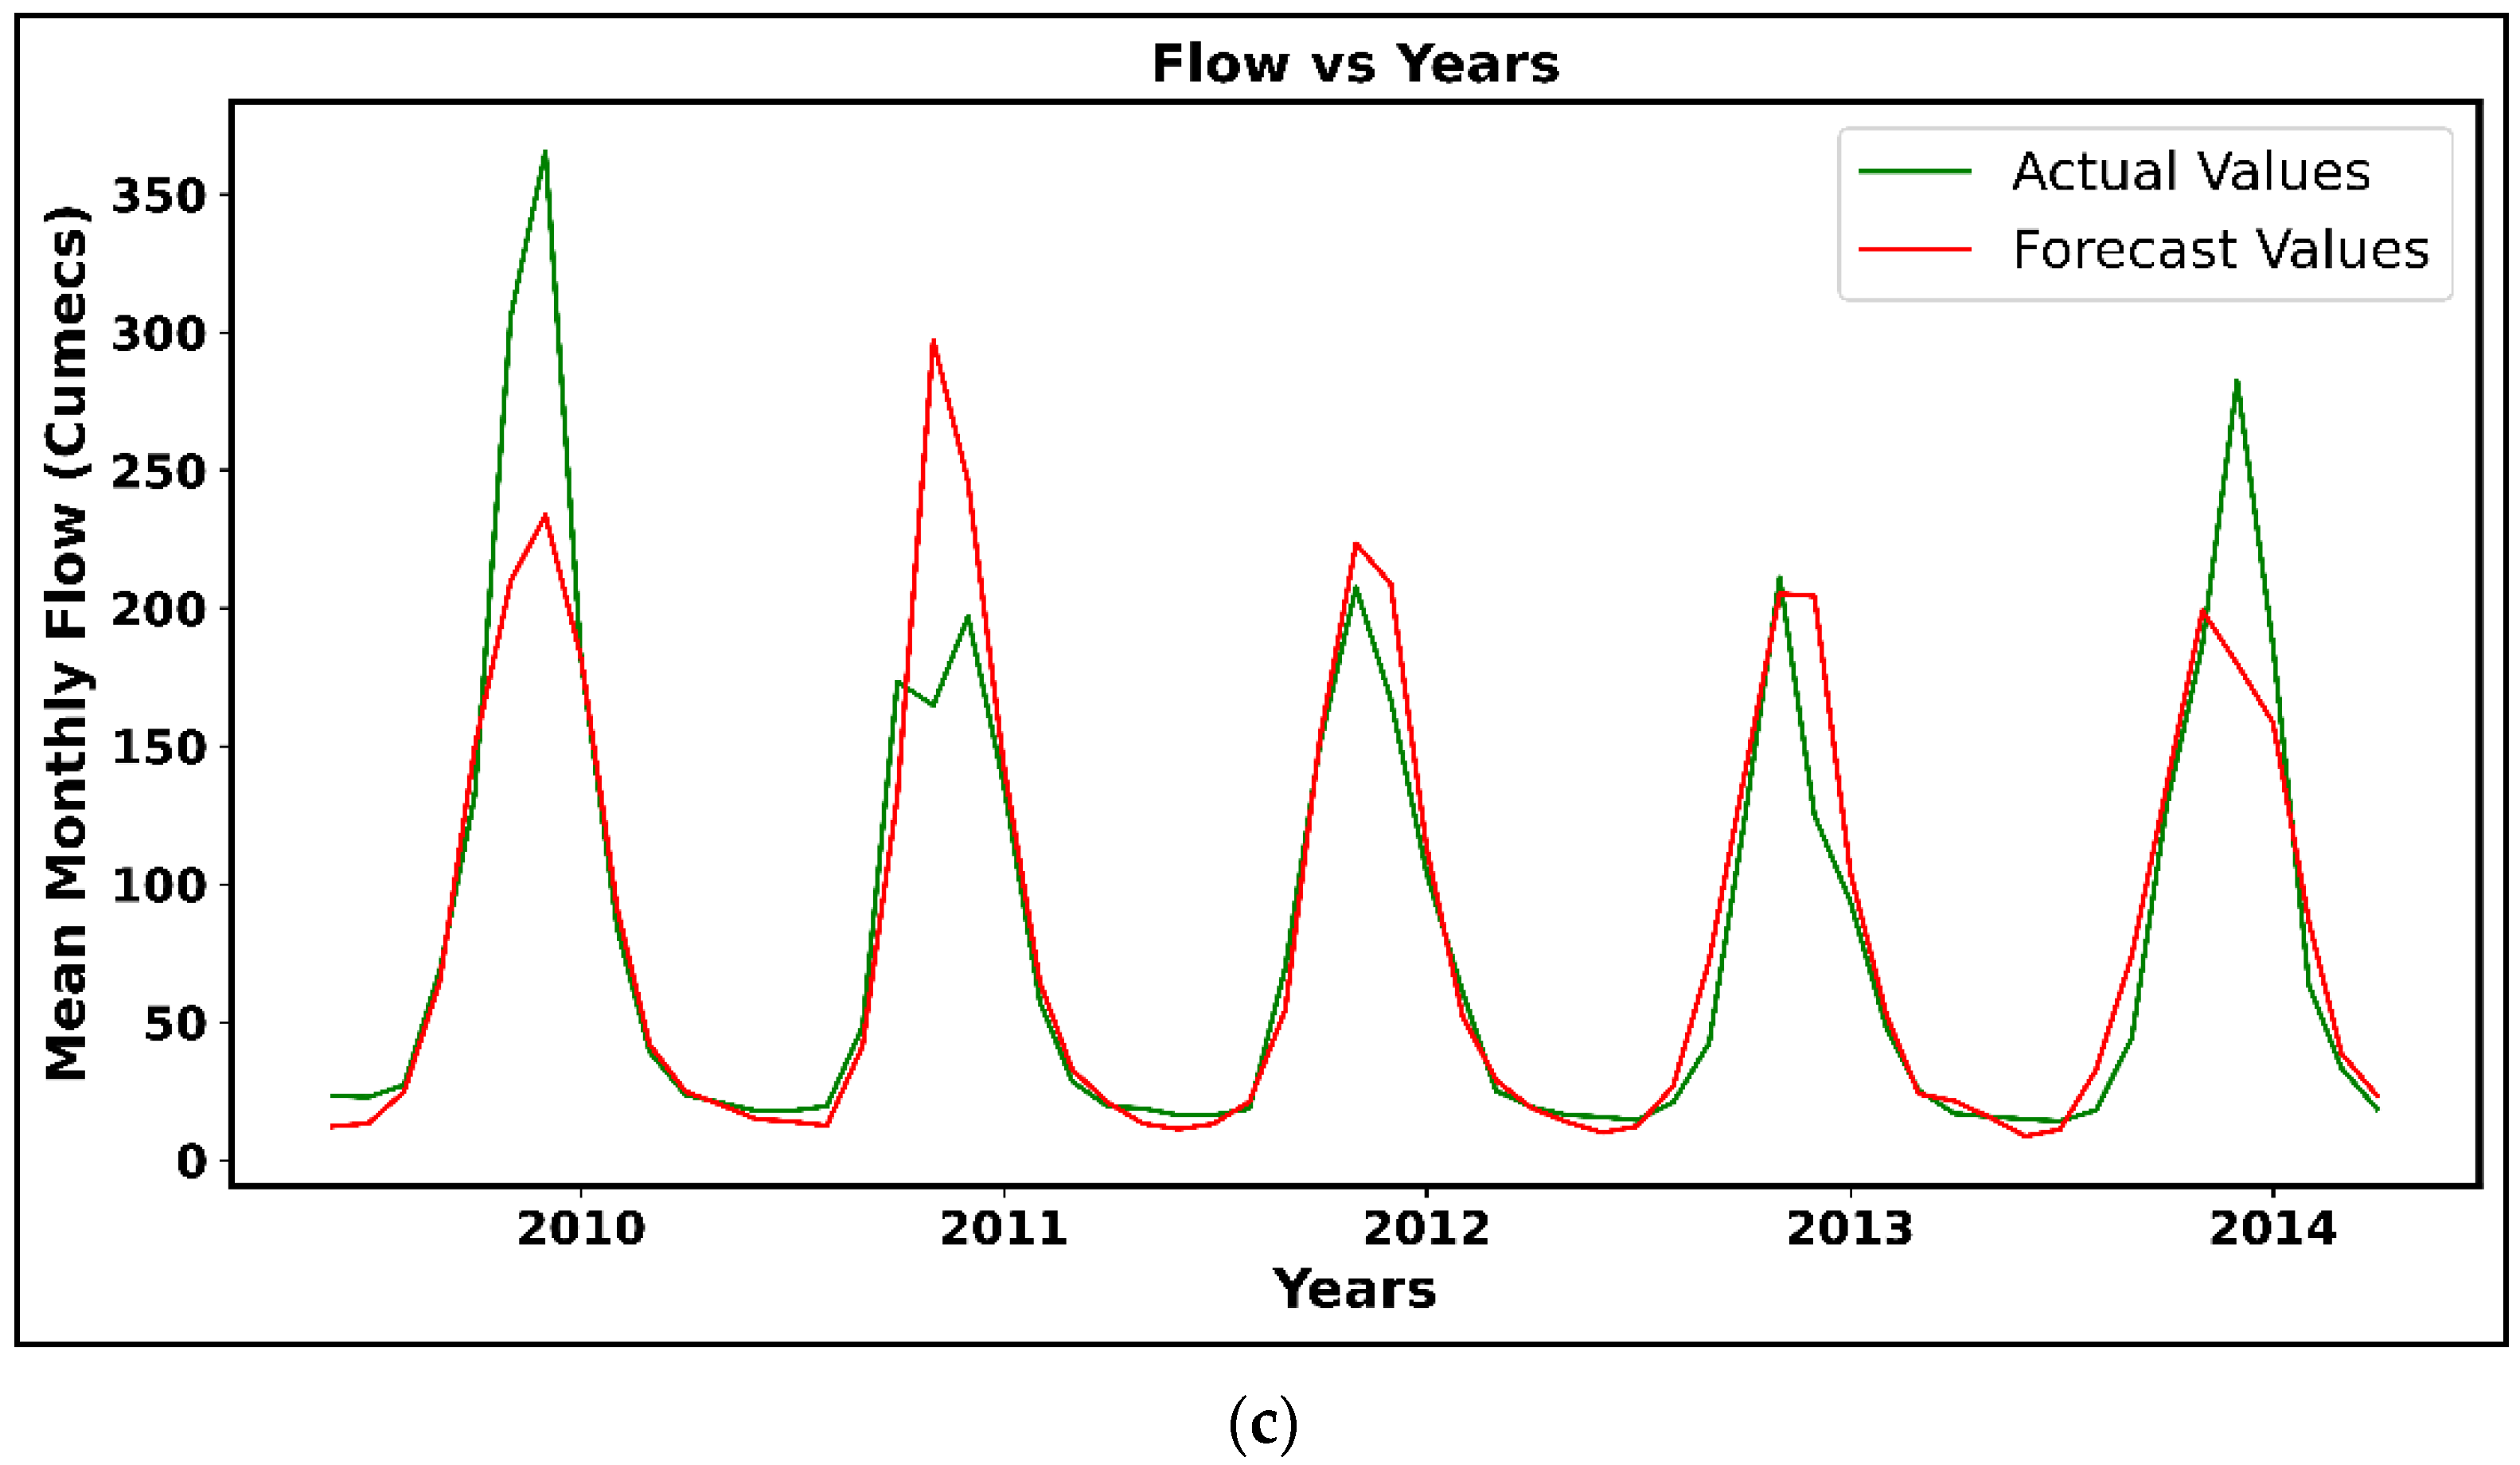
Figure 2a–c shows the visual comparison results of the actual and forecasted flow data from Kalam Station. Figure 2a shows the comparison results of the SARIMA model at Kalam Station. The blue line shows the training data, the green line shows the testing data, and the red line shows the forecasted data, which are the output data of our model. Figure 2b,c shows the comparison result of the LSTM model at Kalam Station. In Figure 2b, the green line shows the training data (actual values), and the red line shows the testing data (predicted values), while in Figure 2c, the green line is the observed values from the model and the red line is the forecasted values, which are the output data of our model.

4. Conclusions

Accurate time series forecasting for upcoming flood events is important, but it is a challenging task such as in Pakistan. The flood forecasting at the Swat River flow gauging station, particularly for downstream stations that lack discharge information, such as Saidu Sharif in this study, plays an important role in early flood warning systems. In this research, we examined the classical statistical models used such as the deep learning model, LSTM, and the regression model, SARIMA. In our comparison of the models for Kalam Station, the LSTM model achieved better results and more accurate forecasting performance than the SARIMA model. Linear data modeling of water flows for SARIMA yield better result as compared to other statistical deep learning models which are good for nonlinear datasets. The RMSE values of the LSTM model fit to the series found for training and testing; for one-year-ahead forecasting, the values are 22.79 and 35.05, respectively. These results indicates that the deep learning algorithm is a dependable ideal solution for flood prediction due to its high precision.

Author Contributions

Conceptualization, M.I., M.Z. and M.D.M.; Models selection for water modeling, M.Z., M.A.S. and S.M.Z.; Data Collection, M.I., M.S. and Z.M. Model Training, Testing, and Forecast, M.I., M.D.M. and R.M.S.; Future Directions & Conclusions, M.Z. and D.Z.; writing—original draft preparation, M.I., M.D.M. and R.M.S.; writing a review and editing, M.I. and M.D.M. All authors have read and agreed to the published version of the manuscript.

Funding

This research received no external funding.

Institutional Review Board Statement

Not applicable.

Informed Consent Statement

Not applicable.

Data Availability Statement

Available on request after due procedure.

Conflicts of Interest

The authors declare no conflict of interest.

References

  1. Shahid, F. Climate Change: Impacts on Pakistan and Proposed Solutions. Pak. Soc. Sci. Rev. 2021, 5, 223–235. [Google Scholar] [CrossRef]
  2. Gude, V.; Corns, S.; Long, S. Flood Prediction and Uncertainty Estimation Using Deep Learning. Water 2020, 12, 884. [Google Scholar] [CrossRef]
  3. Atashi, V.; Gorji, H.T.; Shahabi, S.M.; Kardan, R.; Lim, Y.H. Water Level Forecasting Using Deep Learning Time-Series Analysis: A Case Study of Red River of the North. Water 2022, 14, 1971. [Google Scholar] [CrossRef]
  4. Jawad, M.; Nadeem, M.S.A.; Shim, S.-O.; Khan, I.R.; Shaheen, A.; Habib, N.; Hussain, L.; Aziz, W. Machine Learning Based Cost Effective Electricity Load Forecasting Model Using Correlated Meteorological Parameters. IEEE Access 2020, 8, 146847–146864. [Google Scholar] [CrossRef]
  5. Le, X.H.; Ho, H.V.; Lee, G.; Jung, S. Application of Long Short-Term Memory (LSTM) Neural Network for Flood Forecasting. Water 2019, 11, 1387. [Google Scholar] [CrossRef]
  6. Van Der Walt, S.; Colbert, S.C.; Varoquaux, G. The NumPy Array: A Structure for Efficient Numerical Computation. Comput. Sci. Eng. 2011, 13, 22–30. [Google Scholar] [CrossRef]
  7. McKinney, W. Data structures for statistical computing in python. Proc. 9th Python Sci. Conf. 2010, 1, 56–61. [Google Scholar] [CrossRef]
  8. Hunter, J.D. Matplotlib: A 2D graphics environment. Comput. Sci. Eng. 2007, 9, 90–95. [Google Scholar] [CrossRef]
  9. Abadi, M.; Agarwal, A.; Barham, P.; Brevdo, E.; Chen, Z.; Citro, C.; Corrado, G.S.; Davis, A.; Dean, J.; Devin, M.; et al. TensorFlow: Large-Scale Machine Learning on Heterogeneous Distributed Systems. arXiv 2016, arXiv:1603.04467. [Google Scholar]
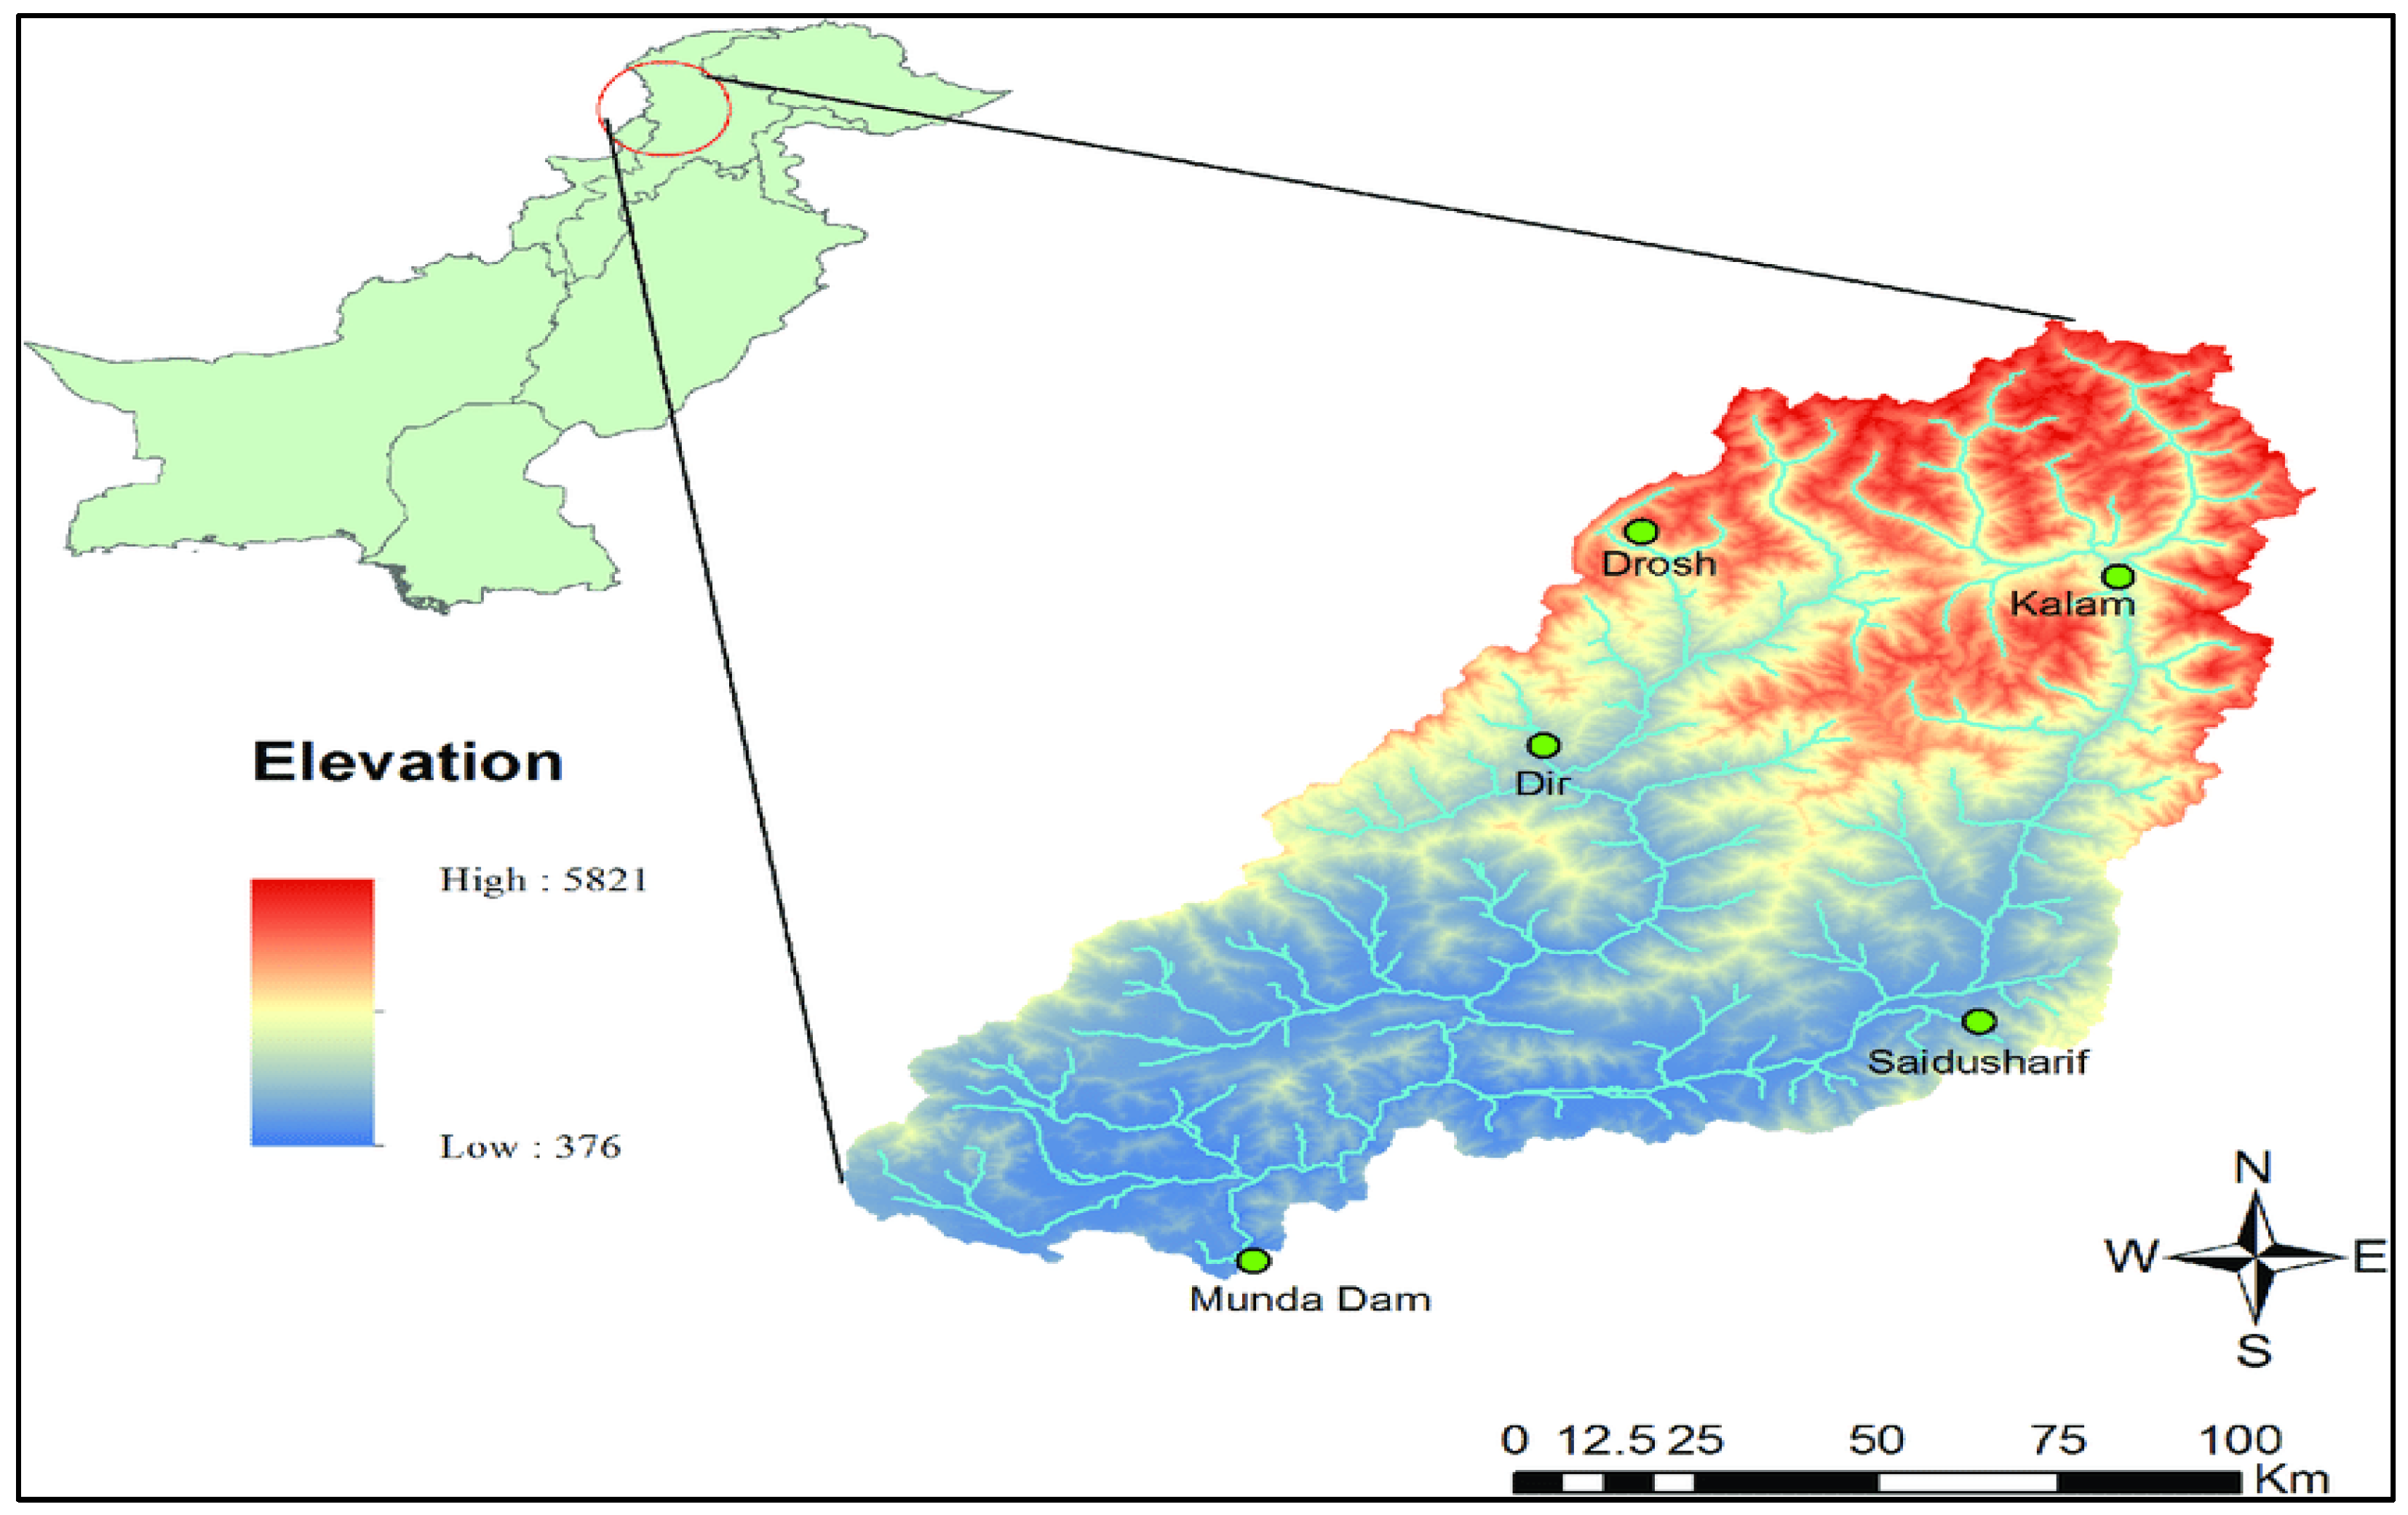
Figure 1. Digital elevation model of the Upper Indus Basin with gauge stations.
Environsciproc 25 00053 g001
Figure 2. Visual comparison of actual and forecasted data: (a) SARIMA, (b) LSTM training and testing, and (c) LSTM forecasting.
Environsciproc 25 00053 g002aEnvironsciproc 25 00053 g002b
Table 1. Model Evaluation Results.
RMSELSTMSARIMA
Training22.7927.82
Testing35.0554.42
Disclaimer/Publisher’s Note: The statements, opinions and data contained in all publications are solely those of the individual author(s) and contributor(s) and not of MDPI and/or the editor(s). MDPI and/or the editor(s) disclaim responsibility for any injury to people or property resulting from any ideas, methods, instructions or products referred to in the content.