1. Introduction
Today, the problem of the continuing decrease in available freshwater reserves is widely recognized, which is significantly magnified if one considers the effects of climate change on the spatial and temporal distribution of water resources [
1,
2,
3,
4,
5]. Consequently, there is an urgent environmental and societal need to implement efficient management practices to water distribution networks (WDNs), which constitute the core infrastructure for drinking water supply to users.
The first step towards developing efficient management strategies is the accurate hydraulic modeling of WDNs using a dedicated software package (e.g., EPANET) in order to identify their weaknesses and evaluate their overall operational condition. To do so, one needs to develop a detailed representation (i.e., a model) of the pipeline grid using appropriate hydraulic objects (e.g., pipes, pumps, valves, junctions, reservoirs, tanks, etc.). The effectiveness of the modeling procedure is mainly determined by the modeling accuracy, which is significantly affected by the density of the computational nodes (i.e., junctions). Although a high nodal density model produces more accurate results, it also dramatically increases the computational requirements, leading to time-consuming solutions. Under this setting, the current work focuses on developing a practical methodology for the optimal allocation of computational nodes, in terms of modeling accuracy and computational cost.
2. Area of Application
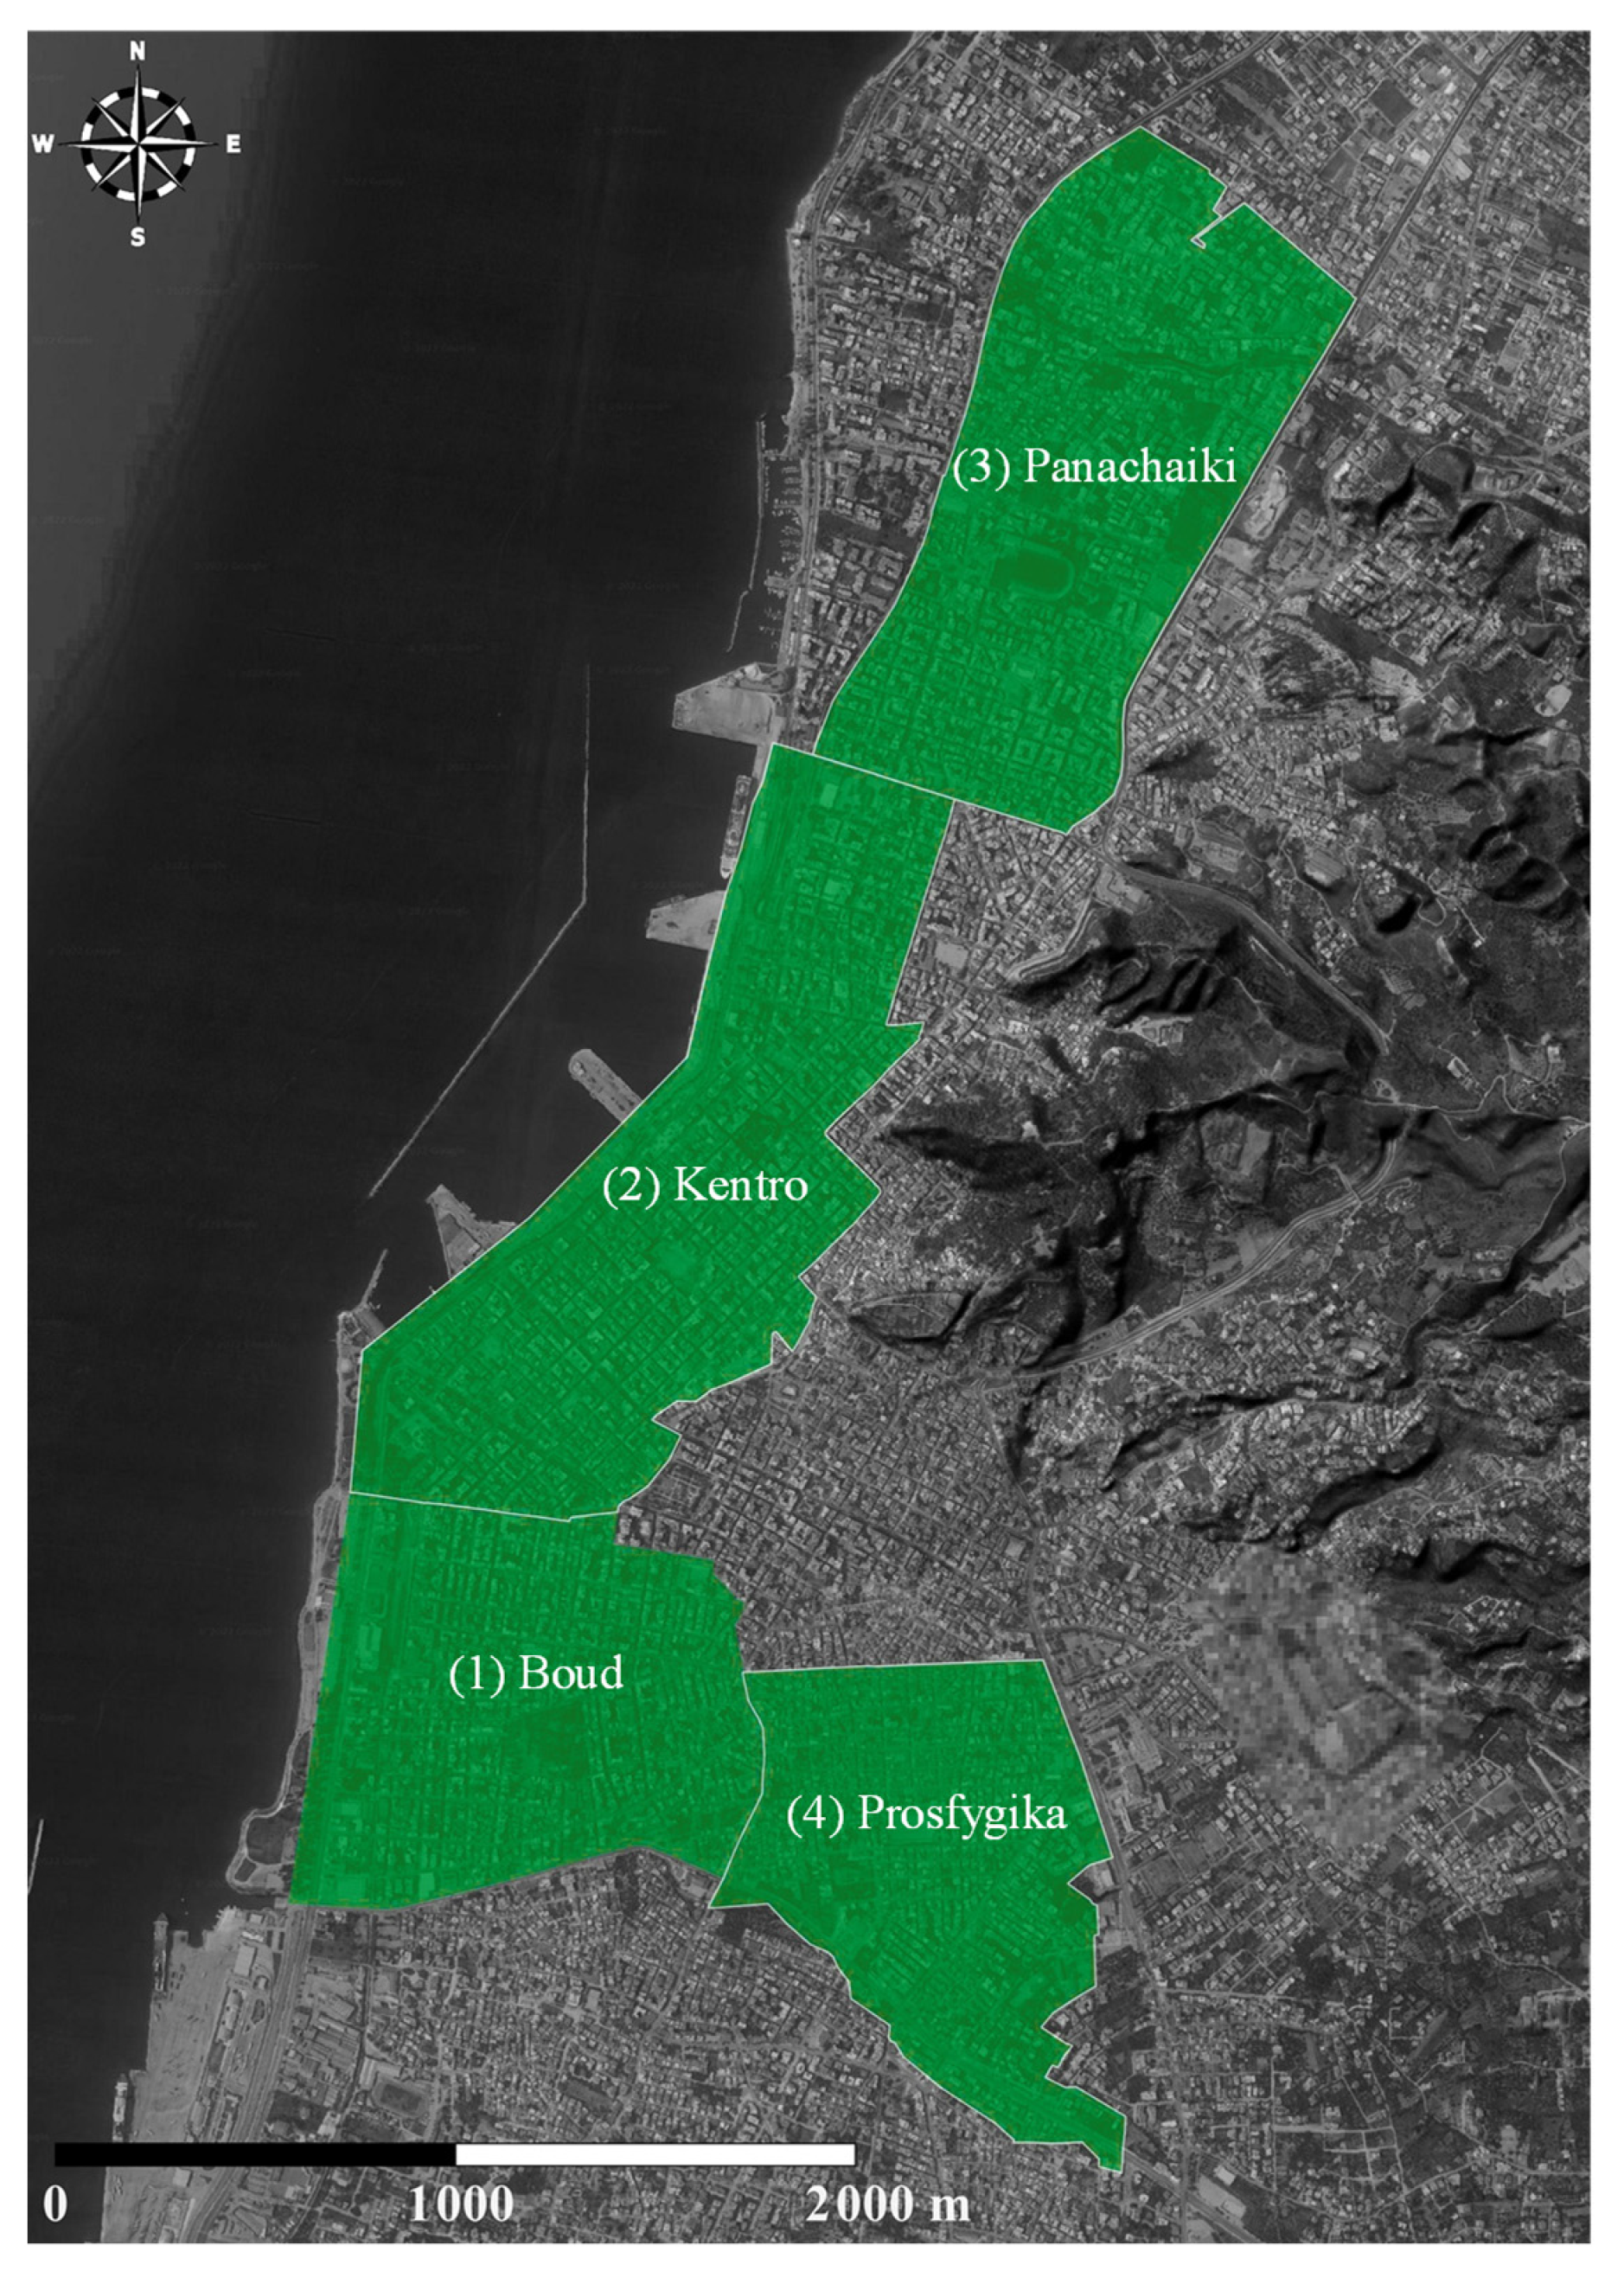
We have applied the analysis that follows to the four largest and most highly populated pressure management areas (PMAs) of the water distribution network of the city of Patras, in western Greece (namely Boud, Kentro, Panachaiki, and Prosfygika; see
Figure 1). The corresponding PMAs, which share similar characteristics regarding their population density as well as land uses and topography, consist of over 200 km of HDPE and PVC pipes, and cover most of Patras’s city center (about 4 km
2), providing water to more than 58,000 customers, as reported by the associated public authorities (see
Table 1).
3. Methodology
3.1. Hydraulic Model Design
To realistically describe a WDN, the nodal density should be high enough to effectively describe both the area’s topographic variability as well as the original connectivity of the network, while considering all necessary hydraulic parameters (e.g., pipe material and diameter). Under this concept, we chose to place computational nodes at the following: (a) intersections between two or more pipes, (b) changes in pipes’ diameters and/or material, (c) fire hydrant locations, (d) dead ends, and (e) at the locations of high-water demand consumers [
6].
To take into account the area’s topographic variability (which highly affects the analysis’s pressure outcome; see [
7,
8,
9]), we used a sensitivity analysis to determine an appropriate nodal density.
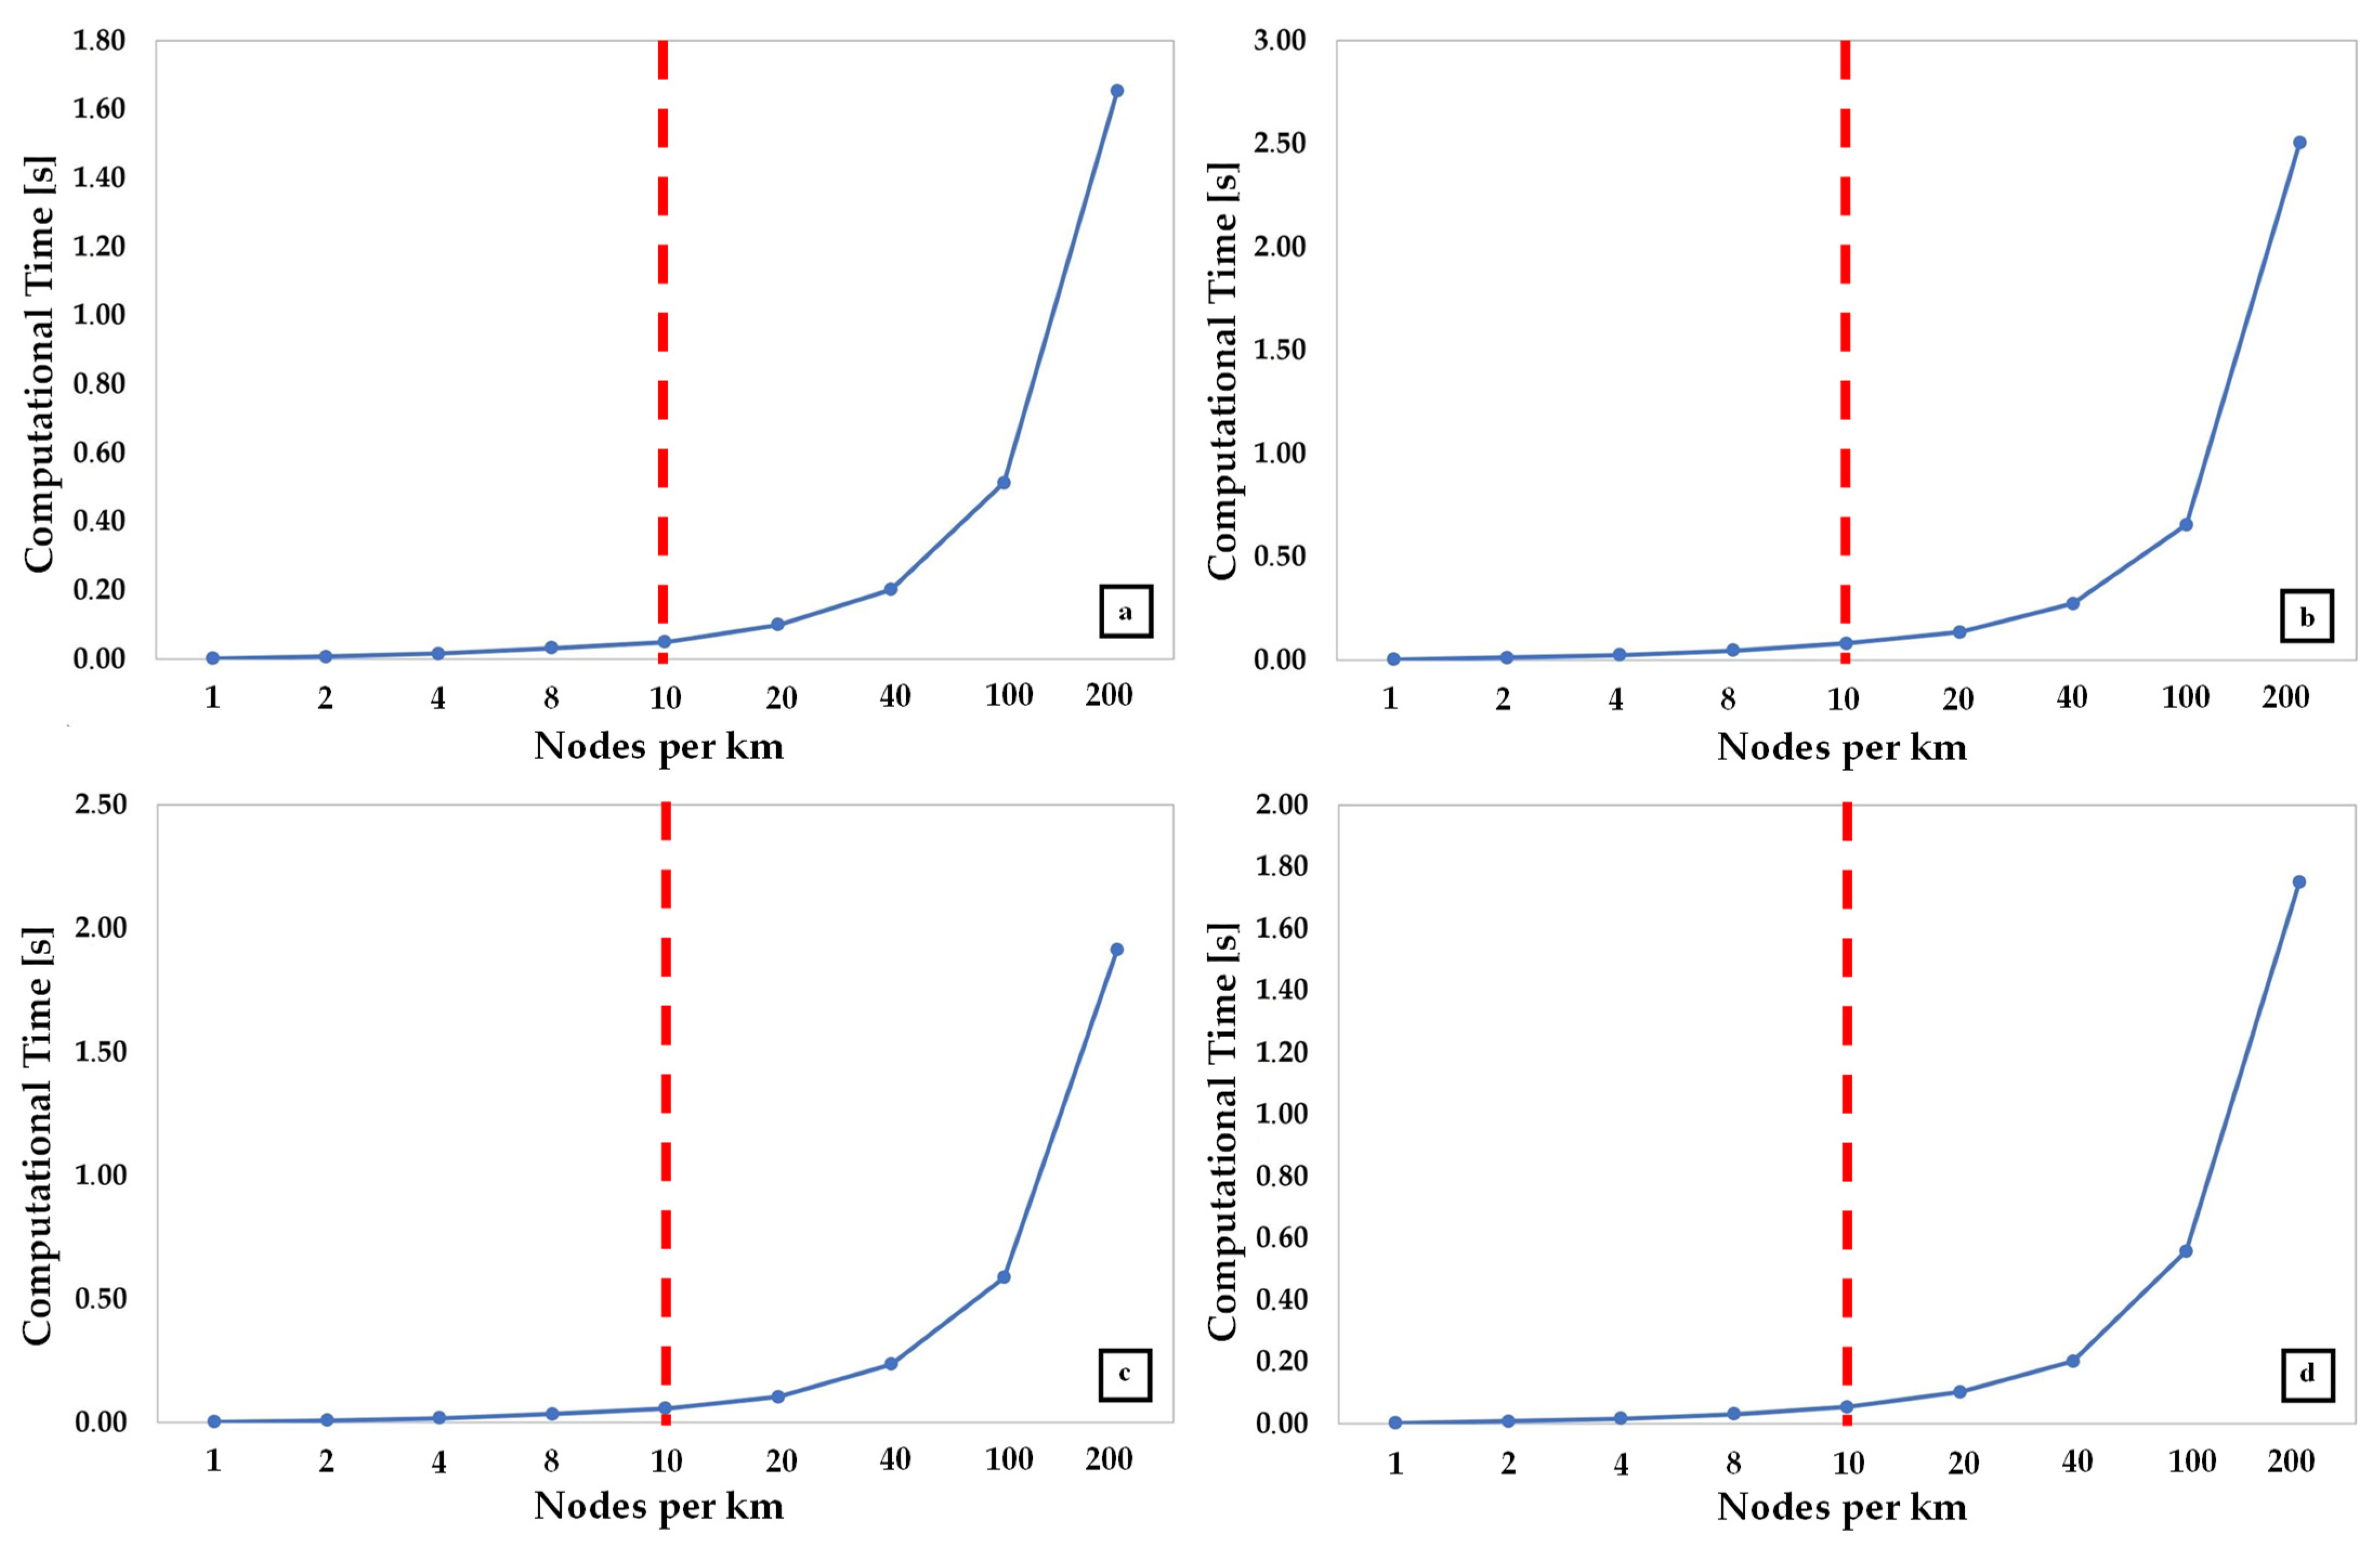
Figure 2 summarizes the corresponding EPANET simulation’s time complexity (i.e., the computational time), in terms of network’s nodal density (i.e., number of nodes per km). It can be observed that time complexity increases almost exponentially with increasing nodal density for all four cases, as a result of the heavier computational load. Selection of a proper solution (i.e., nodal density) is achieved through an optimal trade-off between time complexity and the required accuracy of the simulation, tailored to each specific case, as a function of topographic variability. For the purposes of the current study, we opted to incorporate 10 nodes per km (i.e., at least one computational node per 100 m), as for larger nodal densities the computational time increases significantly.
3.2. Real Losses (RL, Leakages) Allocation
To perform the hydraulic simulation, firstly, we determined the total water demand at each network node, and divided it into two parts: a demand-driven component and a pressure-driven component. The former is based on the flow pattern, as consumers’ usage varies throughout the day, while the pressure-driven component accounts for network leaks, which increase when the applied pressure increases. The modeling of leaks is done by assuming that the leakage rate is proportional to the square root of the difference between the actual nodal pressure and the minimum pressure necessary to fulfill consumption requirements. To do so, we multiply the initial leakage rates at each computational node by the parameter:
where
sj is the numerically simulated head at node
j = 1, …,
n (i.e., the sum of nodal elevation and pressure head), and
sj* is the minimum threshold head at node
j (i.e., the sum of nodal elevation and the minimum required pressure head). The hydraulic simulation is repeated until convergence (see [
9]).
4. Results
We implemented the proposed hydraulic modeling methodology (see
Section 3) for the four largest pressure management areas of the water distribution network of the city of Patras, based on their geometric characteristics and hydraulic parameters as well as the area’s altitudinal variation. In order to estimate the water consumption, we used flow-pressure data at 1 min temporal resolution for the 4-month-long summer period from 1 June 2019–31 August 2019, with the data having been collected from the pressure regulation stations of the water distribution network (WDN) of the City of Patras in Western Greece. Flow and pressure data for each of the four stations were obtained from the Municipal Enterprise of Water Supply and Sewerage of Patras (DEYAP) and were quality checked to identify and eliminate errors resulting from communication issues and other data transmission malfunctions.
Figure 3 illustrates the nodal pressures and water velocity results for PMAs Boud (
Figure 3a), Kentro (
Figure 3b), Panachaiki (
Figure 3c), and Prosfygika (
Figure 3d), which were obtained through hydraulic simulations using the EPANET 2.x solver for the design and analysis of water networks. It is noted that in all cases the minimum pressure requirements (21 m in PMA Boud, 24 m in PMAs Panachaiki and Prosfygika, and 28 m in PMA Kentro) and maximum speed requirements were met (based on pipe diameters; for more info, see [
6]).
In order to test the accuracy of the proposed methodology, we use on-site pressure data obtained by DEYAP through smart pressure meters located at the most distant nodes of PMAs’ pressure-regulating valves (i.e., the points in
Figure 3 marked in blue).
Table 2 summarizes the calculated pressure values obtained from the smart metering system and the corresponding pressure values obtained by the EPANET solver.
It is observed that the proposed methodology results in almost identical pressure values as the on-site metering, with absolute relative deviations not exceeding 10% for all four cases (7.615%, 9.219%, 3.733%, and 5.139% for PMAs Boud, Kentro, Panachaiki, and Prosfygika, respectively), indicating the robustness of the proposed methodology.
5. Conclusions
Hydraulic modeling of WDNs is an important step towards the development of efficient water management practices and strategies, with the aim of reducing water losses and the associated financial cost and environmental footprint. In the current work, we developed an easily applicable methodology for the effective modeling of WDNs that maintains a sufficient level of estimation accuracy with minimal computational load, using a sensitivity analysis to determine the appropriate nodal density, in order to effectively describe both the topographic variability as well as the original connectivity of the network. Additionally, the water requirement at each node in the network was established by combining two factors: one being driven by demand and the other by pressure, resulting in more accurate depictions of the operational pressures.
The developed hydraulic models allowed us to implement and test a variety of methodologies regarding water loss estimations (see [
7]), the identification of pressure control failures and the release of notifications (see [
5]), as well as the optimal partitioning of WDNs into PMAs, without undermining the overall hydraulic resilience of the network (see [
9]). The developed approaches can significantly reduce the volume of lost water (30% on average in each PMA), which corresponds to approximately €300,000 in annual savings, based on the balance sheet of the fiscal year 2019 (see [
10]).
Author Contributions
Conceptualization, methodological formulation, and interpretation: A.V.S. and A.L.; data preprocessing, formal analysis, verification, visualization, and writing—original draft preparation: A.V.S.; writing—review and editing: A.P., N.T.F. and A.L.; funding acquisition, project administration, and supervision: A.L. All authors have read and agreed to the published version of the manuscript.
Funding
The research project was supported by the Hellenic Foundation for Research and Innovation (H.F.R.I.) under the “1st Call for H.F.R.I. Research Projects to support Faculty Members & Researchers and the procurement of high-cost research equipment grant” (Project Number: 1162).
Institutional Review Board Statement
Not applicable.
Informed Consent Statement
Not applicable.
Data Availability Statement
The data used are protected under a nondisclosure agreement. Acquisition requests should be addressed to DEYAP (
https://www.deyap.gr, accessed on 1 November 2022).
Conflicts of Interest
The authors declare no conflict of interest.
References
- Deng, Y.; Cardin, M.; Babovic, V.; Santhanakrishnan, D.; Schmitter, P.; Meshgi, A. Valuing flexibilities in the design of urban water management systems. Water Res. 2013, 47, 7162–7174. [Google Scholar] [CrossRef] [PubMed]
- Rehan, R.; Knight, M.A.; Unger, A.J.A.; Haas, C.T. Development of a system dynamics model for financially sustainable management of municipal watermain networks. Water Res. 2013, 47, 7184–7205. [Google Scholar] [CrossRef] [PubMed]
- Charalambous, B.; Foufeas, D.; Petroulias, N. Leak detection and water loss management. Water Util. J. 2014, 8, 25–30. [Google Scholar]
- Serafeim, A.V.; Kokosalakis, G.; Deidda, R.; Karathanasi, I.; Langousis, A. Probabilistic estimation of minimum night flow in water distribution networks: Large-scale application to the city of Patras in western Greece. Stoch. Environ. Res. Risk Assess. 2021, 36, 643–660. [Google Scholar] [CrossRef]
- Perdios, A.; Kokosalakis, G.; Fourniotis, N.T.; Karathanasi, I.; Langousis, A. Statistical framework for the detection of pressure regulation malfunctions and issuance of alerts in water distribution networks. Stoch. Environ. Res. Risk Assess. 2022, 36, 4223–4233. [Google Scholar] [CrossRef]
- Langousis, A.S.; Fourniotis, N.T. Elements of Design of Water Supply and Sewerage Works; GOTSIS Publications: Patras, Greece, 2020; p. 722. ISBN 978-960-9427-89-0. (In Greek) [Google Scholar]
- Serafeim, A.V.; Kokosalakis, G.; Deidda, R.; Karathanasi, I.; Langousis, A. Probabilistic Minimum Night Flow Estimation in Water Distribution Networks and Comparison with the Water Balance Approach: Large-Scale Application to the City Center of Patras in Western Greece. Water 2022, 14, 98. [Google Scholar] [CrossRef]
- Serafeim, A.V.; Kokosalakis, G.; Deidda, R.; Karathanasi, I.; Langousis, A. Probabilistic framework for the parametric modeling of leakages in water distribution networks: Large scale application to the City of Patras in Western Greece. Stoch. Environ. Res. Risk Assess. 2022, 36, 3617–3637. [Google Scholar] [CrossRef]
- Serafeim, A.V.; Kokosalakis, G.; Deidda, R.; Fourniotis, N.T.; Langousis, A. Combining Statistical Clustering with Hydraulic Modeling for Resilient Reduction of Water Losses in Water Distribution Networks: Large Scale Application Study in the City of Patras in Western Greece. Water 2022, 14, 3493. [Google Scholar] [CrossRef]
- Serafeim, A.V.; Kokosalakis, G.; Deidda, R.; Karathanasi, I.; Langousis, A. Water Loss Estimation and Associated Financial Cost in Water Distribution Networks: Large Scale Application to the City of Patras in Western Greece. In Proceedings of the IWA World Water Congress & Exhibition 2022, Copenhagen, Denmark, 11–15 September 2022. [Google Scholar]
| Disclaimer/Publisher’s Note: The statements, opinions and data contained in all publications are solely those of the individual author(s) and contributor(s) and not of MDPI and/or the editor(s). MDPI and/or the editor(s) disclaim responsibility for any injury to people or property resulting from any ideas, methods, instructions or products referred to in the content. |
© 2023 by the authors. Licensee MDPI, Basel, Switzerland. This article is an open access article distributed under the terms and conditions of the Creative Commons Attribution (CC BY) license (https://creativecommons.org/licenses/by/4.0/).


 ,
, 

