Next Article in Journal
A Comparative Analysis of SMAP-Derived Soil Moisture Modeling by Optimized Machine Learning Methods: A Case Study of the Quebec Province
Previous Article in Journal
Sustainable Water Management in Indus Basin and Vulnerability Due to Climate Change
 
 
Please note that, as of 4 December 2024, Environmental Sciences Proceedings has been renamed to Environmental and Earth Sciences Proceedings and is now published here.
Proceeding Paper

A Monthly Water Balance Model for Assessing Streamflow Uncertainty in Hydrologic Studies †

by
Lampros Vasiliades
* and
Ioannis Mastraftsis
Department of Civil Engineering, School of Engineering, University of Thessaly, Pedion Areos, 38334 Volos, Greece
*
Author to whom correspondence should be addressed.
Presented at the 7th International Electronic Conference on Water Sciences, 15–30 March 2023. Available online: https://ecws-7.sciforum.net.
Environ. Sci. Proc. 2023, 25(1), 39; https://doi.org/10.3390/ECWS-7-14192
Published: 14 March 2023
(This article belongs to the Proceedings of The 7th International Electronic Conference on Water Sciences)

Abstract

:
The accurate assessment of streamflow is crucial for operational water resource management projects. The aim of this study was to estimate the uncertainties in the surface runoff simulated by a monthly water balance model in a mountainous watershed of the Portaikos river, a tributary of the Pinios river, Thessaly, Greece. The University of Thessaly (UTHBAL) monthly water balance model was developed in the R statistical computing environment language, named ‘R-UTHBAL’, to estimate surface water balance in data-scarce watersheds. Two sources of uncertainties in hydrological modelling were considered: the uncertainties in input data estimation and in model parameters. The uncertainties were estimated with the use of the R-package ‘hydroPSO’, a global Particle Swarm Optimisation (PSO) algorithm for the calibration of environmental models. The R-UTHBAL was integrated with the hydroPSO algorithm and advanced sensitivity analyses, and user-friendly evaluation plots were estimated to facilitate the interpretation and assessment of the calibration results. Application of R-UTHBAL with the hydroPSO showed that the uncertainty in streamflow estimation should always be accounted for and evaluated in operational water resources management projects.

1. Introduction

Conceptual rainfall–runoff models are frequently used to estimate the runoff generation mechanisms and the water balance components at various temporal and spatial scales. A satisfactory match between the observed and simulated outputs is often achieved by calibrating the model parameters. However, the results are quite uncertain due to aleatory and epistemic uncertainty. Inaccuracies in the input data (such as precipitation and temperature), the calibration data (such as streamflow), the model parameters, and the mathematical model structure are the four main causes of epistemic uncertainty in hydrological modelling [1]. While the latter two are more model-specific, the first two error sources are influenced by the quality of the data. Hence, assessment of the uncertainties is crucial in hydrological studies, water resource management, climate change assessment, and estimations of water balance in ungauged watersheds [2].
The aim of this study is to estimate the uncertainties in the surface runoff simulated by a monthly water balance model in a mountainous watershed of the Portaikos river, a tributary of the Pinios river, Thessaly, Greece. The University of Thessaly (UTHBAL) monthly water balance model [3,4] is developed in the R statistical computing environment language, named ‘R-UTHBAL’, to estimate surface water balance in data-scarce watersheds. Two sources of uncertainties in hydrological modelling are considered: the uncertainties in input data estimation and in model parameters. The uncertainties are estimated with the use of the R-package ‘hydroPSO’, a global Particle Swarm Optimisation (PSO) algorithm [5] for the calibration of environmental models. The R-UTHBAL is integrated with the hydroPSO algorithm and advanced sensitivity analyses, and user-friendly evaluation plots are estimated to facilitate the interpretation and assessment of the calibration results.

2. Materials and Methods

2.1. The R-UTHBAL Model

The monthly water balance model UTHBAL [3] was selected to be redesigned in the R-Environment because it has been applied successfully to simulate surface runoff and groundwater recharge in many studies [6,7]. Monthly time series of precipitation, mean temperature, and potential evapotranspiration are used as inputs by UTHBAL. The snowpack and snowmelt are calculated from total precipitation which is divided into rainfall and snowfall. Using a soil moisture mechanism, the model splits the entire watershed runoff into three components: the surface runoff, the interflow, and the baseflow. The model’s first objective is to accurately fulfil actual evapotranspiration. Watershed runoff, actual evapotranspiration, groundwater recharge, and soil moisture are the model’s outputs. Mathematical details can be found in a recent study [3].
Figure 1 presents the R-UTHBAL model with the flow diagram and the R-Environment framework using the hydroPSO algorithm. Six model parameters should be estimated and are usually determined during calibration based on monthly streamflow data. The model parameters are: the CN (Curve Number) of the US Soil Conservation Service, the Cm parameter of monthly melt rate factor, the coefficient α of actual evapotranspiration (aAET), the coefficient Κ of groundwater recharge, the coefficients β and γ of interflow (CONMR) and baseflow (CONGROUND), respectively (Figure 1a). Previous applications of the UTHBAL model showed that the model parameters are independent, well-defined and simulation streamflow errors are normally distributed [4]. Several command functions were carried out in the R environment for the operation of the models, input and data preparation and transformation, selection of parameter space, calibration method, optimisation function, and statistical analyses (Figure 1b).

2.2. Water Balance Modelling Procedure

The study area is the Portaikos River watershed in the outlet at Pyli hydrometric station. It is a forested mountainous watershed and has an area of about 133 km2. The mountainous watershed is located in Thessaly Region and Portaikos river is one of the main tributaries of Pinios River. Monthly streamflow data were available for the period October 1990–September 1993. Areal input datasets were estimated for the above period using typical engineering methods (i.e., precipitation/temperature gradients, Thiessen polygons) from the available meteorological stations. Potential evapotranspiration was calculated with the Thorthwaite method based on the estimated mean monthly temperature values.
The Latin-Hypercube One-factor-At-a-Time procedure developed by van Griensven et al. [8] for sensitivity analysis of model parameters was firstly applied to identify significant model parameters and the required mathematical model structure. Then, several objective functions, (i.e., Nash–Sutcliffe Efficiency and variations or adaptations, such as Kling–Gupta efficiency (KGE) formulations [9,10] and Root Mean Square Error (RMSE)), addressing different parts of the hydrograph, were used to assess both the skill and the robustness of the R-UTHBAL model to perform consistent streamflow predictions using the temporal split-sample test. Confidence intervals in the simulated runoff due to input data uncertainty, parameter uncertainty, and total uncertainty were calculated using the hydroPSO algorithm. hydroPSO implements several state-of-the-art enhancements and fine-tuning options to the Particle Swarm Optimisation (PSO) algorithm to meet specific user needs. hydroPSO easily interfaces the calibration engine to different model codes through simple ASCII files and/or R wrapper functions for exchanging information on the calibration parameters. Then, it optimises a user-defined goodness-of-fit measure until a maximum number of iterations or a convergence criterion is met. Finally, advanced plotting functionalities facilitate the interpretation and assessment of the calibration results.

3. Results and Discussion

Table 1 presents the sensitivity analysis results for the six (6) model parameters using the modified KGE [10] as the objective function, and 5000 strata for LH sampling with variance fraction 10%. In this table, the parameter ranges are also depicted. Based on Table 1, all model parameters should be included in the mathematical model structure. Using the temporal split-sample test between the first (October 1960–September 1977) and second period (October 1977–September 1993), the models were calibrated for half of the years during both the first and second periods, leaving the remaining half of the years for validation. The KGE2 values of the optimisation process were 0.79 and 0.87 for the first and second period, respectively, for 2000 model realisations. Figure 2 presents the results for the first period and parameter values versus the corresponding goodness-of-fit values (KGE2) obtained during the optimisation procedure.
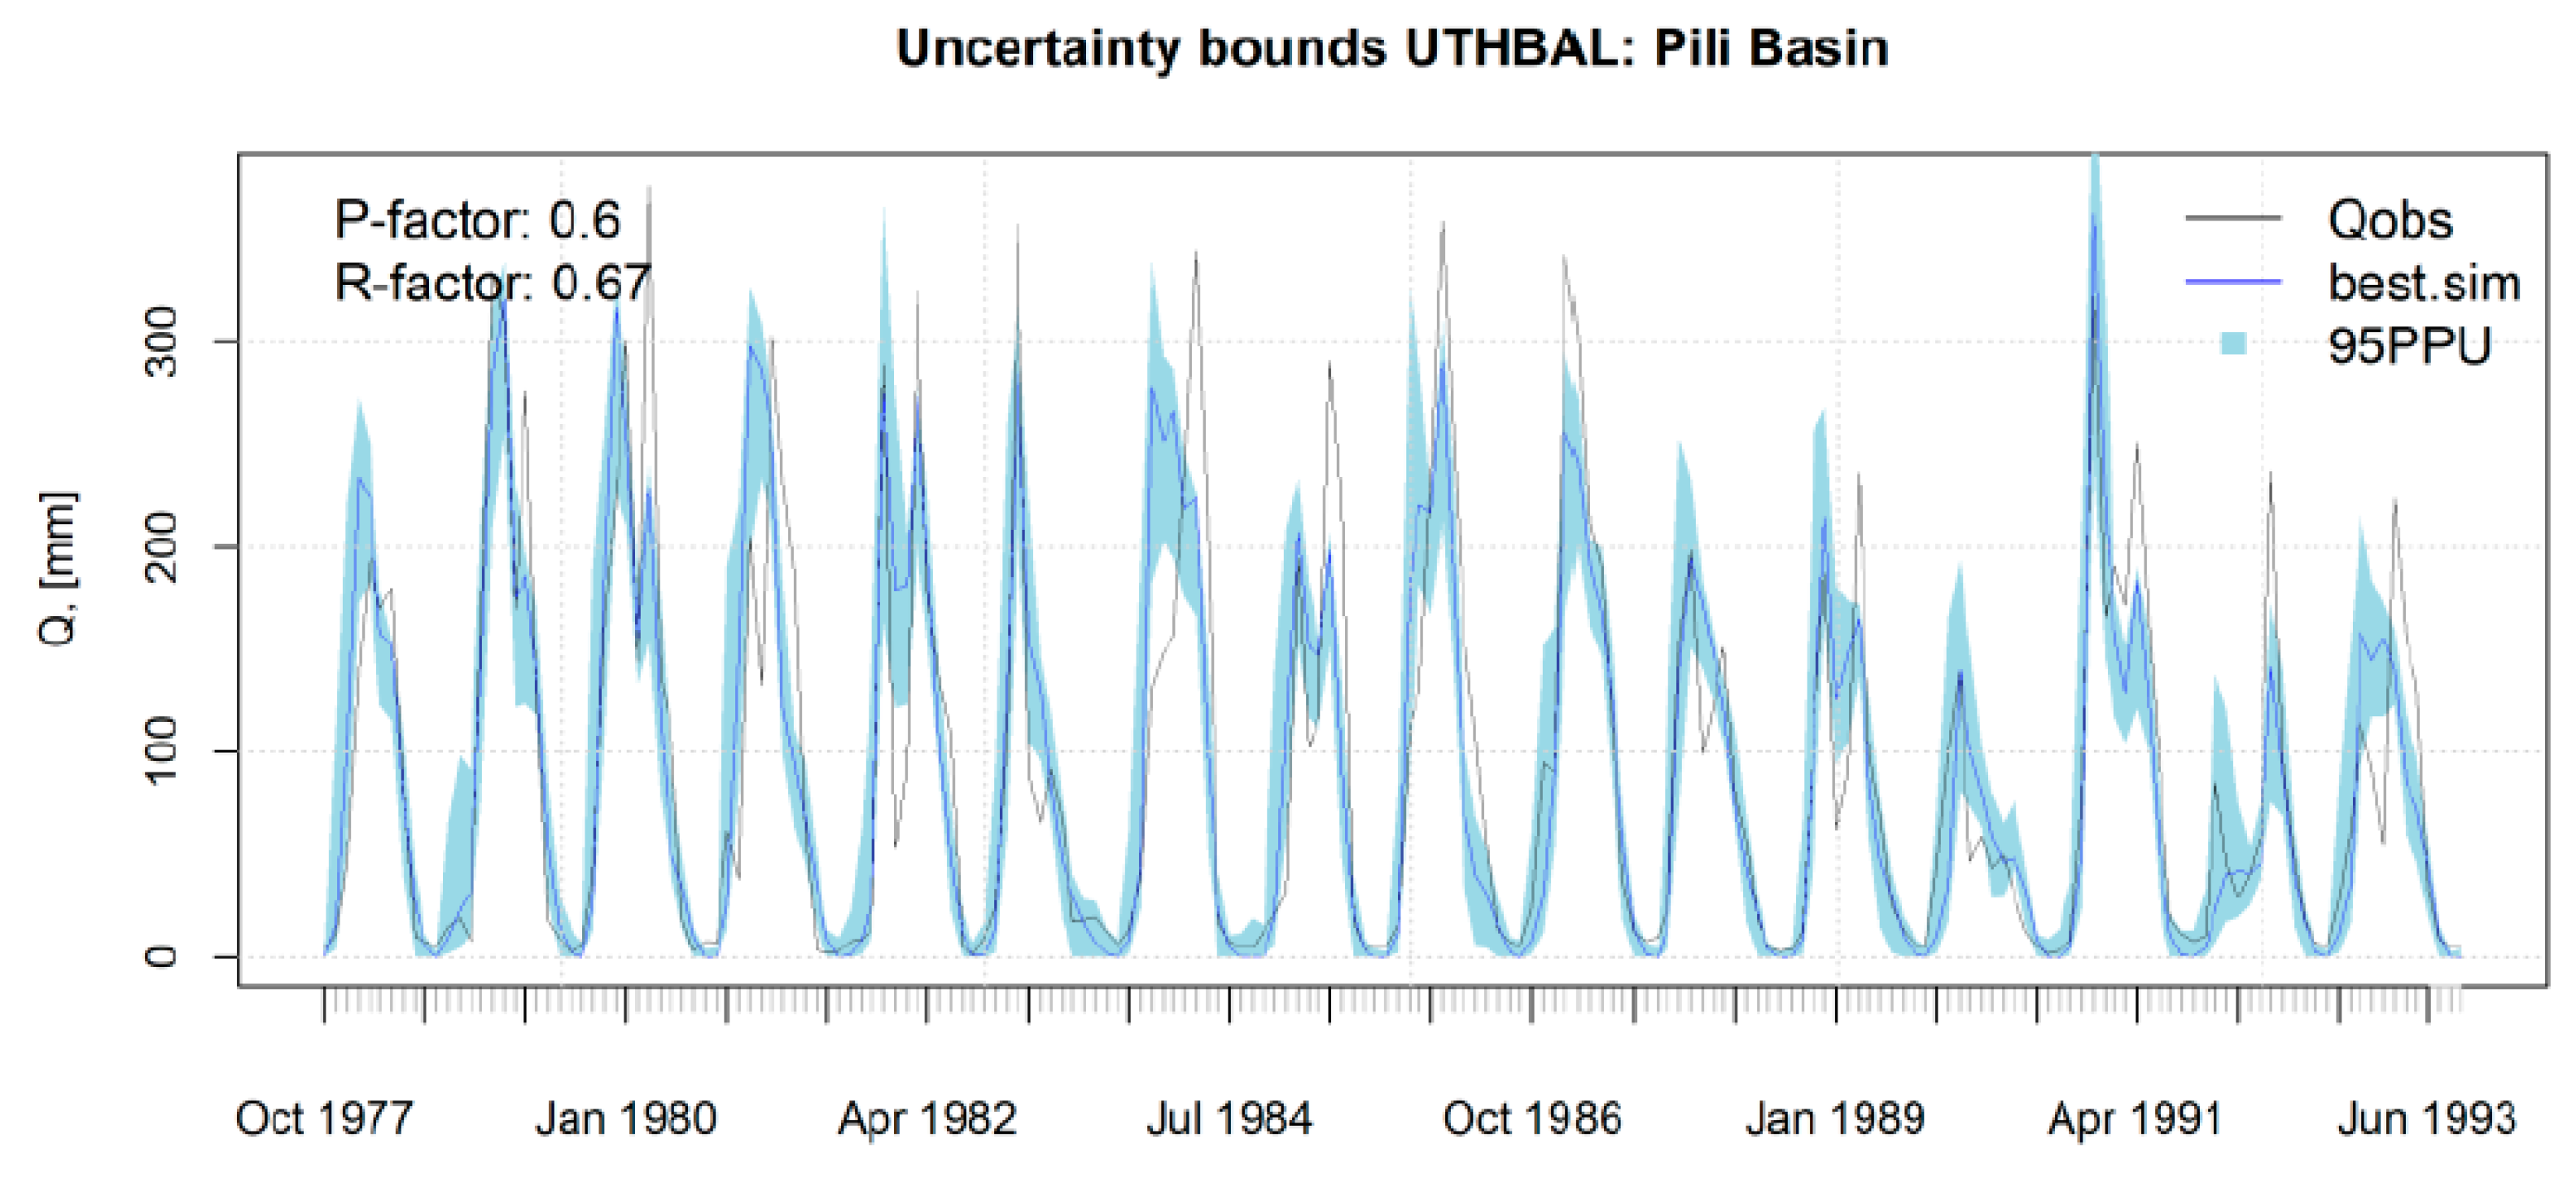
Based on a selected threshold of KGE2 > 0.3 as the behavioural threshold, all parameter values above the threshold were selected and weighted quantiles of model parameters were calculated to provide an estimate of the uncertainty in each model parameter. Using the P-factor, which represents the percent of observations that are within the user-defined uncertainty bounds and the R-factor that represents the average width of the user-defined uncertainty bounds divided by the standard deviation of the observations, a quantification of the uncertainty was estimated [5]. Figure 3 presents the results of the uncertainty analysis for the verification period and shows the best simulated streamflows along with the 95 Percent Prediction Uncertainty (95 PPU), and Figure 4 presents the uncertainty in flow duration curve using the one of the best simulated streamflows and the flow duration curves for the 2.5 and 97.5 weighted quantiles of model simulations obtained during the verification period.

4. Concluding Remarks

Accurate assessment of streamflow is crucial for operational water resources management projects. This study estimated the uncertainties in the surface runoff simulated by a monthly water balance model in a mountainous watershed of the Portaikos river, a tributary of the Pinios river, Thessaly, Greece. The R-UTHBAL water balance model was integrated with the hydroPSO algorithm and advanced sensitivity analyses, and user-friendly evaluation plots were estimated to facilitate the interpretation and assessment of the optimisation process. Application of R-UTHBAL with the hydroPSO in Portaikos river basin in Thessaly, Greece, showed that the uncertainty in streamflow estimation should always be accounted for and evaluated in operational water resource management projects.

Author Contributions

Conceptualization, methodology, software, writing—review and editing: L.V.; methodology, software: I.M. All authors have read and agreed to the published version of the manuscript.

Funding

This research received no external funding.

Institutional Review Board Statement

Not applicable.

Informed Consent Statement

Not applicable.

Data Availability Statement

Not applicable.

Conflicts of Interest

The authors declare no conflict of interest.

References

  1. Engeland, K.; Xu, C.-Y.; Gottschalk, L. Assessing Uncertainties in a Conceptual Water Balance Model Using Bayesian Methodology/Estimation Bayésienne Des Incertitudes Au Sein d’une Modélisation Conceptuelle de Bilan Hydrologique. Hydrol. Sci. J. 2005, 50, 9. [Google Scholar] [CrossRef]
  2. Refsgaard, J.C.; van der Sluijs, J.P.; Højberg, A.L.; Vanrolleghem, P.A. Uncertainty in the Environmental Modelling Process—A Framework and Guidance. Environ. Model. Softw. 2007, 22, 1543–1556. [Google Scholar] [CrossRef]
  3. Loukas, A.; Mylopoulos, N.; Vasiliades, L. A Modeling System for the Evaluation of Water Resources Management Strategies in Thessaly, Greece. Water Resour. Manag. 2007, 21, 1673–1702. [Google Scholar] [CrossRef]
  4. Vasiliades, L.; Loukas, A. Hydrological Response to Meteorological Drought Using the Palmer Drought Indices in Thessaly, Greece. Desalination 2009, 237, 3–21. [Google Scholar] [CrossRef]
  5. Zambrano-Bigiarini, M.; Rojas, R. A Model-Independent Particle Swarm Optimisation Software for Model Calibration. Environ. Model. Softw. 2013, 43, 5–25. [Google Scholar] [CrossRef]
  6. Malamataris, D.; Kolokytha, E.; Loukas, A. Integrated Hydrological Modelling of Surface Water and Groundwater under Climate Change: The Case of the Mygdonia Basin in Greece. J. Water Clim. Change 2020, 11, 1429–1454. [Google Scholar] [CrossRef]
  7. Lyra, A.; Loukas, A.; Sidiropoulos, P.; Tziatzios, G.; Mylopoulos, N. An Integrated Modeling System for the Evaluation of Water Resources in Coastal Agricultural Watersheds: Application in Almyros Basin, Thessaly, Greece. Water 2021, 13, 268. [Google Scholar] [CrossRef]
  8. van Griensven, A.; Meixner, T.; Grunwald, S.; Bishop, T.; Diluzio, M.; Srinivasan, R. A Global Sensitivity Analysis Tool for the Parameters of Multi-Variable Catchment Models. J. Hydrol. 2006, 324, 10–23. [Google Scholar] [CrossRef]
  9. Gupta, H.V.; Kling, H.; Yilmaz, K.K.; Martinez, G.F. Decomposition of the Mean Squared Error and NSE Performance Criteria: Implications for Improving Hydrological Modelling. J. Hydrol. 2009, 377, 80–91. [Google Scholar] [CrossRef]
  10. Kling, H.; Fuchs, M.; Paulin, M. Runoff Conditions in the Upper Danube Basin under an Ensemble of Climate Change Scenarios. J. Hydrol. 2012, 424–425, 264–277. [Google Scholar] [CrossRef]
Figure 1. The R-UTHBAL model: (a) Flow diagram and (b) the R workflow environment with hydroPSO algorithm.
Environsciproc 25 00039 g001
Figure 2. Validation results (monthly and annual graphs using several performance indices) for the first period, October 1960 to September 1993, and parameter values versus the corresponding goodness-of-fit values (KGE2) obtained during optimisation.
Environsciproc 25 00039 g002
Figure 3. The 95 Percent Prediction Uncertainty (95 PPU) for model simulations during the verification period.
Environsciproc 25 00039 g003
Figure 4. Flow duration curve of the observed (black line) and best simulated (blue line) streamflows. In addition, flow duration curves for the 2.5 and 97.5 weighted quantiles of model simulations obtained during the verification period. The upper panel is the normal flow duration curve, the middle panel focuses on low flows (log = ‘y’), and the lower panel focuses on high flows (log = ‘x’).
Environsciproc 25 00039 g004
Table 1. Model parameter range values, sensitivity analysis results, and optimised model parameters using the R-UTHBAL model and hydroPSO algorithm.
ParameterMin ValueMax ValueRanking NumberNormalised Relative Importance (%)Optimised Value 1960–1977Optimised Value 1977–1993
Cm012609.966.6602.149
CN30100514.4745.43546.546
K01417.160.0050.299
α = aAET01318.700.0020.261
β = CONMR01219.660.1200.091
γ = CONGROUND01120.020.9430.988
Disclaimer/Publisher’s Note: The statements, opinions and data contained in all publications are solely those of the individual author(s) and contributor(s) and not of MDPI and/or the editor(s). MDPI and/or the editor(s) disclaim responsibility for any injury to people or property resulting from any ideas, methods, instructions or products referred to in the content.