Proceeding Paper

A Systems Approach to Identifying Hazards in the Management of Vegetative Buffers for the Protection of Drinking Water Quality †

Centre for Emergency Response Information, National Yunlin University of Science and Technology, Douliu 640, Taiwan
*
Author to whom correspondence should be addressed.
Presented at the 7th International Electronic Conference on Water Sciences, 15–30 March 2023; Available online: https://ecws-7.sciforum.net/.
Environ. Sci. Proc. 2023, 25(1), 33; https://doi.org/10.3390/ECWS-7-14173
Published: 14 March 2023
(This article belongs to the Proceedings of The 7th International Electronic Conference on Water Sciences)

Abstract

:
Using ecosystem services provided by stream buffers has the potential to complement conventional engineering solutions, such as water treatment, and reduce public health risks to consumers. These buffers interrupt the movement of contaminants and sediments from non-point sources such as agricultural land to surface waters. This study uses System Theoretic Process Analysis (STPA) and Early Warning Signal Analysis based on STPA (EWaSAP) methodologies to systematically examine the sociotechnical structures involved in managing vegetated buffers in surface water catchments using a theoretical scenario representative of typical surface water supplies.

1. Introduction

For Water Service Providers (WSPs), the safety and quality of drinking water is paramount to protecting public health and providing a valued product. To ensure safety, a WSP must have a good understanding of the potential hazards of the supply system all the way from catchment to tap [1]. In drinking water source protection, ecosystem services in the catchment area play a vital role in the cost-effective delivery of water quality outcomes through controlling the movement of sediment, nutrients, and contaminants as well as stabilizing banks and slopes. Leveraging these services and viewing catchment areas as water treatment assets has the potential to complement conventional engineering solutions, such as water treatment, and reduce public health risks to consumers [2]. Riparian buffers in catchments are often critical zones for targeted mitigation measures for interrupting the movement of contaminants and sediments from non-point sources such as agricultural land to surface waters [3].
This study uses a comprehensive hazard analysis to identify requirements for the good management of stream buffers for drinking water outcomes. Riparian buffers supply many services as natural water treatment infrastructure by protecting and enhancing natural ecosystem services. Thus, as a drinking water source protection strategy, vegetative buffers can be a practical risk management approach [4]. The services provided by vegetation buffers include soil erosion control through slope stability and water purification by reducing sediments, nutrients, pollutants, and pathogens entering waterways [5]. Replacing such services with constructed assets entails complex water treatment, dam construction, and slope engineering. Furthermore, through the natural purification processes, buffers can reduce operational costs for existing water treatment infrastructure and processes. A review of catchment land cover and chemical costs for water treatment by [6] showed that vegetation buffers between diffuse pollution sources and streams has a negative correlation between stream buffers area and treatment costs. The resultant reduction in treatment costs provides a compelling case for using vegetation buffers as a public health risk management strategy and reducing operational costs associated with water treatment.
The water quality benefits of stream buffers appear to be well understood in the water industry. Many examples exist where stream buffers have been used to improve water quality outcomes [7,8]. In addition, studies have shown that the public is willing to support catchment interventions to provide water quality improvement outcomes. For example, in the water industry in England and Wales, customers have shown an acceptance of beneficiary pays solutions in catchment management for drinking water source protection [9]. However, a review of the Capital Expenditure (CAPEX) bias in the water and sewerage sectors in England and Wales found that for many water service providers, there is a belief that CAPEX solutions are favored over solutions that rely on operational expenditure (OPEX) [10]. Much of this bias arises from a perceived lower certainty of outcomes of operational interventions on natural assets.
Typical hazard analysis methods for drinking water assets include FMEA, HAZOP, Fault Trees amongst many others [11]. This study uses System Theoretic Process Analysis (STPA) to systematically examine the hazards inherent to sociotechnical structures involved in using vegetated buffers for drinking water quality management in surface water catchments. STPA is a hazard analysis methodology based on System Theoretic Accident Modelling Processes (STAMPs), which, being founded on systems theory, views safety as the emergent property of the system [12]. This method has been used in a wide range of applications from aerospace design through to regulation and legal systems. In the study of drinking water source protection programs by Ref. [13], STPA was used to analyze the hazards associated with catchment-level ecosystem services provided by stream buffers. However, the study only considered ecosystem services in general without inspecting the different processes individually. In this study, the sociotechnical system of interest includes technical, social, economic and agency interaction factors which control the water quality outcomes from vegetative buffers. The use of conventional hazard analysis techniques in this type of system or process is limited as they focus on the reliability of individual components and miss the interaction of the various components in the plans. Furthermore, such approaches have limited ability to identify leading indicators of safety or early warning signs.
Building on the hazard analysis using STPA, this study investigates the leading indicators of safety throughout the system based on the Early Warning Signal Analysis based on STPA (EWaSAP) methodology proposed by Ref. [14]. The EWaSAP methodology presented in Ref. [14] builds on the STPA methodology for hazard analysis to identify possible early warning signals that control actions may be failing to enforce the safety objectives of the system.

2. Methods

To test the applicability of STPA and EWaSAP for the assessment of process risks in managing vegetation buffers, a theoretical example was created based on typical real-world conditions. The hypothetical scenario constructed is a surface water catchment used for the public supply of drinking water with a broad mix of land uses controlled by different private and public entities.

2.1. STPA Method

The STPA methodology consists of four key steps: define the purpose of analysis, model of control structure, identify unsafe control actions, and identify loss scenarios. In this study, the four steps of STPA are adapted from Ref. [15] with the parallel EWaSAP steps [13] which are described in the following sections.

2.1.1. Step 1—Define the Purpose of the Analysis

In the definition of the purpose of the analysis, the unacceptable losses are identified, as well as the associated system-level hazards and the corresponding safety constraints. In this STPA step, the EWaSAP tasks include:
  • Identify the agents outside of the system scope that need to be informed about the potential realization of a system-level hazard.
  • Establish a synergy with sensory services within and outside the system scope and identify the system-level safety constraints that have been violated.

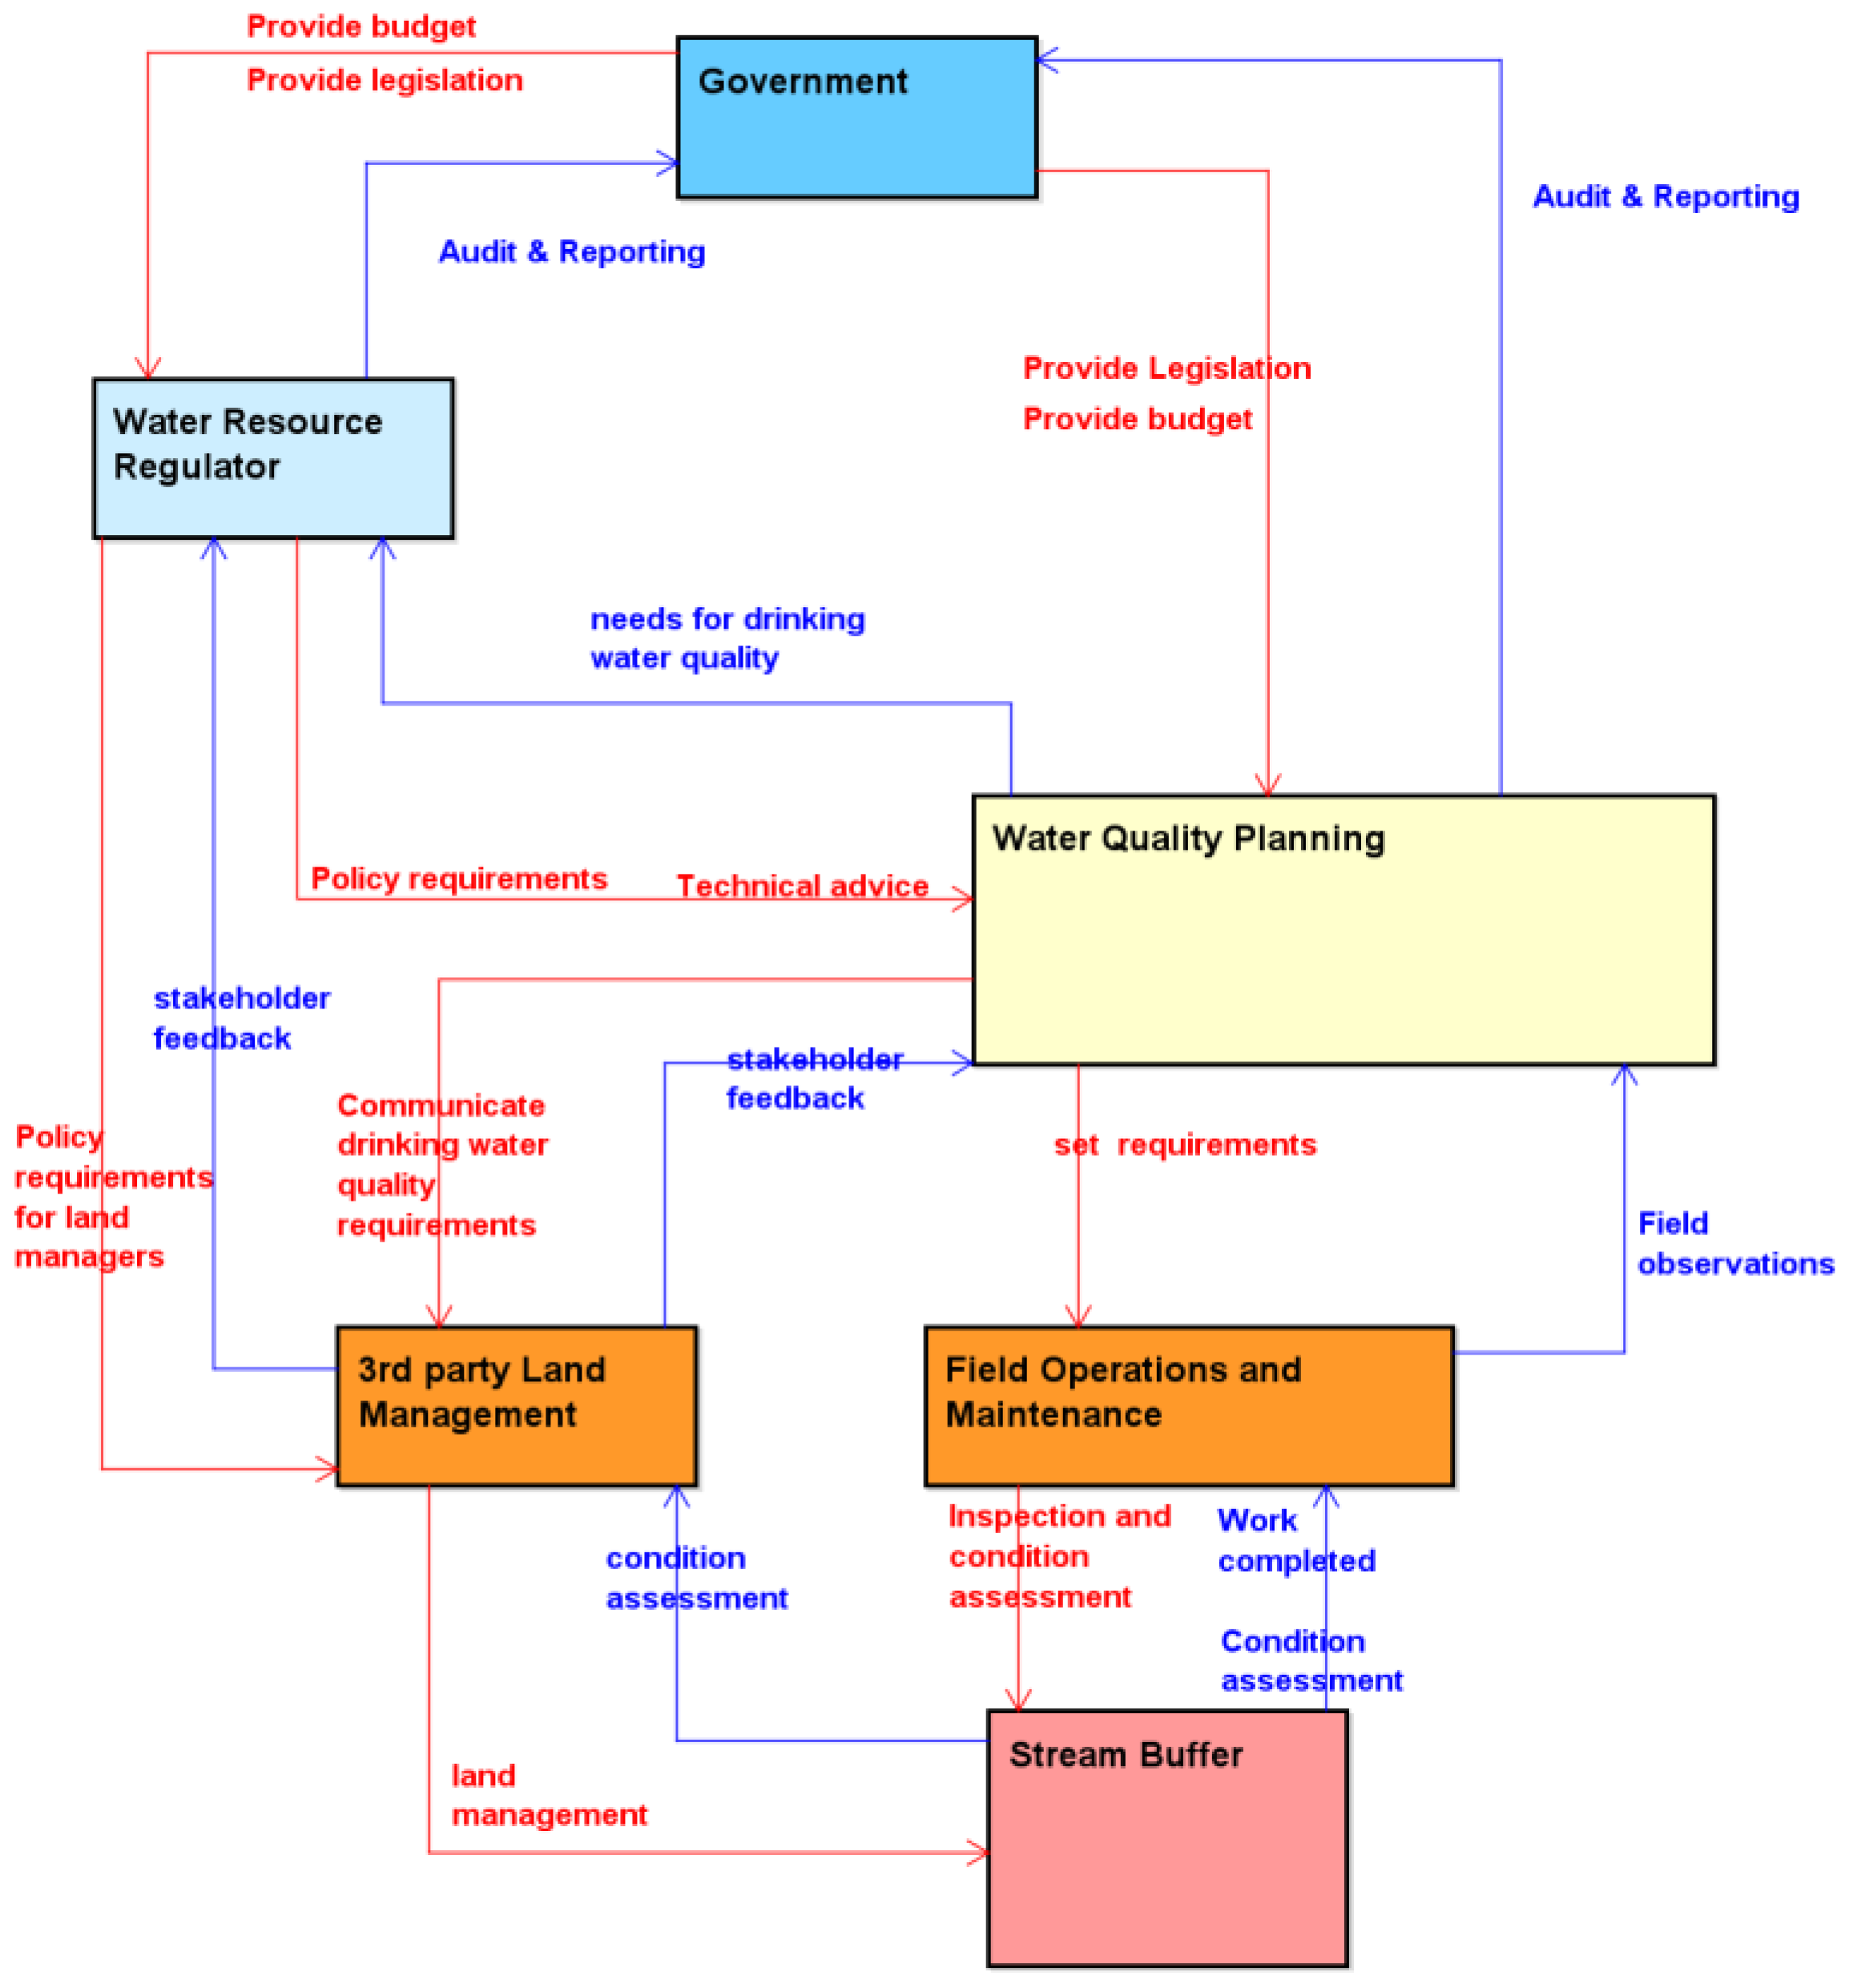
2.1.2. Step 2—Model of the Control Structure

The model is not a physical model of the system, rather a model of the hierarchal control of the system components included in the scope of the analysis. The control model is created using a series of feedback and control loops [15].

2.1.3. Step 3—Identify Unsafe Control Actions

The next step of the analysis is to identify the ways the control actions can be unsafe. Ref. [14] provides four prompts for identifying potential unsafe control actions (UCAs): not providing the control action when required; providing the control action that causes a hazard; providing the control action too soon or too late; or is stopped too soon or is applied too long. The concurrent EWaSAP tasks relate to the enforcement of internal awareness actions.

2.1.4. Step 4—Identify Loss Scenarios

The loss scenarios combine causal factors that can lead to the identified UCAs being realized. The EWaSAP methodology focuses on using the available pool of data to indicate the existence of factors that could result in the UCA and, ultimately, the violation of the high-level safety constraints.

3. Results

3.1. Definition of Purpose

In the scenario presented, the key stakeholders are the consumers of the water produced by the drinking water catchment. Therefore, the key losses or accidents considered are the illness or death resulting from pathogens or contaminants introduced from the catchment area. The causes that could lead to such losses are contaminants or pathogens in concentrations too great to be removed effectively through downstream water quality control barriers or water quality that reduces the effectiveness of downstream water quality control processes. For drinking water supplies, these downstream barriers typically include water treatment and disinfection processes.
For step one of ESWaP, the focus is on identifying the agents outside of the system which must be informed of a system-level hazard. In this case, the main agent would be the position in direct control of the drinking water system, which for a typical WSP may be a position such as a Water Quality Operations Manager. In this situation, the indication of degraded water quality would come from a violation of the water quality limits that reflect the verified capability of downstream water treatment and disinfection processes. The high-level hazards, corresponding safety constraints identified, and the associated warning signals are provided in Table 1.

3.2. Safety Control Structure

In a drinking water supply system like the scenario created for this study, the quality of the water supplied is under the control of the WSP who are accountable for the final supply to the customer. When it comes to catchment management, the management structures and accountabilities for actions to protect water quality outcomes involves multiple landholders and government agencies. The WSP often has limited direct influence over the landholders and government agencies responsible for natural resource management and pollution regulation. As such, included in the safety structure is a role for the government agencies accountable for the management of water resources. Additionally, considered in the safety structure is the role of the public health authority with statutory responsibility for regulating drinking water supplies. While there is no direct responsibility for managing stream buffers as a regulator, there is indirect influence through regulatory actions. Including enabling actors in the safety control structure provides a detailed view of the broader sociotechnical structure which influences the successful management of ecosystem services in drinking water catchments.
For the WSP, several key internal functions are included in the safety control structure as the control of these functions has considerable influence on drinking water quality outcomes. The WSP functions relate to the maintenance, operations, and planning actions related to water quality control processes. For the study scenario, the description of all the key actors involved in managing vegetative buffers in drinking water catchments, and the associated control actions and information are listed in Figure 1.

3.3. Identification of Unsafe Control Actions

In this step of the analysis, each of the 18 control actions included in the high-level control structure was reviewed to establish the scenarios in which the control actions can be unsafe and potentially violate the system safety constraints. As a theoretical example, the identification of UCAs was based on the authors’ knowledge in conjunction with industry guidance and the WHO guidance document on protecting surface water for public health [4]. The actions considered multiple aspects, from typical planning and operations to strategic management and policy. At this stage of the study, a total of 46 UCAs were identified for the high-level control actions related to the management of stream buffers. A sample of the UCAs for operational and strategic control action is provided in Table 2.

3.4. Causal Factors, Countermeasures, and Early Warning Signs

The causal factors are the scenarios that result in potentially unsafe control actions and the eventual potential resulting in the violation of the high-level safety constraints previously identified in Table 1. The STPA Handbook [15] includes guidance for the identification of loss scenarios as the fourth step in the STPA method. For EWaSAP, the third step is to enforce internal awareness actions to indicate the occurrence of a flaw and the violation of assumptions made in the design of the system. This step is a proposed add-on to step 3 in the STPA method. For this study, when completing step 3 of EWaSAP in conjunction with the STPA method consideration was given to the potential causal factors when identifying the signs of the flaws occurring. The next step was to consider what countermeasures could be put in place to prevent the identified scenarios leading to unsafe control actions. A total of 73 causal factors were identified from the UCAs, and each causal factor then had a corresponding countermeasure assigned. As some of the causal factors had similar failure mechanisms and therefore had a similar countermeasure assigned, resulting in a total of 61 countermeasures. A sample of the countermeasures and early warning signs is provided in Table 3.
The sensor element is derived from the control feedback in the safety control structure and supplies the controller with information to control the actions of the actuator. The actual sensor will depend on the specifics of a given situation and may include visual observations, water quality data, etc. The timing of information from the sensor will depend on the rate at which conditions can change. The timing of sensor reading is essential for informing the early warning signs which confirm if the countermeasure is effective and enforcing the required safety constraints in the management structure. This process was completed for all 61 countermeasures identified.
Of all the early warning signs identified, the majority were related to the risk assessment and planning process accounting for 39% of all indicators. The risk assessment and planning processes set the foundations for the overall system, where issues are identified and rectified, and this stage can prevent possible degradation due to management actions. The next highest number of early warning signs can be found with maintenance and operation functions (13%) and government policy and regulation (12%). Like any other asset in the water supply system, stream buffers require ongoing maintenance and operations to ensure the expected level of performance is maintained. In this instance, monitoring the early warning signals related to operations and maintenance functions provides greater certainty in meeting the water quality objectives. As for government policy and regulation, while not directly influenced by a WSP, there is importance in being able to navigate the aspects of policy and regulations which influence stream buffer management. The smallest group of early signs related to water quality sampling accounted for only 3% of all indicators identified. Water quality sampling is often used as the principal indicator for the effectiveness of water quality interventions. While effective for characterizing water quality, monitoring is a lag indicator in this instance as stream buffers may become seriously degraded before any change in water quality results is observed.

4. Conclusions

While the value of ecosystem services has been widely recognized in the water industry, there has been limited investigation into the warning signals in the management systems of such assets. Using a structured hazard analysis provides insight into the management needs to ensure that stream buffers continue to perform as expected in the supply of safe drinking water.
This example provides a valuable test of how taking a highly systematic approach to identifying hazards using STPA can help to better understand management requirements. Furthermore, developing a set of early warning signals and sensors using EWASP can help us to understand the warning signals and sensors for the effective management of natural assets. The uncertainty of outcomes can be a limiting factor when deciding between investing in catchment interventions and conventional water treatment infrastructure. However, the approach of using STPA and EWASP in combination provides a basis for being able to systematically design management regimes for greater assurance of meeting the requirements for the safe and reliable supply of drinking water. Due to the systematic approach, this approach can be expanded as needed to encompass a range of different operational risks, such as the interlinkages with technical aspects (e.g., water treatment processes), and sociotechnical aspects, such as policy development.
The substantial number of early warning signs identified in this case would require significant resources to implement and measure. The methods used, are very helpful in identifying the hazards involved; however, they do not provide a means to assess the relative importance of the warning signs in the overall system. The validation, ranking, and selection of the final early warning signs warrant further research and investigation to assist WSPs in safely managing ecosystem services to protect drinking water quality.

Author Contributions

Conceptualization, H.C.M. and J.J.H.; methodology, H.C.M. and J.J.H.; formal analysis, H.C.M.; investigation, H.C.M.; resources, J.J.H.; data curation, H.C.M.; writing—original draft preparation, H.C.M. and J.J.H.; writing—review and editing, H.C.M. All authors have read and agreed to the published version of the manuscript.

Funding

This research received no external funding.

Institutional Review Board Statement

Not applicable.

Informed Consent Statement

Not applicable.

Data Availability Statement

Data can be provided upon request.

Conflicts of Interest

The authors declare no conflict of interest.

References

  1. World Health Organisation. Guidelines for Drinking-Water Quality: Fourth Edition Incorporating the First Addendum; WHO: Geneva, Switzerland, 2017. [Google Scholar]
  2. Vincent, J.R.; Ahmand, I.; Adnan, N.; Burwell IIIW, B.; Pattanayak, S.K.; Tan-Soo, J.-S.; Thomas, K. Valuing Water Purification by Forests: An Analysis of Malaysian Panel Data. Environ. Resour. Econ. 2016, 64, 59–80. [Google Scholar] [CrossRef]
  3. Stutter, M.L.; Chardon, W.J.; Kronvang, B. Riparian buffer strips as a multifunctional management tool in agricultural landscapes. J. Environ. Qual. 2012, 41, 297–303. [Google Scholar] [CrossRef]
  4. Rickert, B.; Chorus, I.; Schmoll, O. Protecting Surface Water for Health: Identifying, Assessing and Managing Drinking-Water Quality Risks in Surface-Water Catchments; WHO: Geneva, Switzerland, 2016. [Google Scholar]
  5. WSAA. Source Catchments as Water Quality Treatment Assets: Industry Best Practices and Triple Bottom Line Cost Evaluation of Catchment Management Practices; Water Services Association of Australia Limited: Docklands, Australia, 2016. [Google Scholar]
  6. Freeman, J.; Madsen, R.; Hart, K. Statistical Analysis of Drinking Water Treatment Plant Costs, Source Water Quality and Land Cover Characteristics; United States Trust for Public Land: San Francisco, CA, USA, 2007. [Google Scholar]
  7. Yeboah, F.K.; Lupi, F.; Kaplowitz, M.D. Agricultural landowners’ willingness to participate in a filter strip program for watershed protection. Land Use Policy 2015, 49, 75–85. [Google Scholar] [CrossRef]
  8. Buckley, C.; Hynes, S.; Mechan, S. Supply of an ecosystem service—Farmers’ willingness to adopt riparian buffer zones in agricultural catchments. Environ. Sci. Policy 2012, 24, 101–109. [Google Scholar] [CrossRef]
  9. Mathieu, L.; Tinch, R.; Provins, A. Catchment management in England and Wales: The role of arguments for ecosystems and their services. Biodivers. Conserv. 2018, 27, 1639–1658. [Google Scholar] [CrossRef]
  10. OFWAT. Capex Bias in the Water and Sewerage Sectors in England and Wales-Substance, Perception or Myth. A Discussion Paper; OFWAT: Birmingham, UK, 2012. [Google Scholar]
  11. Hokstad, P.; Røstum, J.; Sklet, S.; Rosén, L.; Pettersson, T.J.; Linde, A.; Sturm, S.; Beuken, R.; Kirchner, D.; Niewersch, C. Methods for Risk Analysis of Drinking Water Systems from Source to Tap-Guidance Report on Risk Analysis. Techneau Report. 2009. Available online: https://citeseerx.ist.psu.edu/document?repid=rep1&type=pdf&doi=c32c5de468d1a357dff807261f724749299d6b23 (accessed on 25 September 2022).
  12. Leveson, N. A new accident model for engineering safer systems. Saf. Sci. 2004, 42, 237–270. [Google Scholar] [CrossRef]
  13. Merrett, H.C.; Chen, W.T.; Horng, J.J. A Systems analysis approach to identify critical success factors in drinking water source protection programs. Sustainability 2019, 11, 2606. [Google Scholar] [CrossRef]
  14. Dokas, I.M.; Freehan, J.; Imran, S. EWaSAP: An early warning sign identification approach based on a systemic hazard analysis. Saf. Sci. 2013, 58, 11–26. [Google Scholar] [CrossRef]
  15. Leveson, N.; Thomas, J. STPA Handbook. Available online: http://psas.scripts.mit.edu/home/get_file4.php?name=CAST_handbook.pdf (accessed on 18 April 2018).
Figure 1. High-level safety control structure with control actions and feedback.
Environsciproc 25 00033 g001
Table 1. The system-level accidents, hazards safety constraints and indicators.
AccidentHazardSafety ConstraintIndicators of Safety Constraint
Violation
Supply of unsafe drinking waterH1 Stream buffer is not effective in removing pathogensBuffer must ensure the removal of pathogens to specified levelsIndicated by: levels of pathogens exceed the capability of downstream treatments
Sensors: water sampling data
Supply of unsafe drinking waterH2 Stream buffer is not correctly managed and maintainedStream buffers must be maintained to ensure they function as intendedIndicated by: condition assessment
Sensors: visual inspections/condition assessments, land manager feedback
Degradation of water qualityH3 Stream buffer is not effective in removing contaminants to specified levelsStream buffer must be able to remove contaminants as per the intended purposeIndicated by: runoff meeting set specifications
Sensors: water sampling data, in situ monitoring
Table 2. Sample of system-level unsafe control actions (UCAs).
Control
Action
FromToNot Providing Control ActionProviding Causes HazardToo Early Too Late
Land management3rd Party Land ManagementStream BufferLand manager does not manage the condition of the stream bufferLand management actions conflict with the drinking water quality objectivesThe land manager is delayed in responding to conditions that degrade the performance of buffers
Set performance requirementsWater Quality PlanningField Operations and MaintenanceThere are no performance requirements set during the planning processThe performance requirements set do not meet the needs of the applicationThe performance requirements are changed and no longer meet the buffer’s performance
Table 3. A sample of the countermeasures and early warning signs identified for stream buffers.
Causal FactorCountermeasureUnsafe Control
Action (UCA)
Early Warning SignsSensor
Requirement
Land manager operations are not compatible with buffer managementEngage and educate 3rd party landowners to ensure their management actions are compatible with drinking water quality objectivesLand management actions conflict with the drinking water quality objectivesLand management activities/actions are impacting buffer conditionShould indicate compliance with accepted land management practices
The challenge of the raw water is greater than the ability of the treatment processSet service level requirements for the performance of the bufferThe water quality supplied does not ensure public healthNoncompliance of raw water quality with service level agreementShould measure water quality against the relevant parameters
Disclaimer/Publisher’s Note: The statements, opinions and data contained in all publications are solely those of the individual author(s) and contributor(s) and not of MDPI and/or the editor(s). MDPI and/or the editor(s) disclaim responsibility for any injury to people or property resulting from any ideas, methods, instructions or products referred to in the content.

