Proceeding Paper

Water and Nitrogen Use and Agricultural Production Efficiency under Climate Change in a Mediterranean Coastal Watershed †

by
Aikaterini Lyra
1,* and
Athanasios Loukas
2
1
Laboratory of Hydrology and Aquatic Systems Analysis, Department of Civil Engineering, School of Engineering, University of Thessaly, 38334 Volos, Greece
2
Laboratory of Hydraulic Works and Environmental Management, School of Rural and Surveying Engineering, Aristotle University of Thessaloniki, 54124 Thessaloniki, Greece
*
Author to whom correspondence should be addressed.
Presented at the 7th International Electronic Conference on Water Sciences, 15–30 March 2023; Available online: https://ecws-7.sciforum.net/.
Environ. Sci. Proc. 2023, 25(1), 23; https://doi.org/10.3390/ECWS-7-14180
Published: 14 March 2023
(This article belongs to the Proceedings of The 7th International Electronic Conference on Water Sciences)

Abstract

:
This study estimates the effect of climate change on water resource efficiency and crop/agronomic productivity at the Almyros basin in Greece. Groundwater resources are intensively used for irrigation, whereas their quantity and quality are highly downgraded. Climate change impacts have been assessed using Med-CORDEX bias-corrected climatic projections for RCP4.5 and RCP8.5 scenarios. Simulation of coastal water resources was carried out with an Integrated Modelling System (IMS) consisting of the modules of surface hydrology (UTHBAL), reservoir operation (UTHRL), groundwater hydrology (MODFLOW), nitrate leaching/crop growth (REPIC), nitrate pollution (MT3DMS), and salt wedge/salinization (SEAWAT). The indices of Standardized Chloride Hazard (SCHI), Crop Water (CWP) and Economic Water Productivity (EWP), Nitrogen Use Efficiency (NUE) have been employed to analyze water resource management and agronomic scenarios. The findings indicate the water resources’ capacity for adaptability and agronomic effectiveness under the influence of salinization and climate change.

1. Introduction

Coastal aquifer systems nowadays present an ever-declining quantity and quality degradation as they are intensively used for irrigation purposes. This is especially the case for the aquifer systems located in arid and semi-areas like the Mediterranean basin, where fertile soils and favorable climatic conditions host the productivity of the agricultural and food sectors. It has been predicted that climate change will have a greater impact on the water resources of the Mediterranean areas, and it will alter the water cycle’s temporal and geographical distribution. Water scarcity will be advanced in intensity and magnitude while crop yields are expected to decline [1]. Whenever seawater intrusion is an area of concern for water resources in irrigated agriculture as well, it is quite crucial to examine the potential effects of climatic change in coastal arable watersheds [2]. In coastal watersheds where agriculture is the main economic activity, the management of water resource hazards stem from the absence of water storage works, the large amounts of groundwater abstractions that also provoke seawater intrusion, and the large amounts of fertilizers to maximize yields. Irrigation with salinized water causes physiological drought to crops, with effects similar to climatic drought events with regard to crop productivity [3,4]. In general, estimating water resource productivity at the watershed/basin scale is not an extensively studied task either under climate change and/or salinity effects on productivity. The aim of this work is to examine the climate change impacts on water resources efficiency and crop productivity under agronomic and irrigation scenarios, as well as the adaptation potential under water resource development projects at the Mediterranean Almyros basin, a coastal region in Thessaly, Greece, considering, also, the salinity effects on crop yields. The water resources have been simulated based on two climatic Representative Concentration Pathways (RCPs), namely, RCP4.5 and RCP8.5, using an Integrated Modeling System (IMS) formed by Lyra and colleagues for implementation on coastal agricultural watersheds [2,5]. The indices of Standardized Chloride Hazard (SCHI), Crop Water (CWP) and Economic Water Productivity (EWP), and Nitrogen Use Efficiency (NUE) have been employed to analyze water resource adaptation and agronomic alternatives. The findings indicate the water resources’ potential for adaptation as well as their agronomic productivity under climate change.

2. Materials and Methods

2.1. Study Area

Almyros basin is located in central Greece, and it is an agricultural coastal basin where wheat, alfalfa, cereals are the main cultivars, while cotton, olives trees, maize, vegetables, orchards, and vineyards are also cultivated. Given the absence of existing freshwater reserves, groundwater has been solely used for irrigation. The hydrology of the region is described by streams with intermittent flows and semiarid climatic conditions [2]. The groundwater in the study basin has been seriously affected and polluted by contaminants from nitrogen leachates and chloride ions from saltwater intrusion. Recently, an urban water supply reservoir, the Mavromati reservoir, has been built, and an irrigation water supply reservoir, the Xirias reservoir, is under construction (Figure 1). Furthermore, a greater irrigation water reservoir has been studied, the Klinovos reservoir (Figure 1).

2.2. Climate Change and Integrated Modelling System

The simulation is performed for climatic model ensembles based on Med–CORDEX models. Precipitation and temperature ensemble timeseries for the RCPs 4.5 and 8.5 have been bias-corrected using Quantile Mapping. Bias–correction calibration took place during the period 1971–2000, and validation during 2001–2018, counting on observed precipitation and temperature for the studied area, as in a recent earlier study [2]. The simulation of water resources of the study basin was performed using the calibrated and high efficiency Integrated Modelling System consisting of interlinked/coupled models for surface hydrology (UTHBAL), reservoir operation (UTHRL), agronomic schedules/crop growth/nitrate leaching processes (REPIC), groundwater flow (MODFLOW), nitrate transport (MT3DMS), and salt wedge/seawater intrusion (SEAWAT) composed by Lyra and associates [5]. Groundwater simulations for the water table and the nitrate and chloride concentrations started from 1991 because of the availability of historical hydrogeological data.

2.3. Water Resources and Agronomic/Crop Scenarios and Strategies

Strategy A, in which only groundwater is used for irrigation/urban water supply (baseline historical strategy), and Strategy B, in which surface water reservoirs have been developed and used along with groundwater abstractions for irrigation/urban water supply, have been developed. Several agronomic and irrigation scenarios have been developed and simulated with the Strategies A and B, namely historical irrigation and nutrient practices (A0/B0), deficit irrigation and historical nutrient practices (A1/B1), rainfed agriculture and historical nutrient practices (A2/B2), deficit irrigation and reduced nutrient practices (A3/B3), and deficit irrigation and rainfed agriculture and reduced fertilization (A4/B4).

2.4. Salinity, Chlorides Concentration, and Crop Yield

The crop yield is steady within a given range of soil salinity, but, after reaching a maximum tolerance level, the crop output decreases in an idealized, simple linear trend. The electrical conductivity of the water (ECw) can be approached with a concentration coefficient (X) that depends on the leaching physiology of the cultivated crops, and underlying soil, and the conductivity of soil extract (ECe) [4]. In order to take into account, the saline implications of the seawater intrusion on agricultural output, the crop yields are adjusted using a relative percentage of yield performance [3]. Electrical conductivity and chloride concentration observations performed by various public and private organizations and former studies, as described in [5], span from 1991 to 2015. Chlorides range from 4 to 1432 mg/L, and ECw ranges from 0 to 5 dS/m.

2.5. Agronomic Indices and Standardized Chloride Hazard Index (SCHI)

The Standardized Chloride Hazard Index (SCHI) has been used for detecting and characterizing the adaptation of using coastal groundwater for irrigation and the possible impacts of its use on the crop yield, as follows:
S C H I = C l i C l ¯ / σ C l
where Cli is the chloride concentrations as simulated by SEAWAT in a monthly timestep, C l ¯ is the monthly average, and σCl is the standard deviation of the chloride concentrations. The agronomic indices are based on the simulated crop yields by the REPIC model regarding the various alternatives. The index (CWP) quantifies the yield produced for every cubic meter of water applied. The Economical Water Productivity (EWP) indicator determines the performance at each cubic meter of water supplied, and, based on published commodity producer prices for agriculture by OECD–FAO until the 2030s [6], the index scores for the future periods have been projected and estimated. The Nitrogen Use Efficiency index (NUE) quantifies the yield produced for every kg of nitrogen applied.

3. Results-Discussion

3.1. Salinity Impacts on Crop Yield

Based on relevant measurements, it was possible to configure useful information for the relationship of chloride concentrations and electrical conductivity in the Almyros aquifer system. The linear regression equations that connect the two variables are:
E C w dS / m = 0.0032   ×   C l w   mg / L + 0.6212             R 2 = 0.9
C l w   mg / L = 272.32   ×   E C w dS / m 159.17             R 2 = 0.9
Additionally, the weighted mean leaching fraction and concentration coefficient of the Almyros aquifer are 0.1 and 2.1, respectively. Table 1 presents the rating of seawater intrusion and salinity hazards primarily for the Almyros groundwater body based on the classifications by [3]. According to the simulated chloride concentrations by the SEAWAT model and the crop yields by the REPIC model, Table 2 shows the mean Relative Yield changes caused by salinity for the two RCPs (4.5 and 8.5). Crop production would be reduced under historical irrigation practices regardless of the development of surface water reserves by –0.3% in RCPs 4.5 and 8.5 in 2019–2050 due irrigation groundwater salinity. The implementation of deficit and rainfed agriculture has a stronger positive influence on the decrease of salinization, and, thus, the contribution of the alteration of agronomic practices is evident with a 0.3% gain in productivity in 2019–2050. However, rainfed agriculture is more efficient to maintain and increase the crop production in 2051–2100 since it is not affected by the operation of reservoirs and the cessation of groundwater abstractions and groundwater salinity.

3.2. Agronomic Efficiency Indices and Water Resource Adaptation for Seawater Intrusion

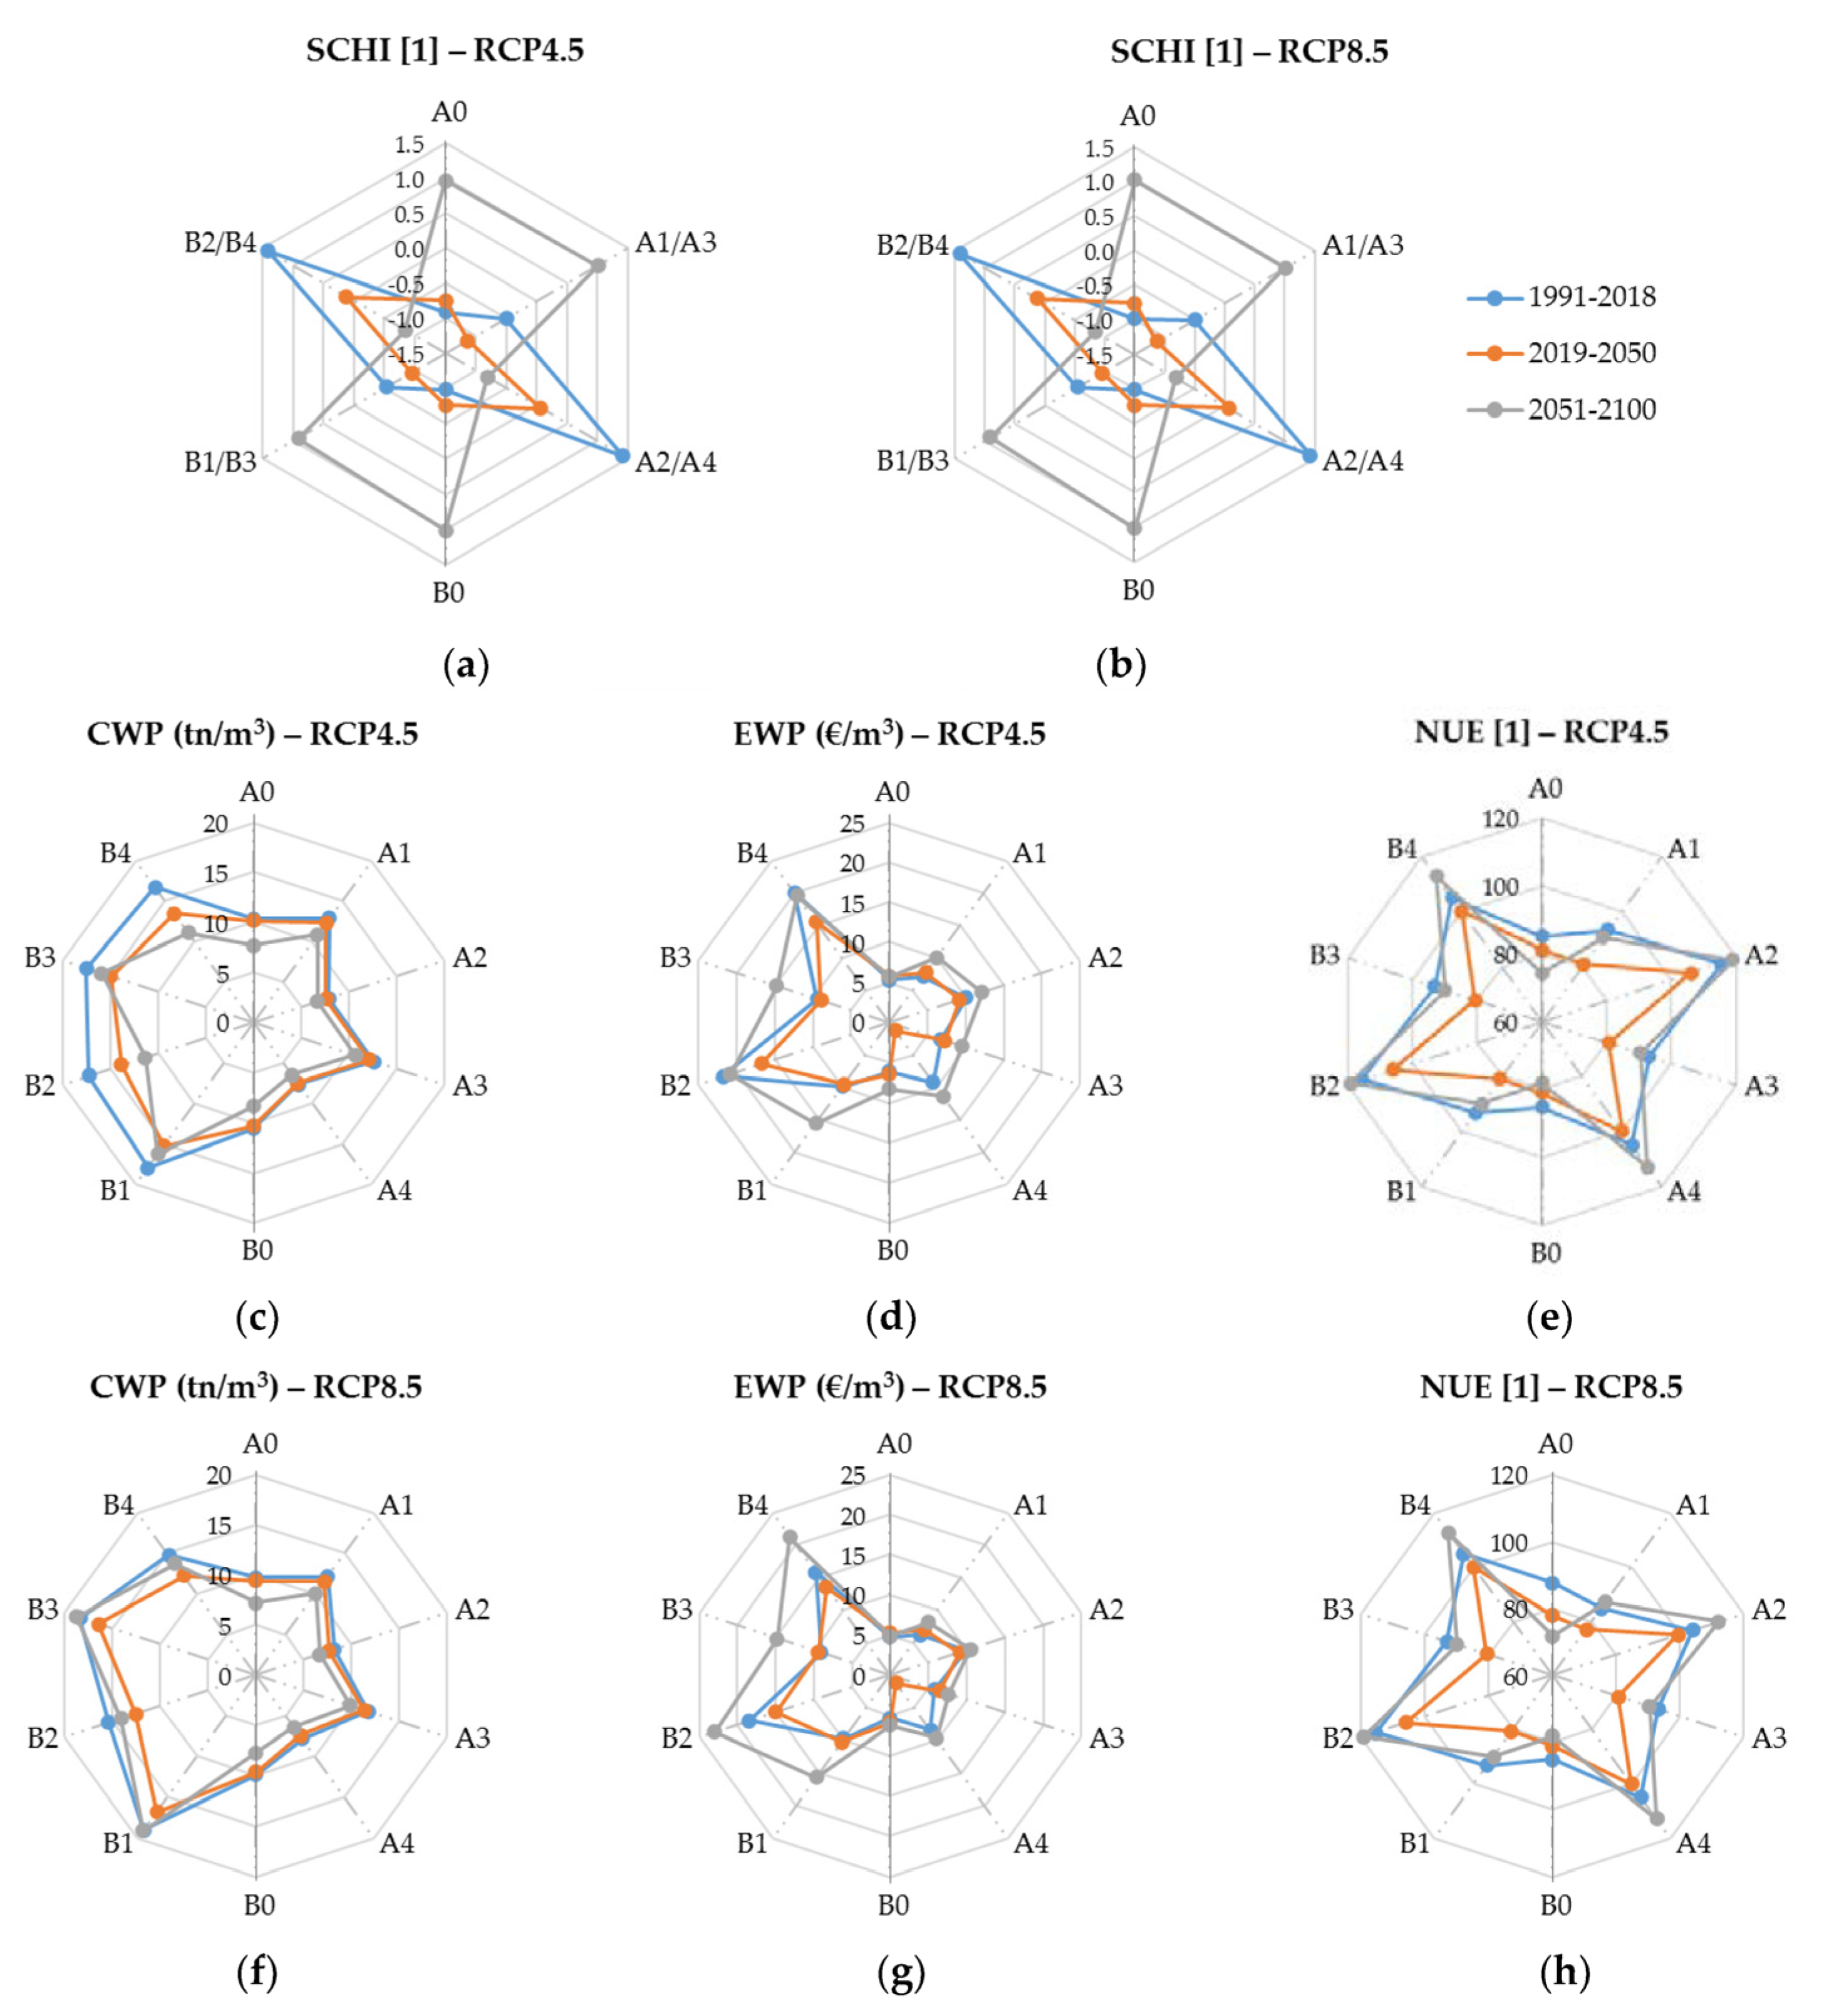
The agronomic efficiency indices and the water resources adaptation index for seawater intrusion have been estimated and summarized for the time periods of 1991–2018, 2019–2050, and 2051–2100. The SCHI index has been calculated based on the results of the Integrated Modelling System (IMS) and especially the SEAWAT model. SCHI index scores range for all scenarios and time periods from low salinity hazard, −1.14 in the historical period, to almost extremely high salinity hazard, 1.42 in the future period, proving the downgrading of the groundwater from non-saline to very saline. In 2019–2050 under historical and deficit irrigation practices, groundwater use for irrigation will pose low-moderate salinity hazards, whereas rainfed agriculture/deficit irrigation will pose moderate rates in both Strategies A and B and in both RCPs. However, in 2051–2100, the situation will be reversed. Low-moderate salinity hazards will appear during rainfed agriculture/deficit irrigation and moderate salinity hazards for the remaining scenarios for both RCPs.
The agronomic indices have been calculated based on simulations by the Integrated Modelling System (IMS). Crop yields are calculated by the REPIC model and the groundwater abstractions and quality by the MODFLOW and SEAWAT models. Crop yields are multiplied to their relative change, due to salinity impacts of the groundwater as irrigation water, to obtain the simulated production considering the salinity effects. Commodity prices, for use in the EWP index of the crop pattern, were estimated on a weighted spatial average of 0.33 €/kg crop yield in 1991–2018, 0.49 €/kg in 2019–2050, and 0.65 €/kg in 2051–2100. Figure 2 depicts the Crop Water Productivity (CWP), Nitrogen Use Efficiency (NUE), and Economical Water Productivity (EWP) indices’ values. CWP and EWP index scores thrive in Strategy B than in A, proving the benefits of surface water reserves on water efficiency. CWP weighted averaged values range from 6.4 tn/m3 to 19.4 tn/m3 in RCP8.5, and from 6.5 tn/m3 to 17.1 tn/m3 in RCP4.5. CWP variations are approximately 3 to 4 tn/m3 between deficit irrigation and rainfed agriculture/deficit irrigation practices.
The groundwater abstractions and salinity effects cause the productivity of water to decline mostly during 2019–2050. EWP scores follow the distribution of CWP. EWP ranges from 1.2 €/m3 to 10.5 €/m3 in RCP8.5 and to 12.2 €/m3 in RCP4.5 for Strategy A. For Strategy B, EWP ranges from 5.4 €/m3 to 22.9 €/m3 in RCP8.5 and from 6.1 €/m3 to 21.8 €/m3 in RCP4.5. EWP will be increased after 2050, but this would occur possibly due to the increase of future commodity prices. NUE index scores show a declining trend in ongoing fertilizer practices until 2100 in both Strategies and RCPs. NUE values in deficit irrigation and rainfed agriculture/deficit irrigation form a V–shaped evolution with the lowest points to show in 2019–2050 in both Strategies and RCPs. NUE maximizes under the alternative practice of reduced fertilization in both strategies and RCPs. In reduced fertilization, NUE gets scores higher than 100 kg of crop yield per kg of nitrogen applied, while in other alternatives the values range from 71.2 kg yield/kg nitrogen to 93.2 kg yield/kg nitrogen.

4. Conclusions

Water resources adaptation and agronomic efficiency scenarios have been applied under two ensemble RCPs (4.5 and 8.5) in the Almyros basin in Thessaly, Greece, using an Integrated Modeling System (IMS). The results according to SCHI, indicate that the groundwater used for irrigation will pose moderate salinity hazards in 2019–2050 in all strategies. Crop yields are expected to decline for most of the cultivars due to irrigation with salinized water, except for the rainfed agriculture/deficit irrigation alternative. CWP could be improved in the future in Strategy B, and EWP scores might be, also, greatly increased. NUE ratings are equivalent to crop yields, which are affected by the salinity status of groundwater used for irrigation. Hence, the future course of seawater intrusion in the Almyros aquifer is a crucial problem that should be addressed in the near future with drastic measures of water resources adaptation to climatic changes and water needs in order to ensure the success of adaptation measures to climate change and the sustainability of local agriculture.

Author Contributions

Supervision, review and writing, conceptualization, and methodology by A.L. (Athanasios Loukas); writing review and editing, investigation, data curation, software, methodology, formal analysis by A.L. (Aikaterini Lyra). All authors have read and agreed to the published version of the manuscript.

Funding

This research is co-financed by Greece and the European Union (European Social Fund- ESF) through the Operational Programme «Human Resources Development, Education and Lifelong Learning» in the context of the project “Strengthening Human Resources Research Potential via Doctorate Research” (MIS-5000432), implemented by the State Scholarships Foundation (ΙΚΥ).

Institutional Review Board Statement

Not applicable.

Informed Consent Statement

Not applicable.

Data Availability Statement

The results of this study are freely available.

Acknowledgments

This work was based on the Med-CORDEX initiative (www.medcordex.eu) (accessed on 1 February 2023).

Conflicts of Interest

The authors declare no conflict of interest.

References

  1. Cheng, M.; Wang, H.; Fan, J.; Wang, X.; Sun, X.; Yang, L.; Zhang, S.; Xiang, Y.; Zhang, F. Crop yield and water productivity under salty water irrigation: A global meta-analysis. Agr. Water Manag. 2021, 256, 107105. [Google Scholar] [CrossRef]
  2. Lyra, A.; Loukas, A. Simulation and Evaluation of Water Resources Management Scenarios Under Climate Change for Adaptive Management of Coastal Agricultural Watersheds. Water Resour. Manag. 2022. [Google Scholar] [CrossRef]
  3. Zaman, M.; Shahid, S.A.; Heng, L. Irrigation Water Quality. In Guideline for Salinity Assessment, Mitigation and Adaptation Using Nuclear and Related Techniques; Springer International Publishing: Cham, Switzerland, 2018; pp. 113–131. [Google Scholar]
  4. Ayers, R.S.; Westcot, D.W. Water Quality for Agriculture; Food and Agriculture Organization of the United Nations: Rome, Italy, 1985; Volume 29. [Google Scholar]
  5. Lyra, A.; Loukas, A.; Sidiropoulos, P.; Voudouris, K.; Mylopoulos, N. Integrated Modeling of Agronomic and Water Resources Management Scenarios in a Degraded Coastal Watershed (Almyros Basin, Magnesia, Greece). Water 2022, 14, 1086. [Google Scholar] [CrossRef]
  6. Organisation for Economic Co-Operation and Development; Food and Agriculture Organization of the United Nations. OECD-FAO Agricultural Outlook 2022–2031; FAO: Rome, Italy, 2022. [Google Scholar]
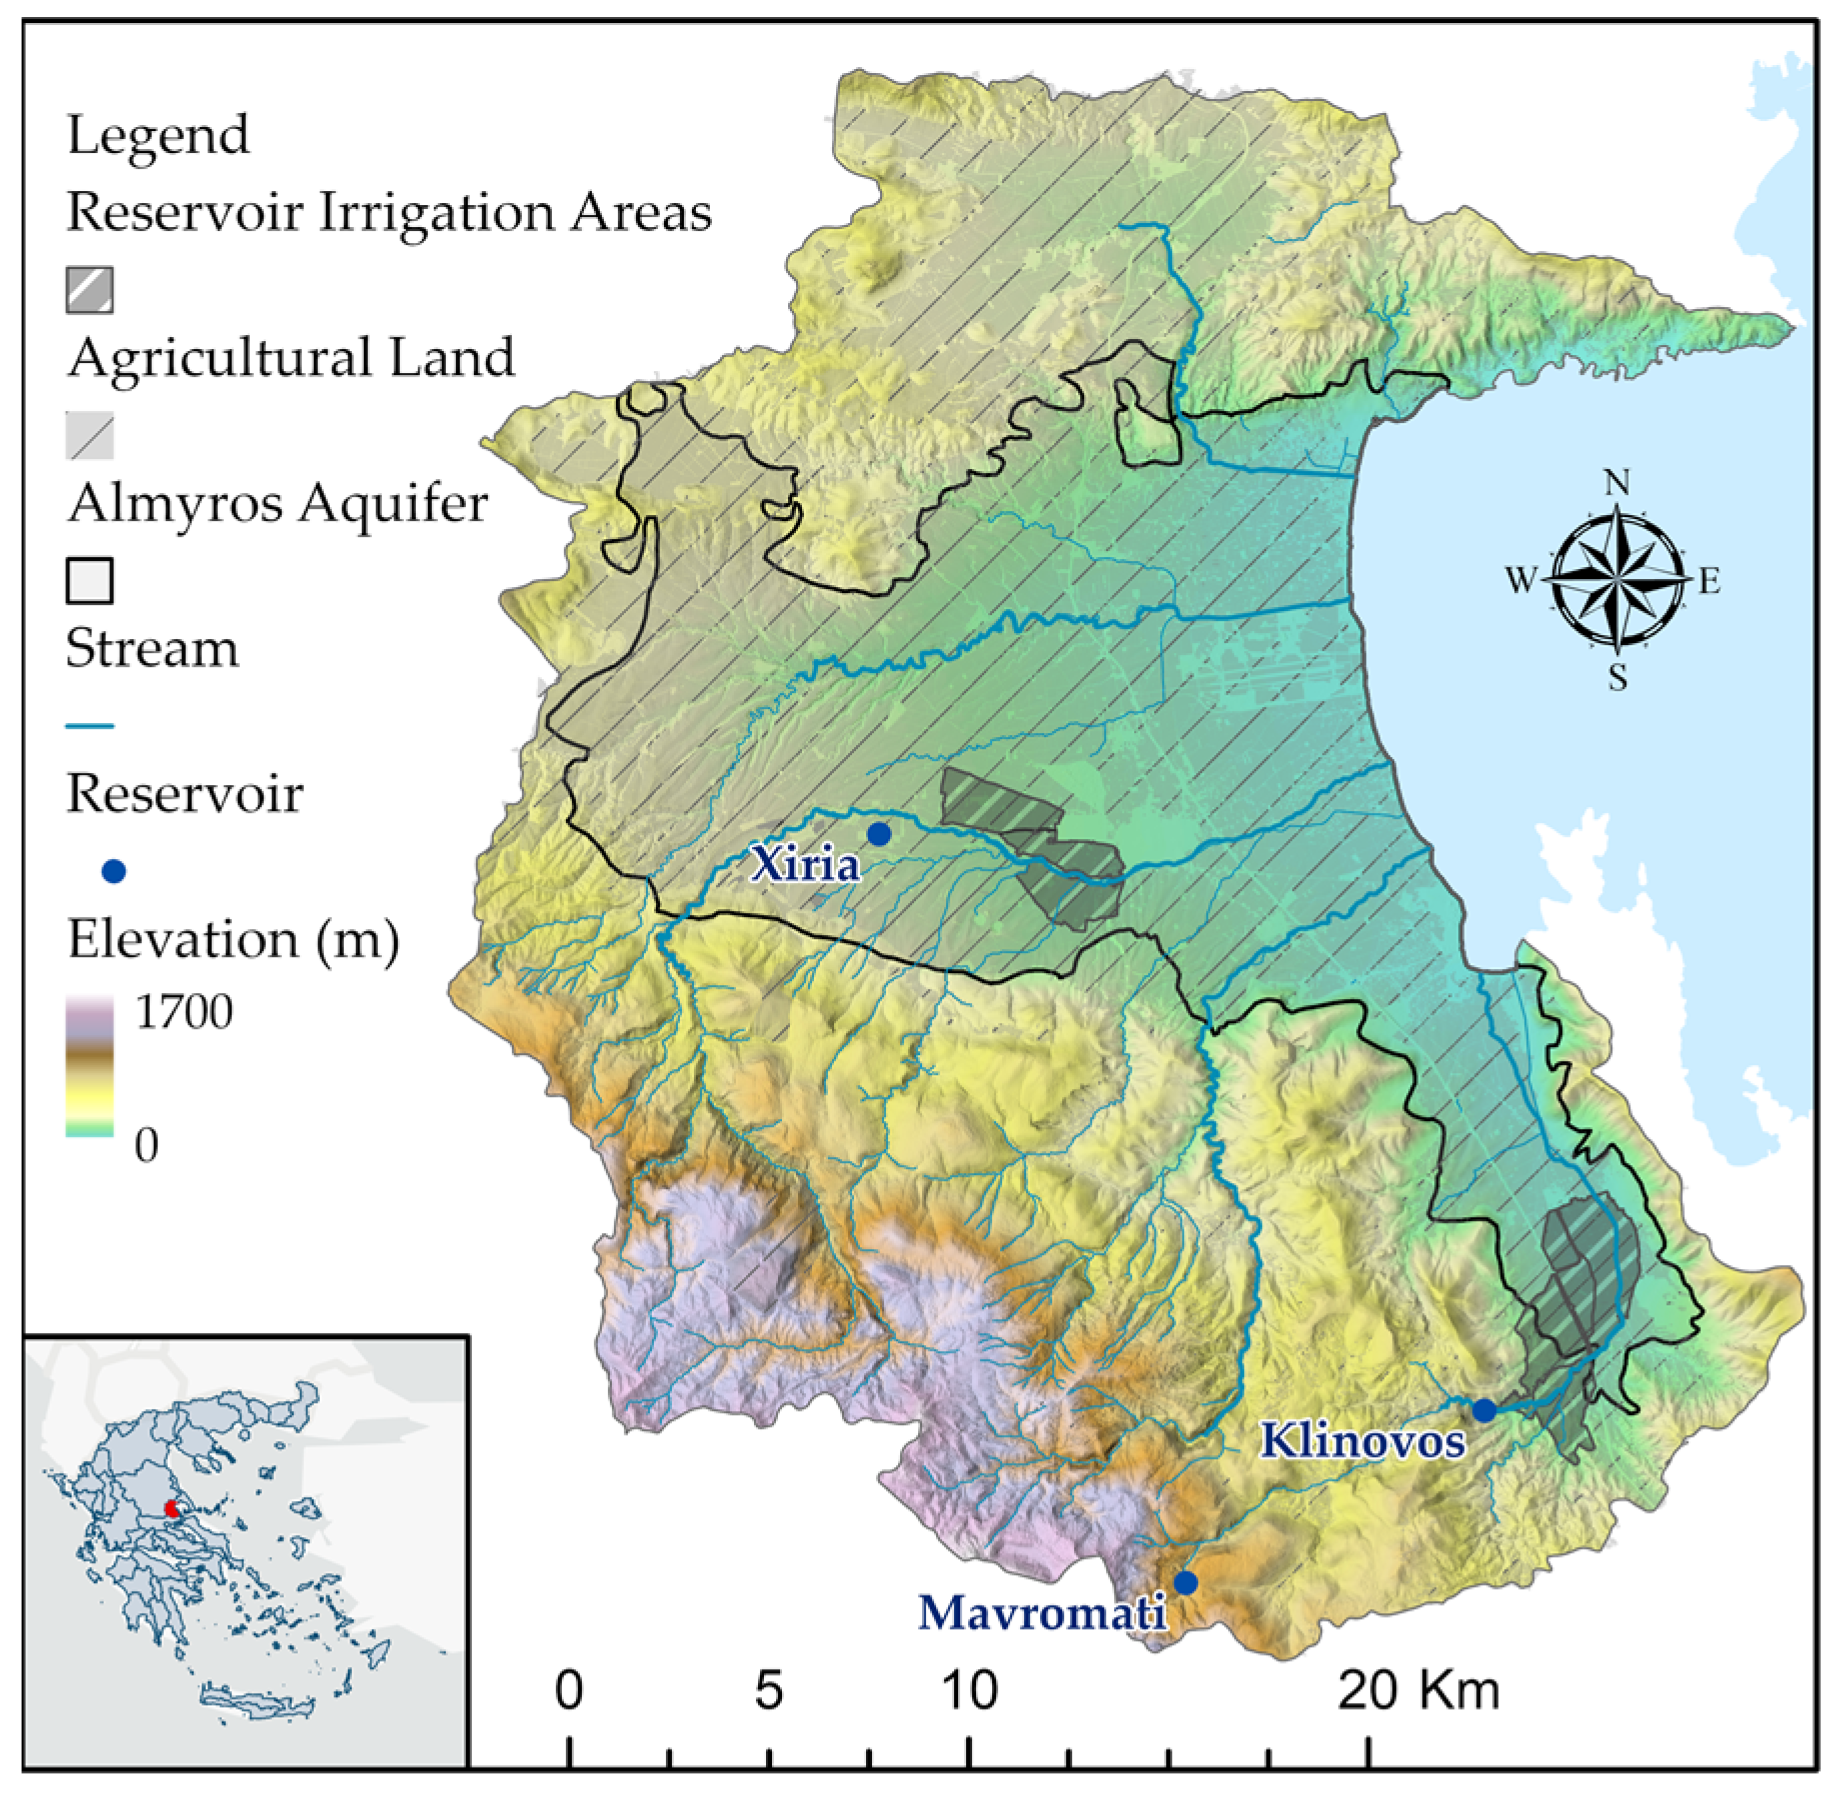
Figure 1. Elevation of the Almyros basin, principal streams, Almyros aquifer system, reservoir locations, and irrigated regions.
Environsciproc 25 00023 g001
Figure 2. Standardized Chloride Hazard Index (SCHI), Crop Water Productivity (tn/m3), Economic Water Productivity (€/m3), and Nitrogen Use Efficiency for the Strategies A (groundwater resources—right) and B (for groundwater resources and reservoirs storage water—left); for the agronomic/irrigation scenarios 0: historical practices of irrigation and fertilization; 1: deficit irrigation and historical fertilization; 2: deficit/rainfed irrigation and historical fertilization; 3: deficit irrigation and reduced fertilization; and 4: deficit/rainfed irrigation and reduced fertilization. Climate change is shown for the average values of the periods 1991–2018, 2019–2050, and 2051–2100 in (a,ce) for the RCP4.5; (b,fh) for the RCP8.5.
Environsciproc 25 00023 g002
Table 1. Classification of the electrical conductivity of saturated extract (ECe), the pumped groundwater for irrigation (ECw), the chloride concentrations (Clw) of water, and the Standardized Chloride Hazard Index (SCHI) with regard to the salinity hazards.
ECe (dS/m)ECw (dS/m)
(CF = 2.1)
Clw (mg/L)SCHW IndexHazard
0–20–0.950–100<–1.2Low with normal yields
2–40.95–1.90100–360−1.2:−0.9Low-moderate with yield decrease of sensitive crops
4–81.90–3.81360–878−0.9:−0.1Moderate with yield decrease of crops
8–123.81–5.71878–1397−0.1:0.7High with yield for tolerant crops
>16>7.62>1916>1.5Extremely high with yield for tolerant crops
Table 2. Relative Yield changes of the future periods from the historical period for the water resources and agronomic scenarios for both RCPs (4.5 and 8.5).
TimeA–0A–1/A–3A–2/A–4B–0B–1/B–3B–2/B–4
2019–2050−0.3%0.3%0.3%−0.3%0.3%0.3%
2051–2100−14.8%−0.4%0.4%−10.9%−0.7%0.4%
Disclaimer/Publisher’s Note: The statements, opinions and data contained in all publications are solely those of the individual author(s) and contributor(s) and not of MDPI and/or the editor(s). MDPI and/or the editor(s) disclaim responsibility for any injury to people or property resulting from any ideas, methods, instructions or products referred to in the content.