1. Introduction
Hydraulic calibration is a crucial process in water supply system (WSS) modelling aiming to modify the network parameters to minimise the difference between measured data and simulated results [
1]. However, achieving an accurate and reliable model is a hard task due to the high uncertainty that affects most of the WSSs. In the latest years, many efforts have been made to explore different calibration techniques [
2]. In particular, many authors (e.g., [
3,
4,
5,
6]) focused on the estimation of the network parameters (e.g., pipes roughness and water demand) using an implicit technique based on heuristic algorithms. Therefore, the problem is formulated as an optimisation where the algorithm has to find the optimal hydraulic parameters to minimise the difference between observations and model results. However, the inability to have an adequate number of measured data for both economic and technical reasons yields the problem ill-posed. It means that the number of measurements is fewer than the number of equations, leading to an undetermined problem. In the literature, this problem has been recently tackled by performing several runs of the heuristic algorithm to obtain the average solution [
4,
7,
8], which is considered a good estimation of the calibrated model.
The parameters of the hydraulic model that are affected by the highest uncertainty are the water demands and the roughness of the pipes [
9]. However, the setting of hydraulic components, such as the pressure reducing valve [
10], have to be calibrated in the case of limited knowledge of the WSS configuration. The water demand consists of the water delivered to the WSS consumers (i.e., water requests) and the water losses of the distribution network (i.e., water leakages). Thus, demand can be tackled with a decomposition approach in order to decrease the complexity of the procedure.
In particular, the quantification of the leakage is a complex task due to its unpredictable nature but also due to the impossibility of directly measuring its distribution along the network [
11]. Typically, a leakage is represented as a pressure-dependent withdrawal simulated as emitter flows at selected nodes [
12]. Many variables, such as pipe age or material, influence the leakage occurrences. Therefore, some authors (e.g., [
13,
14]) studied the dependence between these variables and the leaks, providing ranges obtained with different types of experimental studies. However, a reliable function that precisely models the leakage parameters dependence has not been found yet [
15].
Several authors (e.g., [
6,
16,
17]) developed techniques based on optimisation algorithms to detect and quantify leakages using hydrant discharge to simulate leakages in hydraulic models [
9]. For example, the emitters are used in EPANET [
18] at this aim. Leakages detection is performed by minimising a function representing the difference among simulated values and measured values by means of an optimisation algorithm (i.e., genetic algorithm).
In this paper, a calibration procedure for a real WSS characterised by significant leakages is proposed. In order to achieve this aim, a static condition is considered, that is the calibration process considering a set of known pipes flow rate and a set of nodal pressure measured at a given moment. In particular, a procedure based on the non-dominated sorting genetic algorithm II (NSGA-II, [
19]) is developed for the calibration of pipe leakage and valve status. Firstly, to take account of the leakage amount and distribution in the network, the water demands are decomposed in two components: the users request and the background leakages. The water request of the users is defined through an analysis of the consumptions of a representative district metered area. The background leakages are instead unknown and need to be calibrated. Both of these components are simulated using a hydraulic approach that is able to simulate distributed demands along the pipes. Secondly, the status of two valves at the outlet of the tanks are considered. The setting of the valves is also introduced as a variable in the calibrator.
The rest of the paper is organized as follows: test case introduction, calibration methodology presentation, results, and conclusion discussion.
2. The WSS of Egna
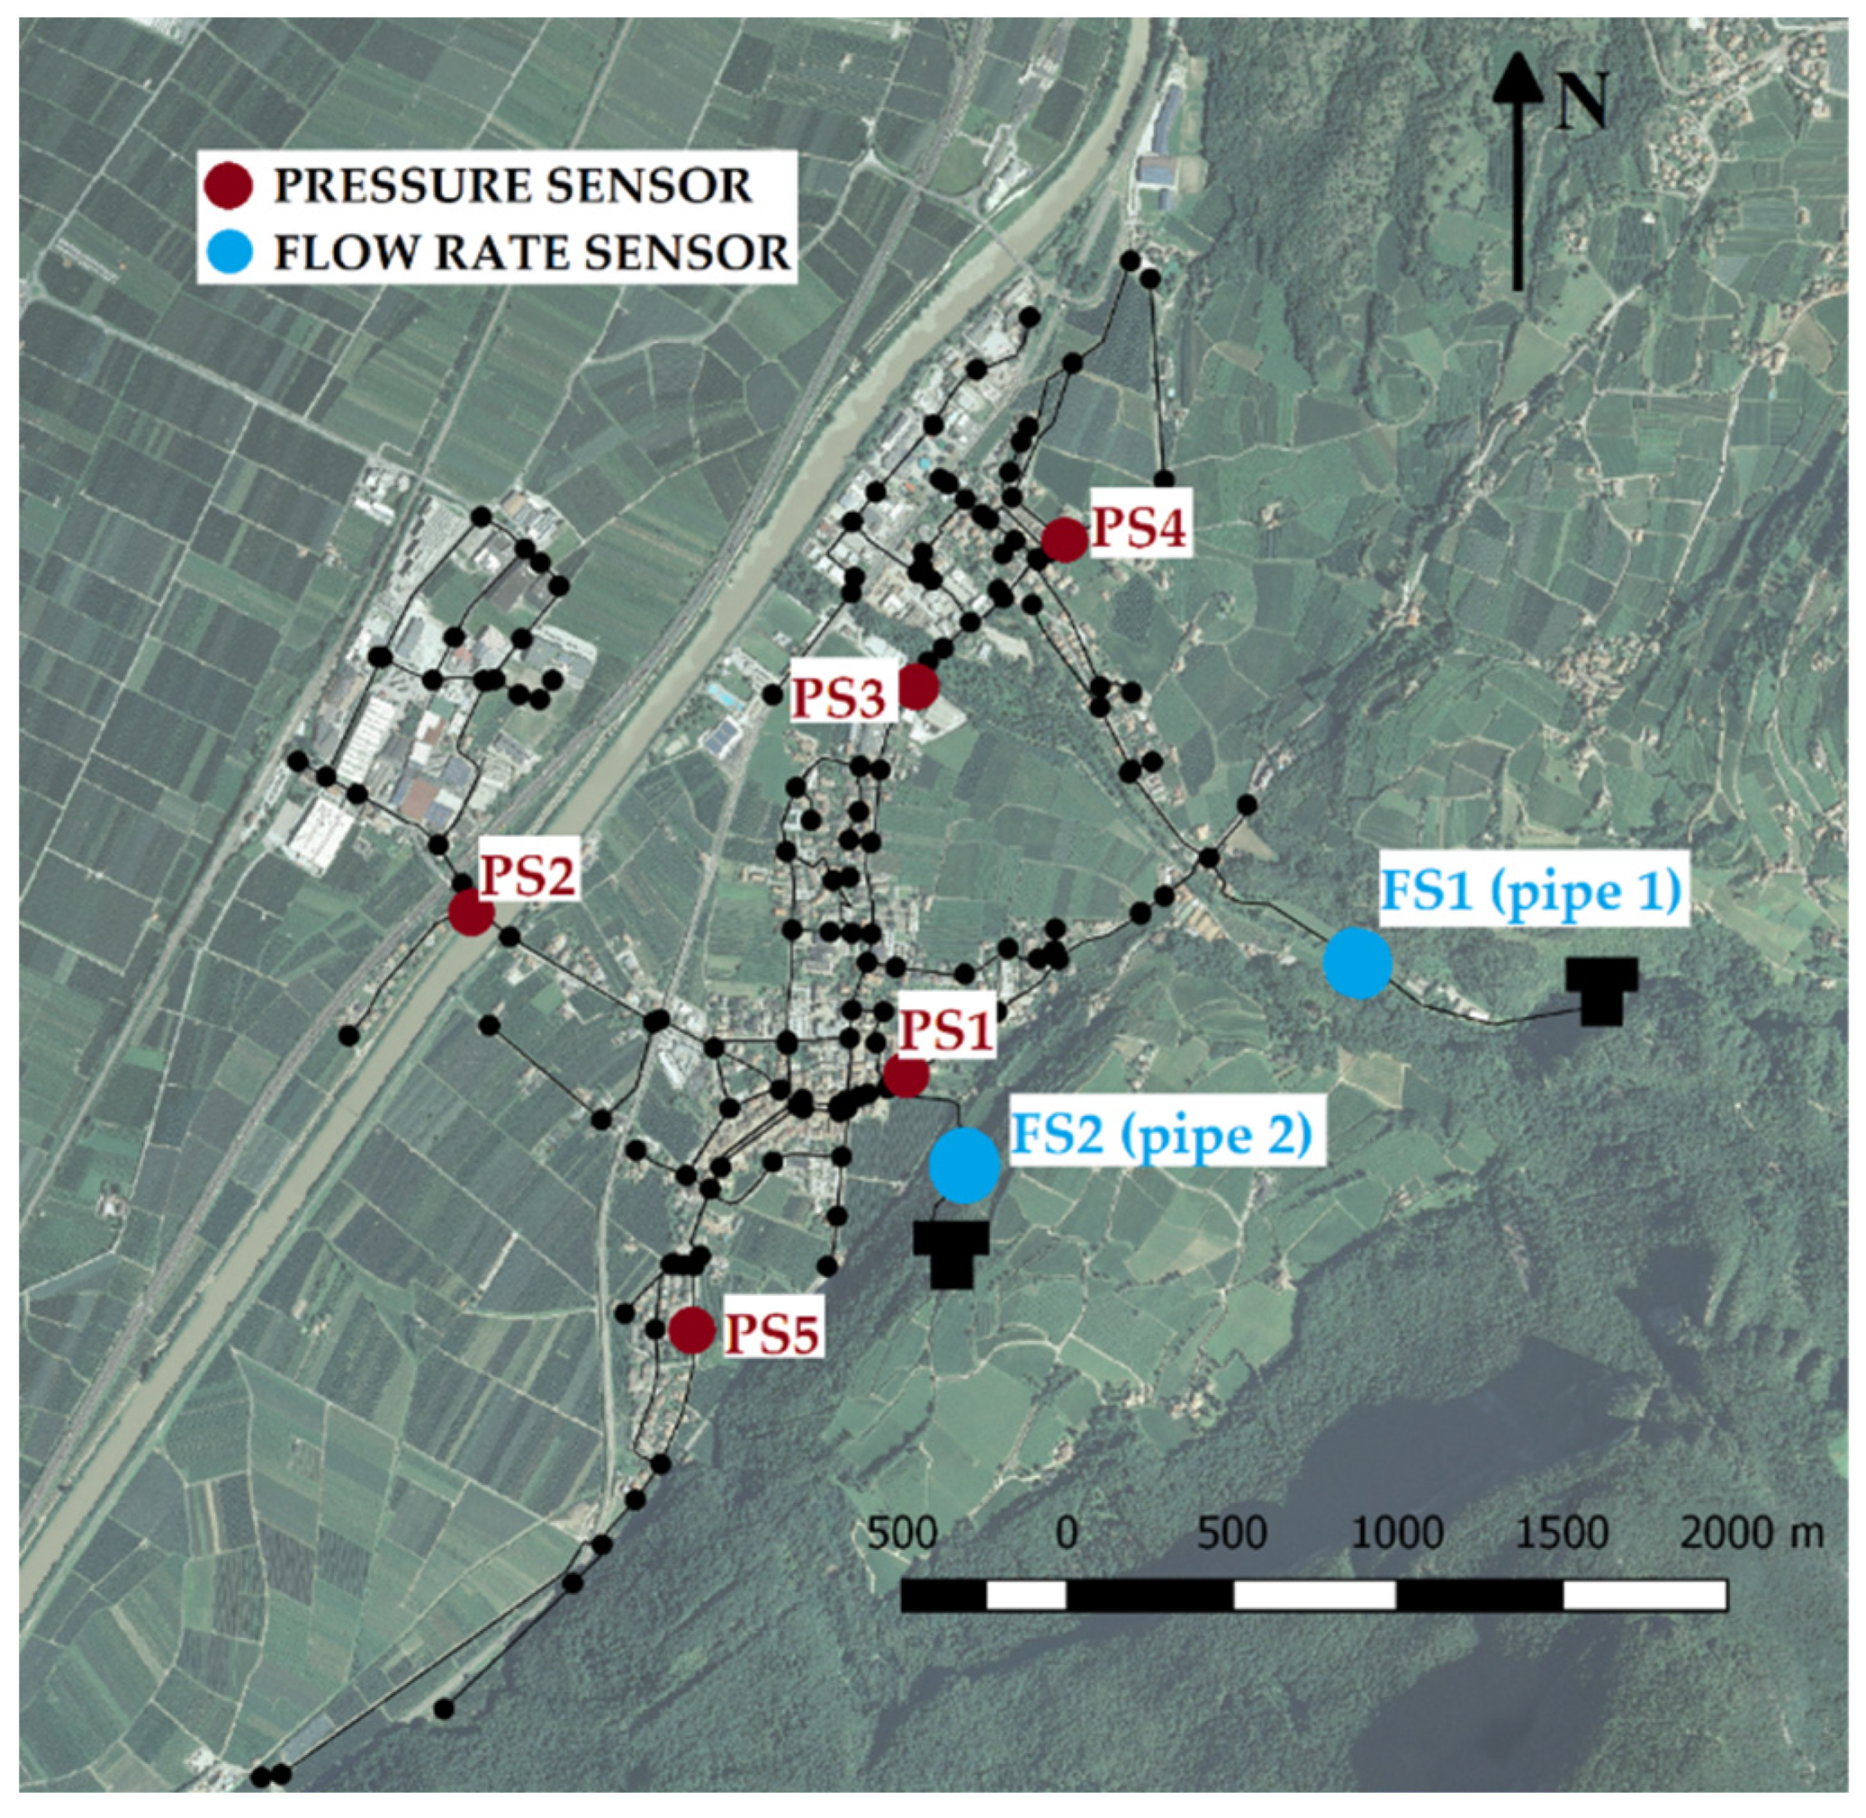
The WSS of Egna (
Figure 1) is located in the Alpine region of the Bozen—Bolzano Province (Italy). The Municipality of Egna has a population of 5250 users and approximately an extension of 23.5 km
2. This WSS is served by two main tanks, which provide the necessary water to the system. It is a mountain WSS, characterised by a high difference in altitude between tanks and users. This condition leads to a high-pressure distribution and demanding management of the network. Hence, this small WSS is affected by a high amount of water leakage spread in the entire network.
Concerning the network model components, the material, the age, and the diameter of the network pipes are known. Consequently, the actual roughness of each pipe in the network has been estimated by using the formulation proposed in [
20]. The water requests have been calculated through an analysis of a representative district of the network, which has been properly isolated for a week. During that period, the flow entering in the isolated district has been measured. Therefore, the total water demand of the WSS has been estimated on the basis of the district demand analysis. The distribution of the consumers demands along the pipes has been accurately defined thanks to the municipality geo-referenced database.
However, two important terms remain unknown. The first one is the background leakage component, which strongly affects the network’s behaviour. The second one is the setting of valves placed in the pipes that connect the two tanks with the distribution network.
The data collected by the pressure and flow sensors used as measurements in the calibration procedure are reported in
Table 1. The pressure data were collected from the 10th to the 20th of May 2019. The measured pressure and the flow rate values were selected on Thursday the 16th at 20 p.m., when the demand request corresponded to its average daily value.
3. Methodology
In this section, the methodology to calibrate the Egna WSS is presented. In particular, this procedure has to solve the uncertainty related to the leakage behaviour and the status of the valves. Regarding the first uncertainty, it is proposed to perform the calibration considering the water demands as composed of two components, which are users request and the background water leakage. The water request is deterministically calculated (see
Section 2), while the water leakage term is involved as a variable of the heuristic calibration procedure. Knowing the widespread losses throughout the network, it is proposed to model both the water demand components as uniformly distributed along the network pipes. The distributed water demand scheme is adopted, since it is actually the most performant hydraulic approach to resemble a realistic withdrawal distribution [
21,
22]. At the same time, the background leakages are represented as uniformly distributed along each pipe of the network. However, the water leakage of each pipe in the network has to be calibrated.
Concerning the valve problem, it is advanced to calibrate the pressure dissipation by the two valves located at the outlet of the tanks. This decision is taken due to the lack of information about the status of these valves.
3.1. Modelling Approach
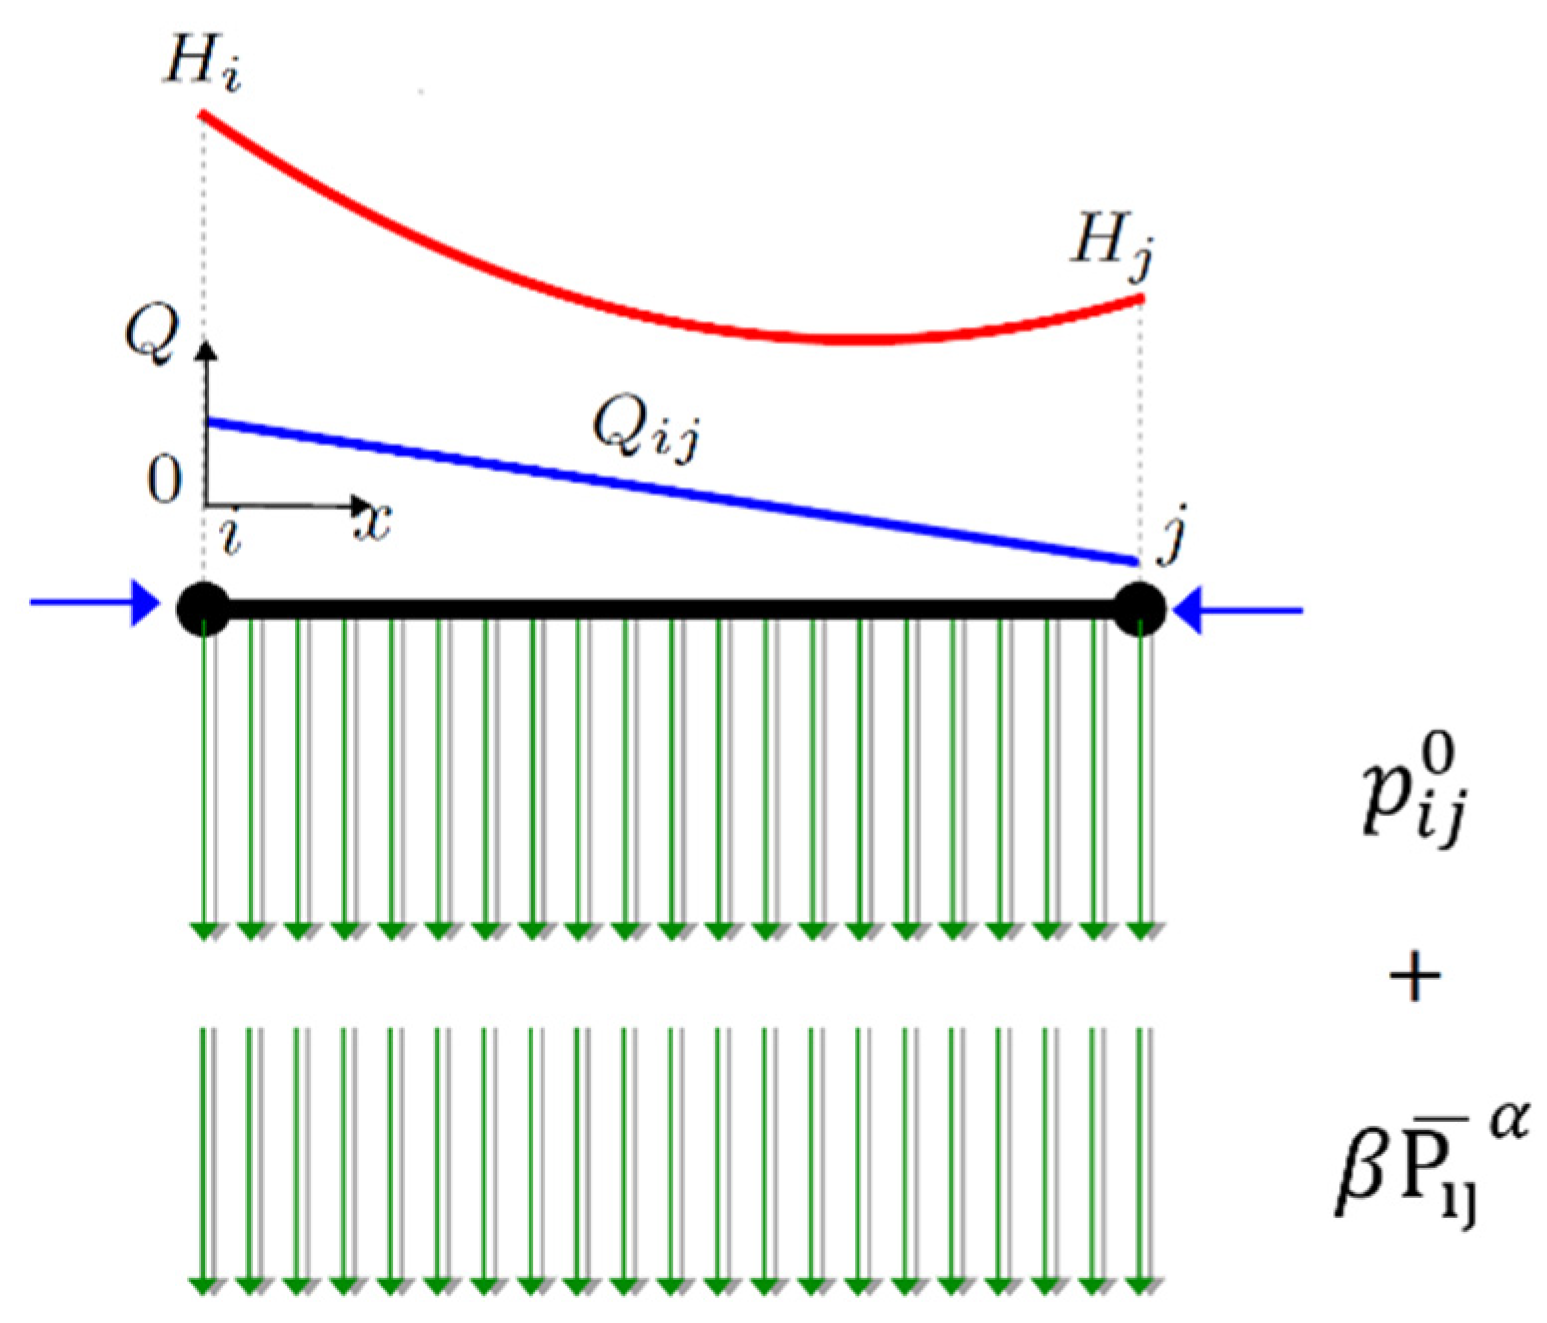
Typically, the leakage is modelled as an emitter node, which is hydraulically equivalent to a hydrant concentrated at a node. However, in our case the water losses are spread in the entire network, therefore a distributed demand scheme is used. To model the water demand, the following expression is adopted:
where the first term
concerns the deterministic water request of consumers aggregated at the
pipe and the second term
regards the leakage uniformly distributed along the
pipe. In particular,
is the average pressure at the
pipe, and
and
are the leakage model parameters [
11], where
is fixed to 0.5, since the most present material is the steel [
23,
24], and
has to be calibrated for each pipe. The resulting
is a constant expression of water demand per meter of pipe.
In order to implement the demand expression of Equation (1), a hydraulic approach is selected that integrates the distributed demand along pipes [
21]. The mass balance at the
node can be read as:
where
represents the pipe length and
represents the water demand calculated as in Equation (1). Since the flow rate is a linear function along each pipe, the energy balance equation in the
pipe is as follows:
where
is the hydraulic resistance,
is the coefficient that depends on the head loss mathematical formulation, and
is the nodal hydraulic head. The Darcy–Weisbach expression with
equal to 2 is used in this work.
An overview of the proposed approach is reported in
Figure 2, where the two uniformly distributed demand components are shown.
3.2. Calibration Approach
A multi-objective procedure based on NSGA-II has been developed to calibrate a WSS characterised by elevated pressure and a high amount of background leakages. Therefore, this process has been formulated as an optimisation procedure, where two objective functions expressed as the difference between measured values and simulated values have to be minimised. The 2 expressions read as:
where
and
are respectively the measured and calibrated pressure values at the
node and
and
are respectively the measured and calibrated flow rates at the
pipe. Afterwards, the genetic algorithm selection has been applied through a binary tournament. Then, the crossover and the mutation operators create a new generation that performs a new iteration. In this study, tournament selection, simulated binary crossover, and polynomial mutation are applied to perform the optimisation problem.
The variables adopted in this calibration process are the
parameter of the leakage model and the valve pressure dissipation at the 2 tank outlets. The
boundary read as:
The range has been chosen after multiple runs to ensure the stability of the hydraulic simulations. It is worth noting that, due to the high pressure available in the WSS, the boundary of the parameter is very sensible.
The boundaries for the valve head losses selected are:
where
and
are the dissipated pressure by the valves installed in pipe 1 and pipe 2, respectively. The range selected covers all the available hydraulic heads, including the height difference between tanks and the valley nodes.
The problem is ill-posed because the number of measurements is less than the number of variables of the calibration process. To deal with this problem and to have a proper estimation of the pressure at the nodes and flow rates along the pipes, an approach similar to [
4,
7,
8] is adopted, and 50 runs of the calibrator are performed. Therefore, the nodal pressures and the pipe flow rates are averaged in order to obtain a reliable and stable simulation of the network.
4. Results and Discussion
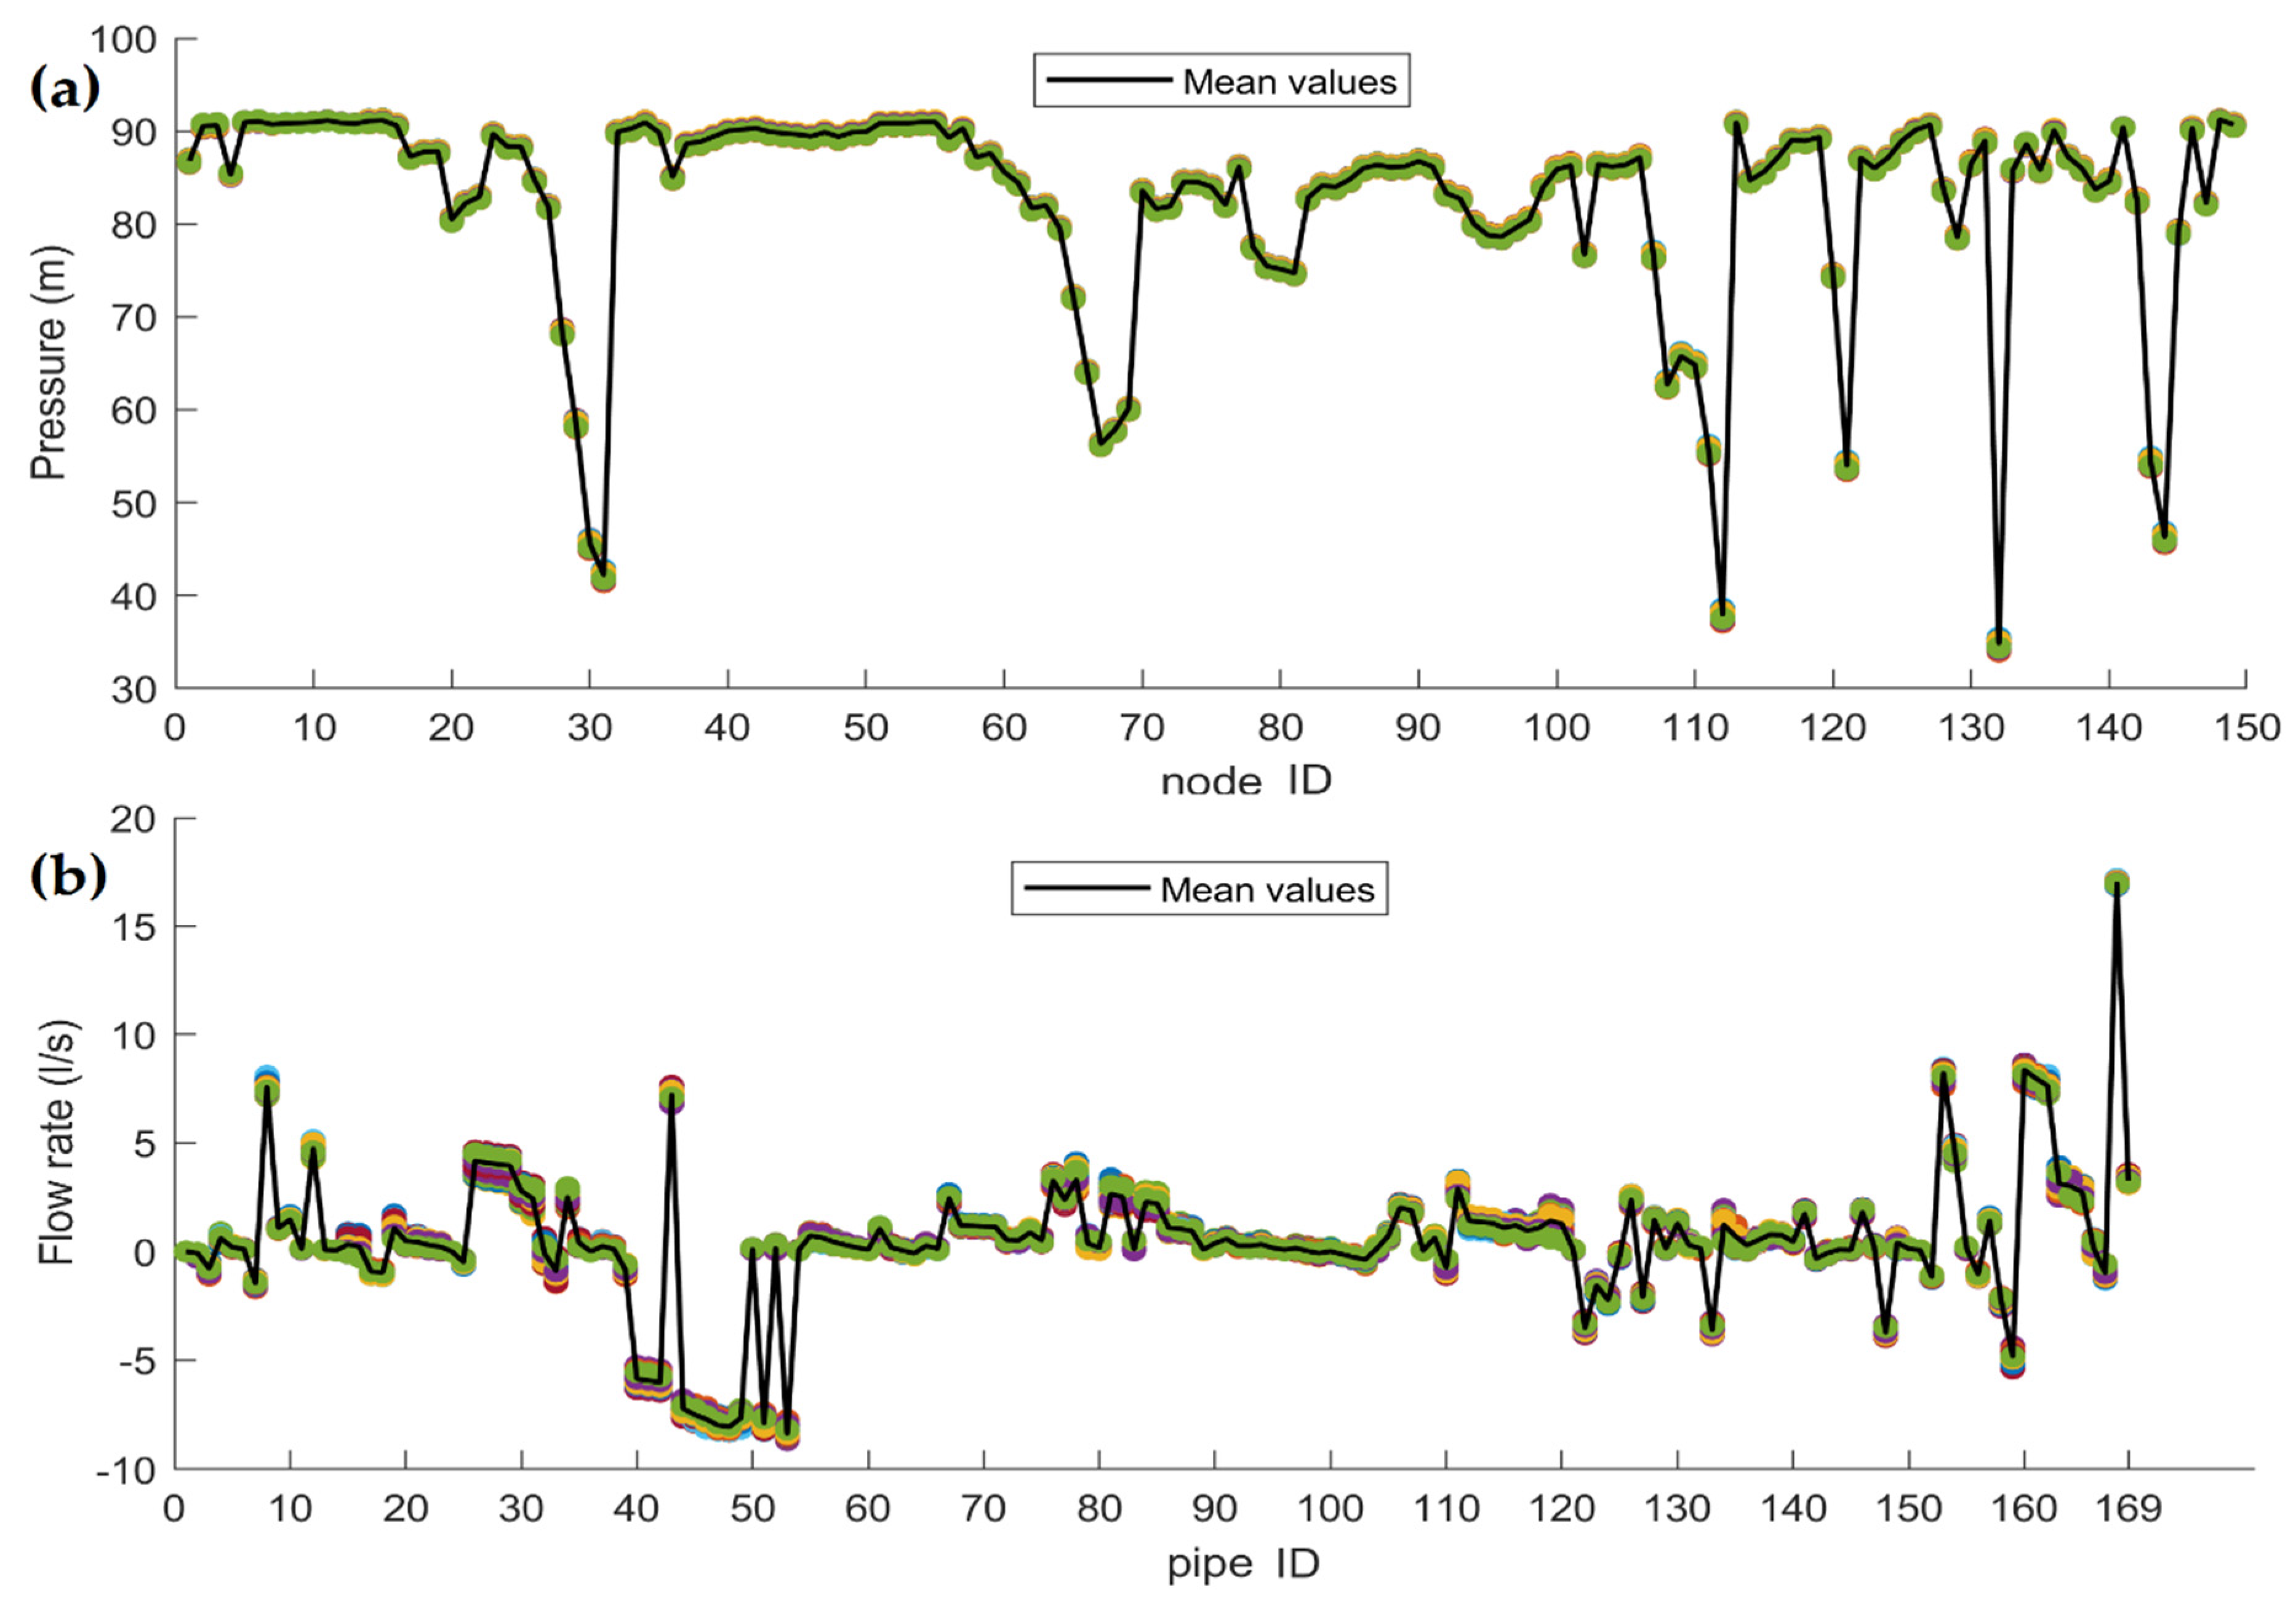
The results of the proposed calibration are presented in this section. In particular, the distribution of the pressure at each node is reported in
Figure 3a, whereas the flow rate distribution is reported in
Figure 3b.
In
Figure 3a, the pressure results obtained by 50 runs of the calibration are reported. Due to the limited fluctuation at each node and the accurate matching of the measurements, a good convergence in the selected boundaries is achieved. The non-uniqueness problem of the solution is overcome using the mean values as a stable estimation of the real condition. The mean values resemble each measurement point, being accurate to reproduce the behaviour of the WSS.
Differently from the pressure, the available flow measurements (
Figure 3b) are related only to 2 pipes. Despite the lack of information, the convergence and the stability are again granted due to respect of the measurements and to the low flow rate variations, respectively. Thus, the mean values are stable, offering a proper estimation of the flow rates in the network.
Concerning the pressure dissipated by the valves, the simulation results are reported under Box & Whisker plot in
Figure 4.
Both
Figure 4a,b highlight the active status of the valves in pipe 1 and pipe 2. The first valve dissipates a pressure of around 17.5 m and the second of around 9.2 m. The goodness of the mean solution is demonstrated by the limited excursions of the setting values resulting from all the 50 runs.
The analysis of the water leakage distribution at the network pipes is proposed at
Figure 5. The water demand at each pipe is shown following the dual components: the average water leakage distribution of the 50 runs and the water requests. It is worth noting that the average solution resulting from the proposed calibration procedure conserves the mass balance, allowing us to estimate the water leakage. It is also known that a precise location of the water losses cannot be achieved with the few available measurements.
5. Conclusions
In this study, a methodology to calibrate leakage distribution and valve status in a real mountain WSS affected by elevated pressures and high amount of water losses has been presented. The lack of information regarding the WSS lead to an ill-posed problem. To deal with this problem and to overcome the non-uniqueness of the solution, 50 runs of NSGA-II calibrator have been performed to achieve the average values. To properly address the leakage problem, the water demands have been modelled considering water requests and leakage as two separate components. Moreover, a hydraulic approach that is able to simulate water demand uniformly distributed along pipes has been adopted. The uncertainty related to the status of two valves has been considered, founding the setting of the two valves. From a practical point of view, this methodology can provide an accurate hydraulic model of WSSs with significant water leakages and unknown status of pressure-reducing valves. In addition, the proposed algorithm can support the WSS operators in the control of water losses and the proper management of pressure.


