Next Article in Journal
Energy Benchmarking and Optimization of Wastewater Treatment Plants in Greece
Previous Article in Journal
Nature-Based Solutions (NBSs) Application for Hydro-Environment Enhancement. A Case Study of the Isar River (DE)
 
 
Please note that, as of 4 December 2024, Environmental Sciences Proceedings has been renamed to Environmental and Earth Sciences Proceedings and is now published here.
Proceeding Paper

Sub Zoning as a Measure for Water Supply Optimization—Case Study of the City of Nikšić †

1
Jaroslav Černi Water Institute, 11226 Belgrade, Serbia
2
Waterworks Company Nikšić, 81400 Nikšić, Montenegro
*
Author to whom correspondence should be addressed.
Presented at the 4th EWaS International Conference: Valuing the Water, Carbon, Ecological Footprints of Human Activities, Online, 24–27 June 2020.
Environ. Sci. Proc. 2020, 2(1), 37; https://doi.org/10.3390/environsciproc2020002037
Published: 31 August 2020

Abstract

:
The drinking water supply of the city of Nikšić, the second largest city in the Republic of Montenegro, is secured from a nearby karstic groundwater resources. Water is transported from two different directions (two sources) into the distribution system. At the end of the distribution system, on the opposite side of water resources, there is a counter tank, as the only storage capacity for leveling the inflow and consumption in the system. However, the interplay of the three vital water supply capacities (two water sources and counter tank) does not meet the requirements of regular supply, to the point where it is necessary to disconnect the tank, from regular operation. The existing system, which operates without leveling space, is fraught with numerous problems, ranging from the appearance of significant temporal and spatial pressure variations, to the inability of delivering the needed quantities to the peripheral parts of the system, in seasonal peaks of consumption. During International project Drinkadria (2013–2016), efforts for solving numerated problems were done. This paper provides an overview of activities on system operation analysis, based on simulation modeling and definition of technical solution, proposed in the form of subzoning. Realization of proposed subzones will put all capacities in the full operation state, with the realization of stable pressures in the system, and with a regular supply of all parts of the system in all predictable modes of consumption.

1. Introduction

Within the project “Drinkadria”, many interesting papers and outputs have been created [1,2,3]. On the pilot area of the city of Nikšić, with its population of about 65 thousand, aim was to improve the performance of the existing drinking water supply system (WSS).
Improving the performance of the WSS generally comprised the following activities:
  • Collecting all relevant data about the WSS (physical part, consumption, and management),
  • Construction of the existing hydraulic net WSS model, with all appropriate links and conditions,
  • Model calibration of the existing state of the system, based on measurements of pressures and flows, which are performed at numerous measuring points in the system.
  • Proposal for improvement of the system performance, defined on the appropriate (adapted calibrated) model, with results, which clearly indicate improvements of system work.
Analysis also concerned the occurrence of losses, whose participation in system production of about 70% represented a special problem, which also had to be treated by the activities in question. This is particularly significant from the point of view of the conclusions reached during the analysis of the current state of the system, contained in the knowledge that the occurrence of losses in the WSS could not be viewed solely as a consequence of common reasons—the age of pipelines installed, the imperfection of water billing methods and the existence of illegal consumption. These phenomena have been observed and have some influence, but it is concluded that losses in the WSS occur primarily because of the realized model of water flow in it. This means that the water supply in Nikšić is unfavorable to the extent that it produces circumstances that favor the occurrence of network failures, so leakage in the WSS has been mainly of systemic character. So, measure usual applied for the rehabilitation—replacement of worn pipe material, would not produce the expected effect, since they would treat only the consequence, not the cause of the leakage appearance. Systemic losses can only be eliminated by realization of systematic alternations—by changing the model of the water flow. Leakages in the network should certainly be detected and repaired, but this replacement should be performed within a strategically altered system—in the circumstances that would not produce the conditions for loss occurrence. The following activities have been done:
  • Division of the system into consumption zones, each characterized by a unique feeding pipeline, with the absence of transverse connections with adjacent zones,
  • Flow and pressure measurement activities, followed by simultaneous readings on water meters and model testing, formed in several standard methods (balance and night flow methods),
  • System analysis on a calibrated net model, aimed to identify the parts where significant loss occurrence is expected and defining a priority plan for further detailed field research.
Although losses do not represent the main researching subject, the previous explanations have been provided in terms of describing activities aimed at defining the current state of the system.

2. Water Supply System of Nikšić

Today’s water supply system of Nikšić is based on the usage of two sources:
  • Vidrovan—capped springs, located 15 km north of the city, with used capacity of 250–450 L/s,
  • Poklonci—well spring, located 5 km east of the city, with capacity of 200 L/s.
The Vidrovan source, located at an elevation 664 m a.s.l., is permanently active. Water from Vidrovan is placed gravitationally into the system. For 9–10 months a year, its capacity meets the needs in Nikšić system (400 L/s, at the level of average annual production). The water quality at the source is in line with the drinking water standards, so disinfection represents the only applied treatment. In addition, it is emphasized that tank space has not been realized at this location.
Well spring Poklonci (5 wells, 40 L/s each), located at the shores at Lake Krupac, is included in the system only during the summer, when the abundance at the Vidrovan drops to 250–300 L/s. No tank space exists here, so the water is directly distributed into the WSS, through well aggregates.
Distribution network in Nikšić includes the city and several peripheral settlements. A lower pressure zone, located at altitudes of 600–650 m a.s.l., is dominant in WSS, from the aspect of the size of the territory that covers, as well as in terms of the value of the corresponding consumption (95% of the total needs). The second pressure zone has not been consolidated. It is presented with a few isolated areas, located at the elevations above 650 m a.s.l., in which the water is transported from the lower zone, through the appropriate hydrophore stations (there are seven such stations).
Booster pump station “Duklo”: Q = (1 + 1) × 400 L/s, H = 55 m (hereinafter, Duklo BPS) is a central point in WSS, because almost an entire amount of consumption is being distributed into the system by operation of this facility, located on the northwest border of a densely populated urban area.
Water from the Vidrovan source is transported gravitationally to Duklo BPS, through the pipeline φ1000 (length 15 km). Simultaneously, during the summer period, water from the Poklonci source has been placed to the upstream point of Duklo BPS, by 5 km long pressure pipeline φ500. The fact that inlet pipes φ1000 (from Vidrovan source) and φ500 (from Poklonci wells) are directly connected immediately upstream of the Duklo BPS, is of great relevance from the aspect of system operation. Downstream of this point of connection, aggregated amounts of water from two sources is being transported to the Duklo BPS, (through a pipeline φ1000, length 200 m) and to a distribution network further by pumping.
Downstream from Duklo BPS, the most important distribution lines, φ700, φ400, and φ300, were placed along the major urban roads. The system also includes a tank, located on the opposite side of the distribution network with the highest rate of consumption relative to Duklo BPS:
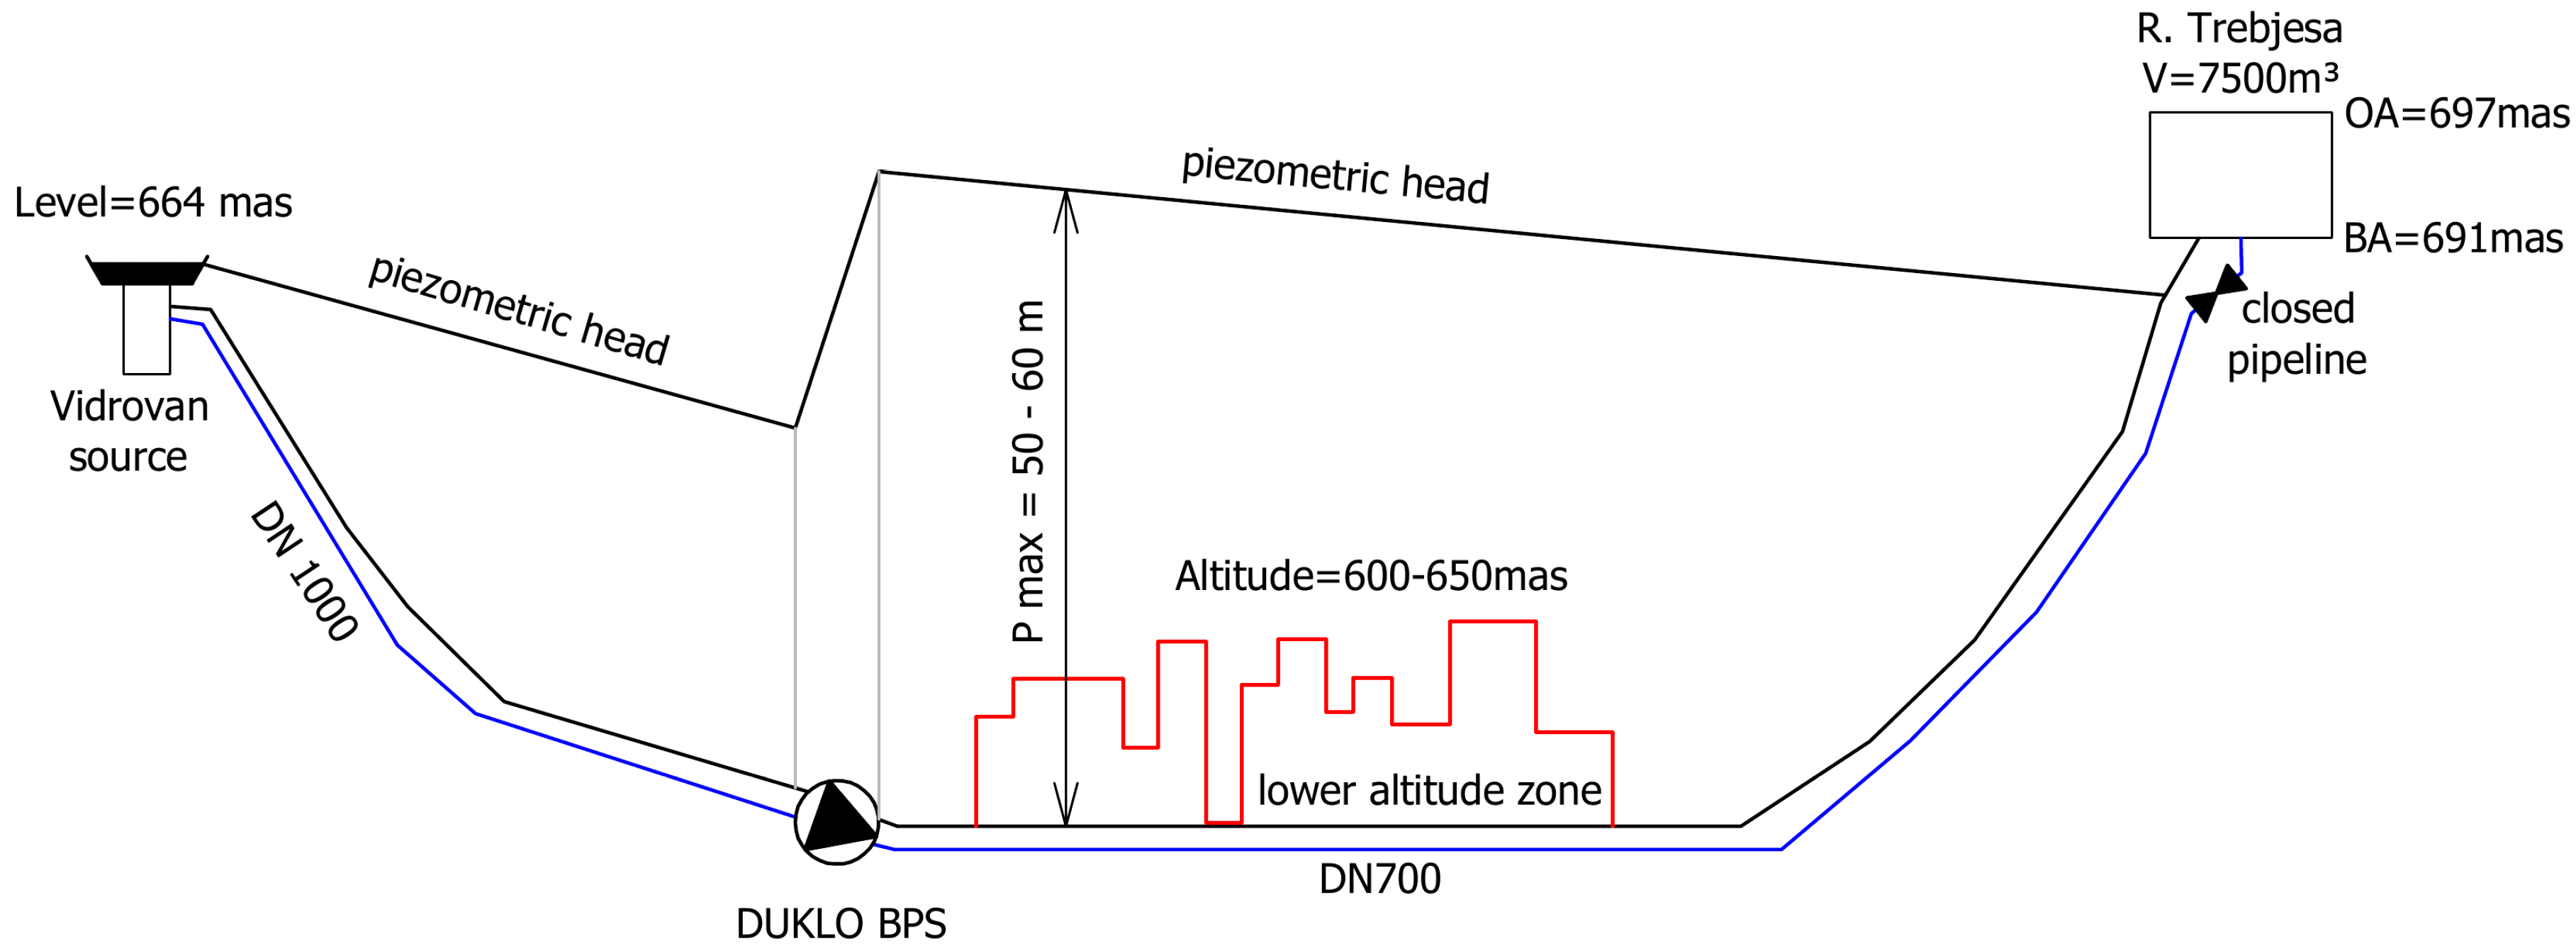
Reservoir “Trebjesa” (R Trebjesa): BA/OA = 691/697 m a.s.l., V = 7500 m3; longitudinal profile from the Vidrovan source to tank Trebjesa, during its operating mode is shown on Figure 1.
R Trebjesa is built on the same named hill, in the southeastern part of the central city area. This facility was initially designed with the role of a counter tank in relation to the piezometric level produced by the work of Duklo BPS. In accordance with this configuration, R Trebjesa was supposed to be fed during the low daily consumption mode (night mode) and to represent another point of supply, during the regime of increased consumption. The purpose of this model of supply is contained in the optimization of the main distribution pipeline diameter. In the conditions, under which water is being placed into the network from two points, mutually located on opposite parts of distribution, needed value of a connecting line decrease, in comparison to the case of supplying from a single point. In this regard, a distribution network on the part that is in the area close to the position of R Trebjesa has been made with reduced diameters.
However, R Trebjesa (7500 m3) was excluded from the system operation, after decades of work. The reason was too high of a position of the structure (695 m a.s.l.) in relation to the distribution network of a lower zone, located at altitudes of 600-650 m a.s.l. Most of the consumption takes place at elevations up to 630 m a.s.l., for which the position of the tank is inappropriately high. To make things worse, its capacity represents half of the required space for the daily consumption unevenness equalization.
After the tank had been excluded from the system operation, the total hourly load of consumption has been covered by the work of Duklo BPS (Figure 2). Under these conditions, the regime of pressures in the WSS has become extremely variable, which was one of the main causes of losses that appeared in the system.
Additional pressure on fluctuations in the WSS has been produced because of the insufficient pipe’s capacity of the individual peripheral parts of the first altitude zone (the part that gravitates to R Trebjesa). In addition to fatigue of the material and significant expenditure of electricity to the Duklo BPS work, some parts of the city have a water deficit in the seasonal consumption peaks.
The average annual production of existing WSS, with included losses, is about QPavyear = 400 L/s. If the average annual consumption without losses can be defined as a total invoice, its value is more than low in comparison to the above value of production: net QCavyear = 125 L/s. By comparing these two values, the average annual share of “losses” in the system is defined as Ploss ≅ 70%.
This percent includes the entire difference between production and billed consumption. So, this value includes physical failures, illegal consumption, and losses caused by problems in billing.
Due to this alarmingly high level of unbilled parts (“losses”), low seasonal and daily unevenness of system production is recorded: QPmaxmonth = 440 L/s, Kmaxmonth = 1.10 and QPmaxday = 480 L/s, Kmaxday = 1.20.
The above expressions have a meaning as follows:
  • QPmaxmonth—the average monthly production in the month of maximum production,
  • QPmaxday—the average daily production in the day of year of maximum production,
  • Kmaxmonth (Kmaxday)—quotients between QPmaxmonth and QPavyear (i.e., QPmaxday and QPavyear).
The total consumption in Nikšić WSS is divided into next three categories, with the values approximately being:
Population: QPOPavyear = 100 L/s (80%); industry: QINDavyear = 20 L/s; and city institutions: QCINavyear = 5 L/s.
By calculating with the number of 65,000 consumers connected to WSS, specific values are:
  • Specific QPOPavyear = 100 L/s × 86,400/65,000 = 133 L/con/day; (in the summer up to 160 L/con/day),
  • Specific QPavyear = 400 L/s × 86,400/65,000 = 532 L/con/day; (in the summer up to 640 L/con/day).
Specific population consumption (per consumer) is not high (133 L/con/day) and is quite uniform through the year, but the opposite conclusion is made regarding the specific production (532 L/con/day).
The attached division to categories of consumers does not include the separation within the category of mass consumption, into subcategories of private and collective housing, which are characterized by significantly different diagrams of unit consumption. This issue is important from the aspect of consumption analysis and, particularly, in terms of hydraulic calculations.
Nikšić has been known as an industrial city (50% of consumption), with a large number of factories and industrial plants, realized after World War II. Rapid industrialization of this settlement had caused its rapid growth, followed by unplanned construction at the peripheral area. Later, during the transition period, much of the industry has been closed, and the industry has decreased a lot of its rate in water consumption (today about 15%). The production of the largest industrial entity in Nikšić-ironworks “Nikšić” has been significantly reduced. The second largest industrial facility-brewery “Nikšić” has developed its own system for capturing and transporting water, based on wells placed within the factory. The fact that the category “population” has a share of 80% in the total system consumption today, and is characterized by low unevenness, further indicates the existence of a significant degree of real losses (even though apparently losses are also very present).

3. Calibration of Nikšić Water Distribution Model

The approach to the process of leak detection was made in accordance with all widely accepted recommendations [4,5,6]. The following preparatory activities have been implemented:
  • System database creation, by usage of the Mapinfo software,
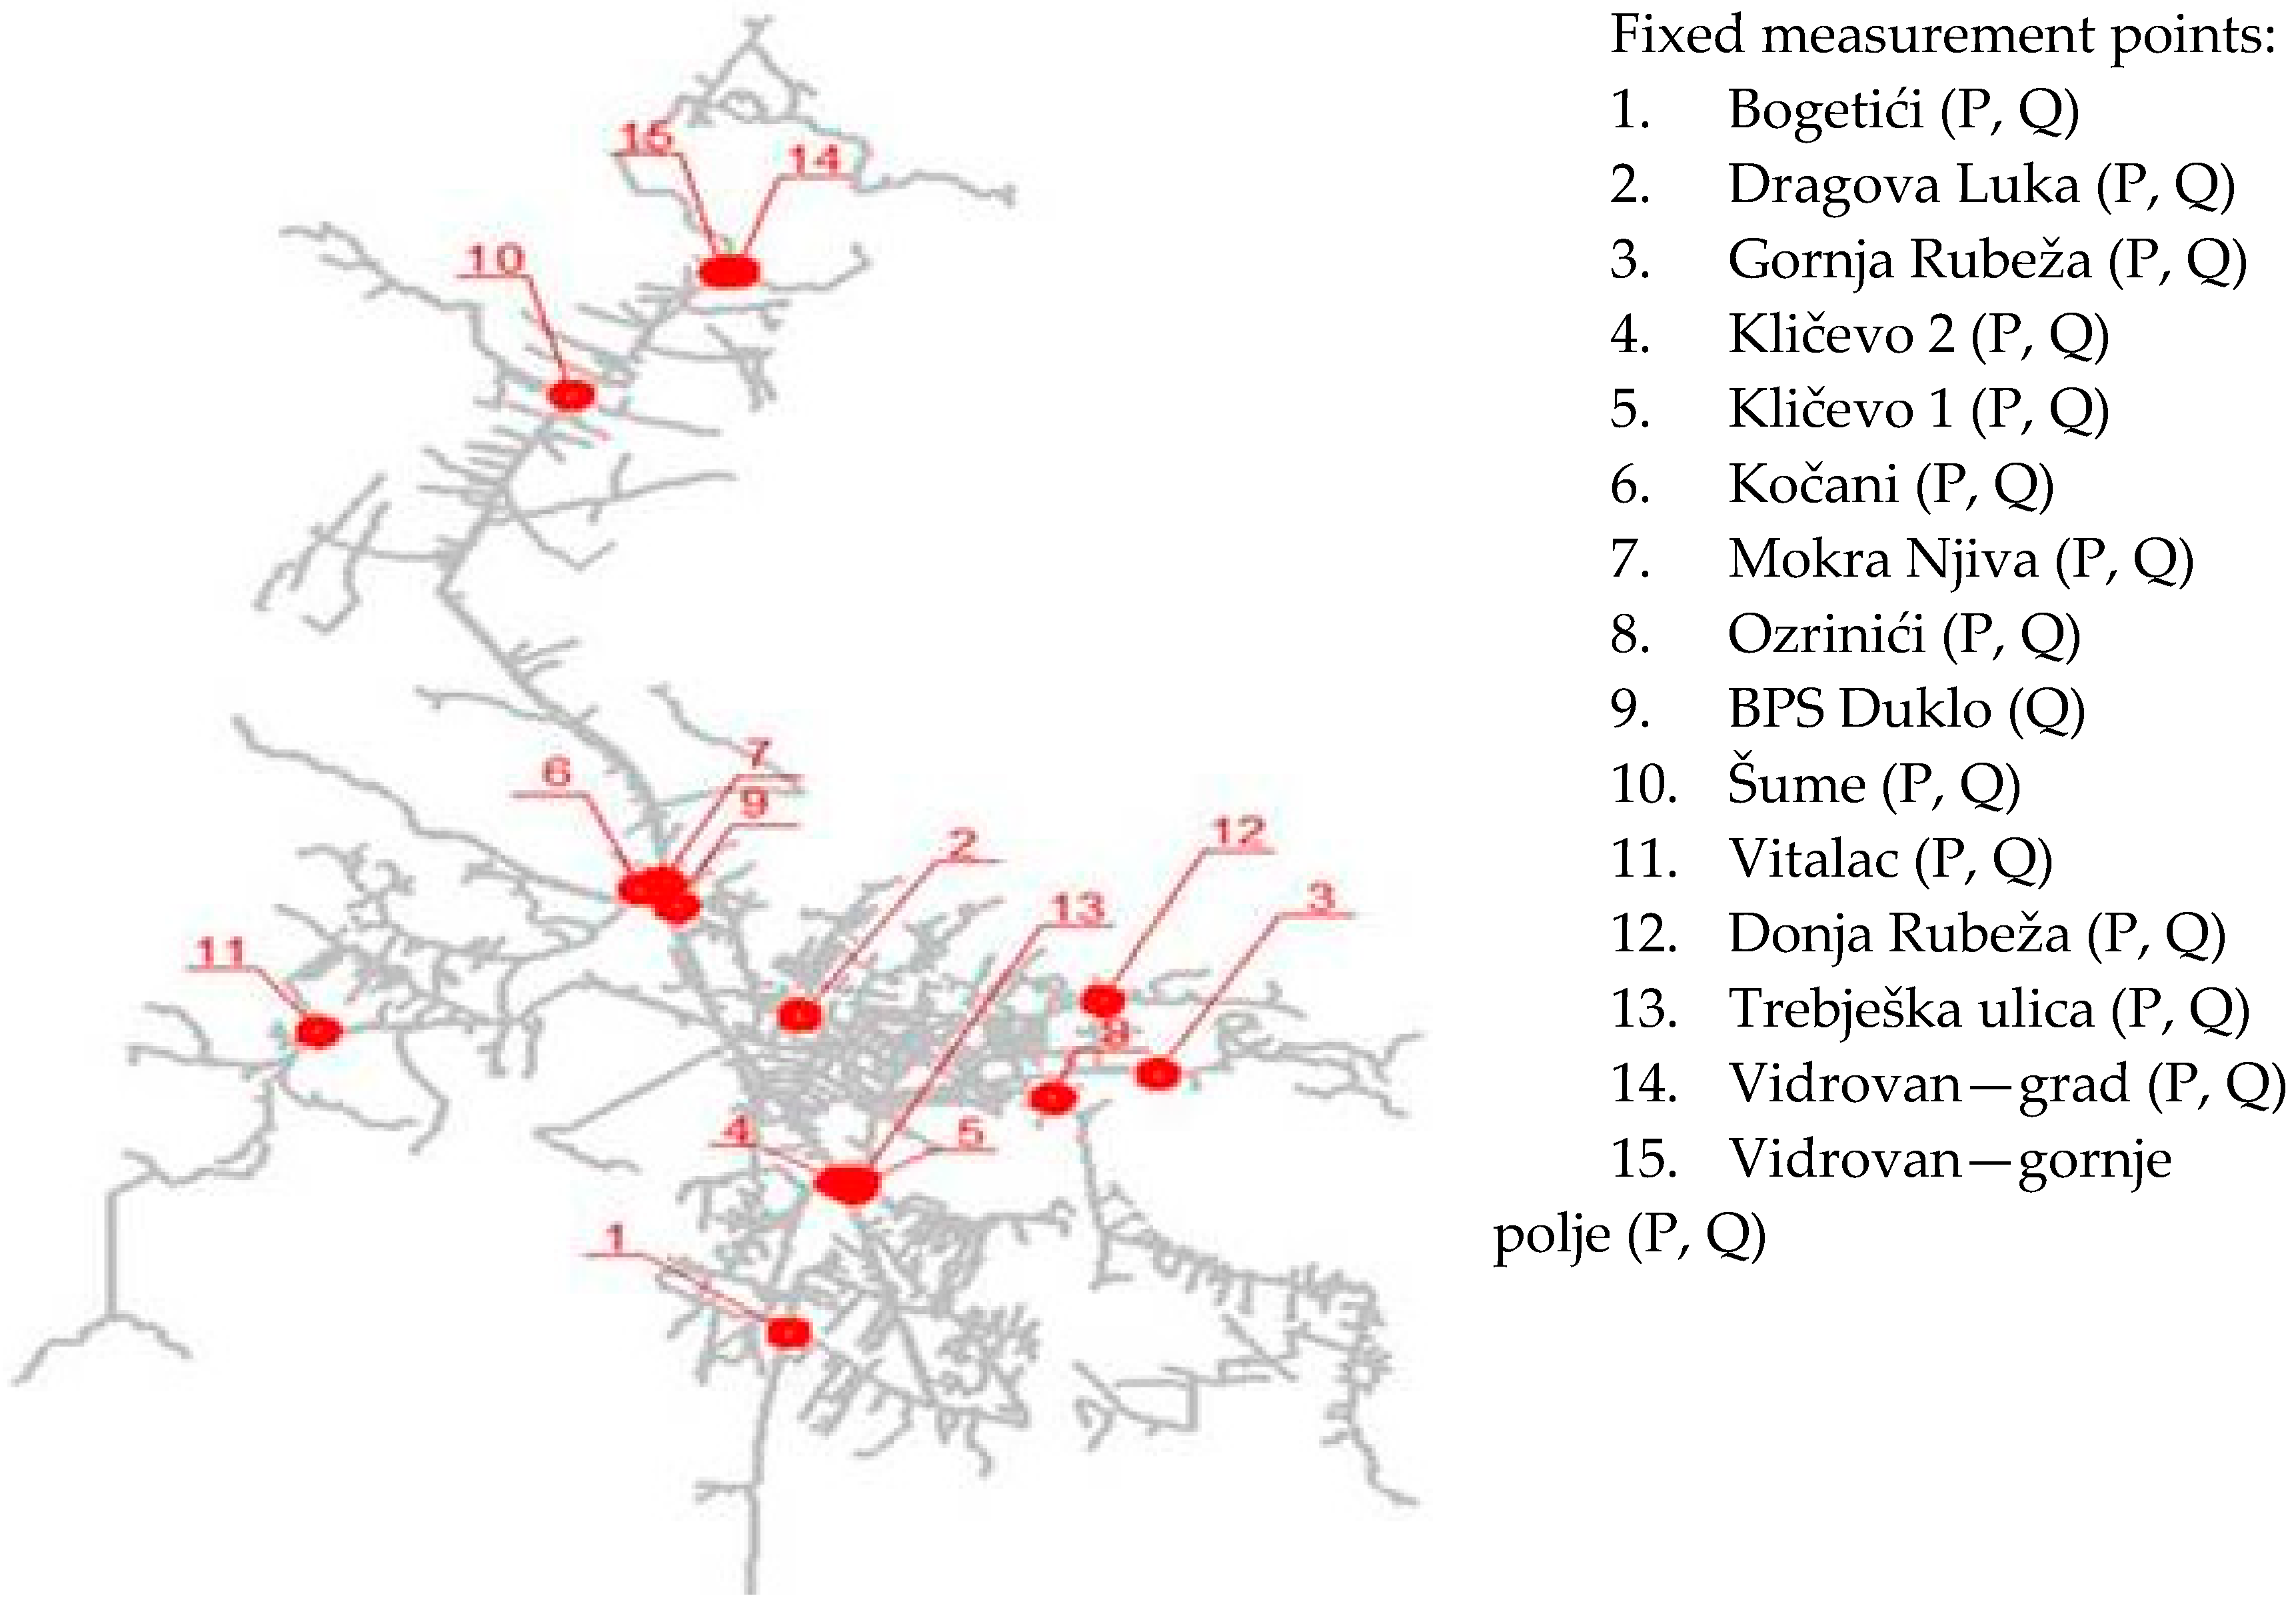
  • Definition of consumption zones in WSS and selection of the measurement’s points (Figure 3),
  • Acquisition of measuring equipment—fixed flow meters and pressure meters and their installation in selected points of the distribution system (fixed measuring points). Procurement of mobile flow/pressure meters and leak detection equipment (aqua phones and correlators),
  • Linkage of the fixed measuring points into a unique system for remote data transfer and installation of appropriate software (SCADA system).
These activities were conducted with the primary goal of establishing control over the system, but they also have represented the initial part for the leakage detection process.
The model of the existing state of the WSS was calibrated during 8 August 2015 (24 h period). In addition to the flow and pressure measurements in the fixed measurement points (calibrated results of a few of them are shown on Figure 4), readings on water meters of the three largest concentrated consumers, as well as the three representative points of mass consumption in the segment of collective housing, were carried out. All readings had been performed on each hour, and later, for the purposes of adapting to the simulation time step (15 min), an appropriate interpolation was made. The calibrated model is a unique diagnostic device, which defines all the advantages and disadvantages of the system.

4. Analysis of the Nikšić WSS Existing State

The main problem from the beginning of Nikšić WSS establishment was the position of the R Trebjesa, which is such that its work produces the pressure in the network of 6–9 bar (Figure 1) in the hydrostatic mode. A decades-long operation of WSS on such a way resulted with the emergence of many defects in the system. In order to reduce the pressure, a few decades ago R Trebjesa was excluded from the system work and pump units at BPS Duklo were replaced with new ones with a smaller value of outlet pressure. It should be emphasized that under conditions where Duklo BPS represents the only vital structure in the network, which has greatly expanded in the meantime, the reduction of pressure could not be drastic. Currently, the system operates with a pressure of 5–6 bar, downstream of BPS Duklo (Figure 2). The main set of systemic current problems is as follows:
  • The transport of almost the entire sum of consumption in WSS through the BPS Duklo (small amounts spent in the area between Vidrovan and BPS Duklo), which inevitably leads to an ever-changing pressure regime. That causes rapid fatigue and represents a source of defects, even at a greater extent, in comparison with the work in a constant high pressure mode. This conceptual problem is absurd, given the existence of the source Vidrovan on a hill (664 m a.s.l.), which enables the comfortable gravity placement into the system (the largest part is between 610 and 630 m a.s.l.).
  • A lack of tank space in the system of 65,000 consumers (R Trebjesa is out of order) for equalizing daily unevenness leads to the use of pumping with all the above-mentioned adverse effects.
  • The mutual damping of flows from two sources (Vidrovan and Poklonci), which occurs due to the pipelines (φ1000 and φ500) that transport water from these two sources to the BPS Duklo, is directly connected to each other, immediately upstream of the BPS Duklo.
  • The appearance of flow with an incomplete profile in the main pipeline Vidrovan—BPS Duklo (φ1000, L = 15 km), which happens due to the source capacity decrease in the summer months. In that period, the piezometric level is much lower than the Vidrovan elevation (664 m. a.s.l.) and causes the work of BPS Duklo to be in a higher pressure and lower flow regime.
Some secondary problems (in comparison with the main described) were also detected that were related to the insufficient traffic capacity of some parts of the network and with an inadequate choice of pumps in some of the existing hydrophores. It is very advisable to wait with them before solving the conceptual problems.

5. Proposed System Concept Alteration and Conclusions

The proposed solution, which will dramatically change the concept of the system work and achieve the objectives, is contained in the implementation of the following measures:
  • Construction of the Vidrovan tank (R Vidrovan, BA/OA = 659/664 m a.s.l., V = 1800 m3), on the source location, aimed to establish the flow with a full profile on the whole length of the appropriate inlet pipeline φ1000. This will also provide needed space for leveling the unevenness of consumption (net demand 15 L/s) of those consumers between the Vidrovan source and BPS Duklo;
  • Construction of the Uzdomir tank (R Uzdomir, BA/OA = 650/654, V = 5500 m3) on the slopes of the Uzdomir hill, near the downstream parts of supplying pipelines φ1000 and φ500, from two system sources. This conceptual measure also includes the construction of the connecting pipelines φ1000 and φ500 from R Uzdomir to the downstream parts of the existing inlets φ1000 and φ500. These measures will enable the full use of existing sources and eliminate damping. Moreover, R Uzdomir will be located at the elevation that is appropriate for the supply of a part of the lower altitude zone at the central city area (to which belongs half the city’s consumption), located below 630 m a.s.l.
  • Separation of the lower central subzone, which will be under R Uzdomir influence, from the rest of the network. This measure should be easily carried out and conducted by the use of on/off valves in the system (majority of them already exist). This measure, contained in subzoning, will enable the production of regular, but significantly lower, pressure (2–4 bars) in the central city area (Figure 5).
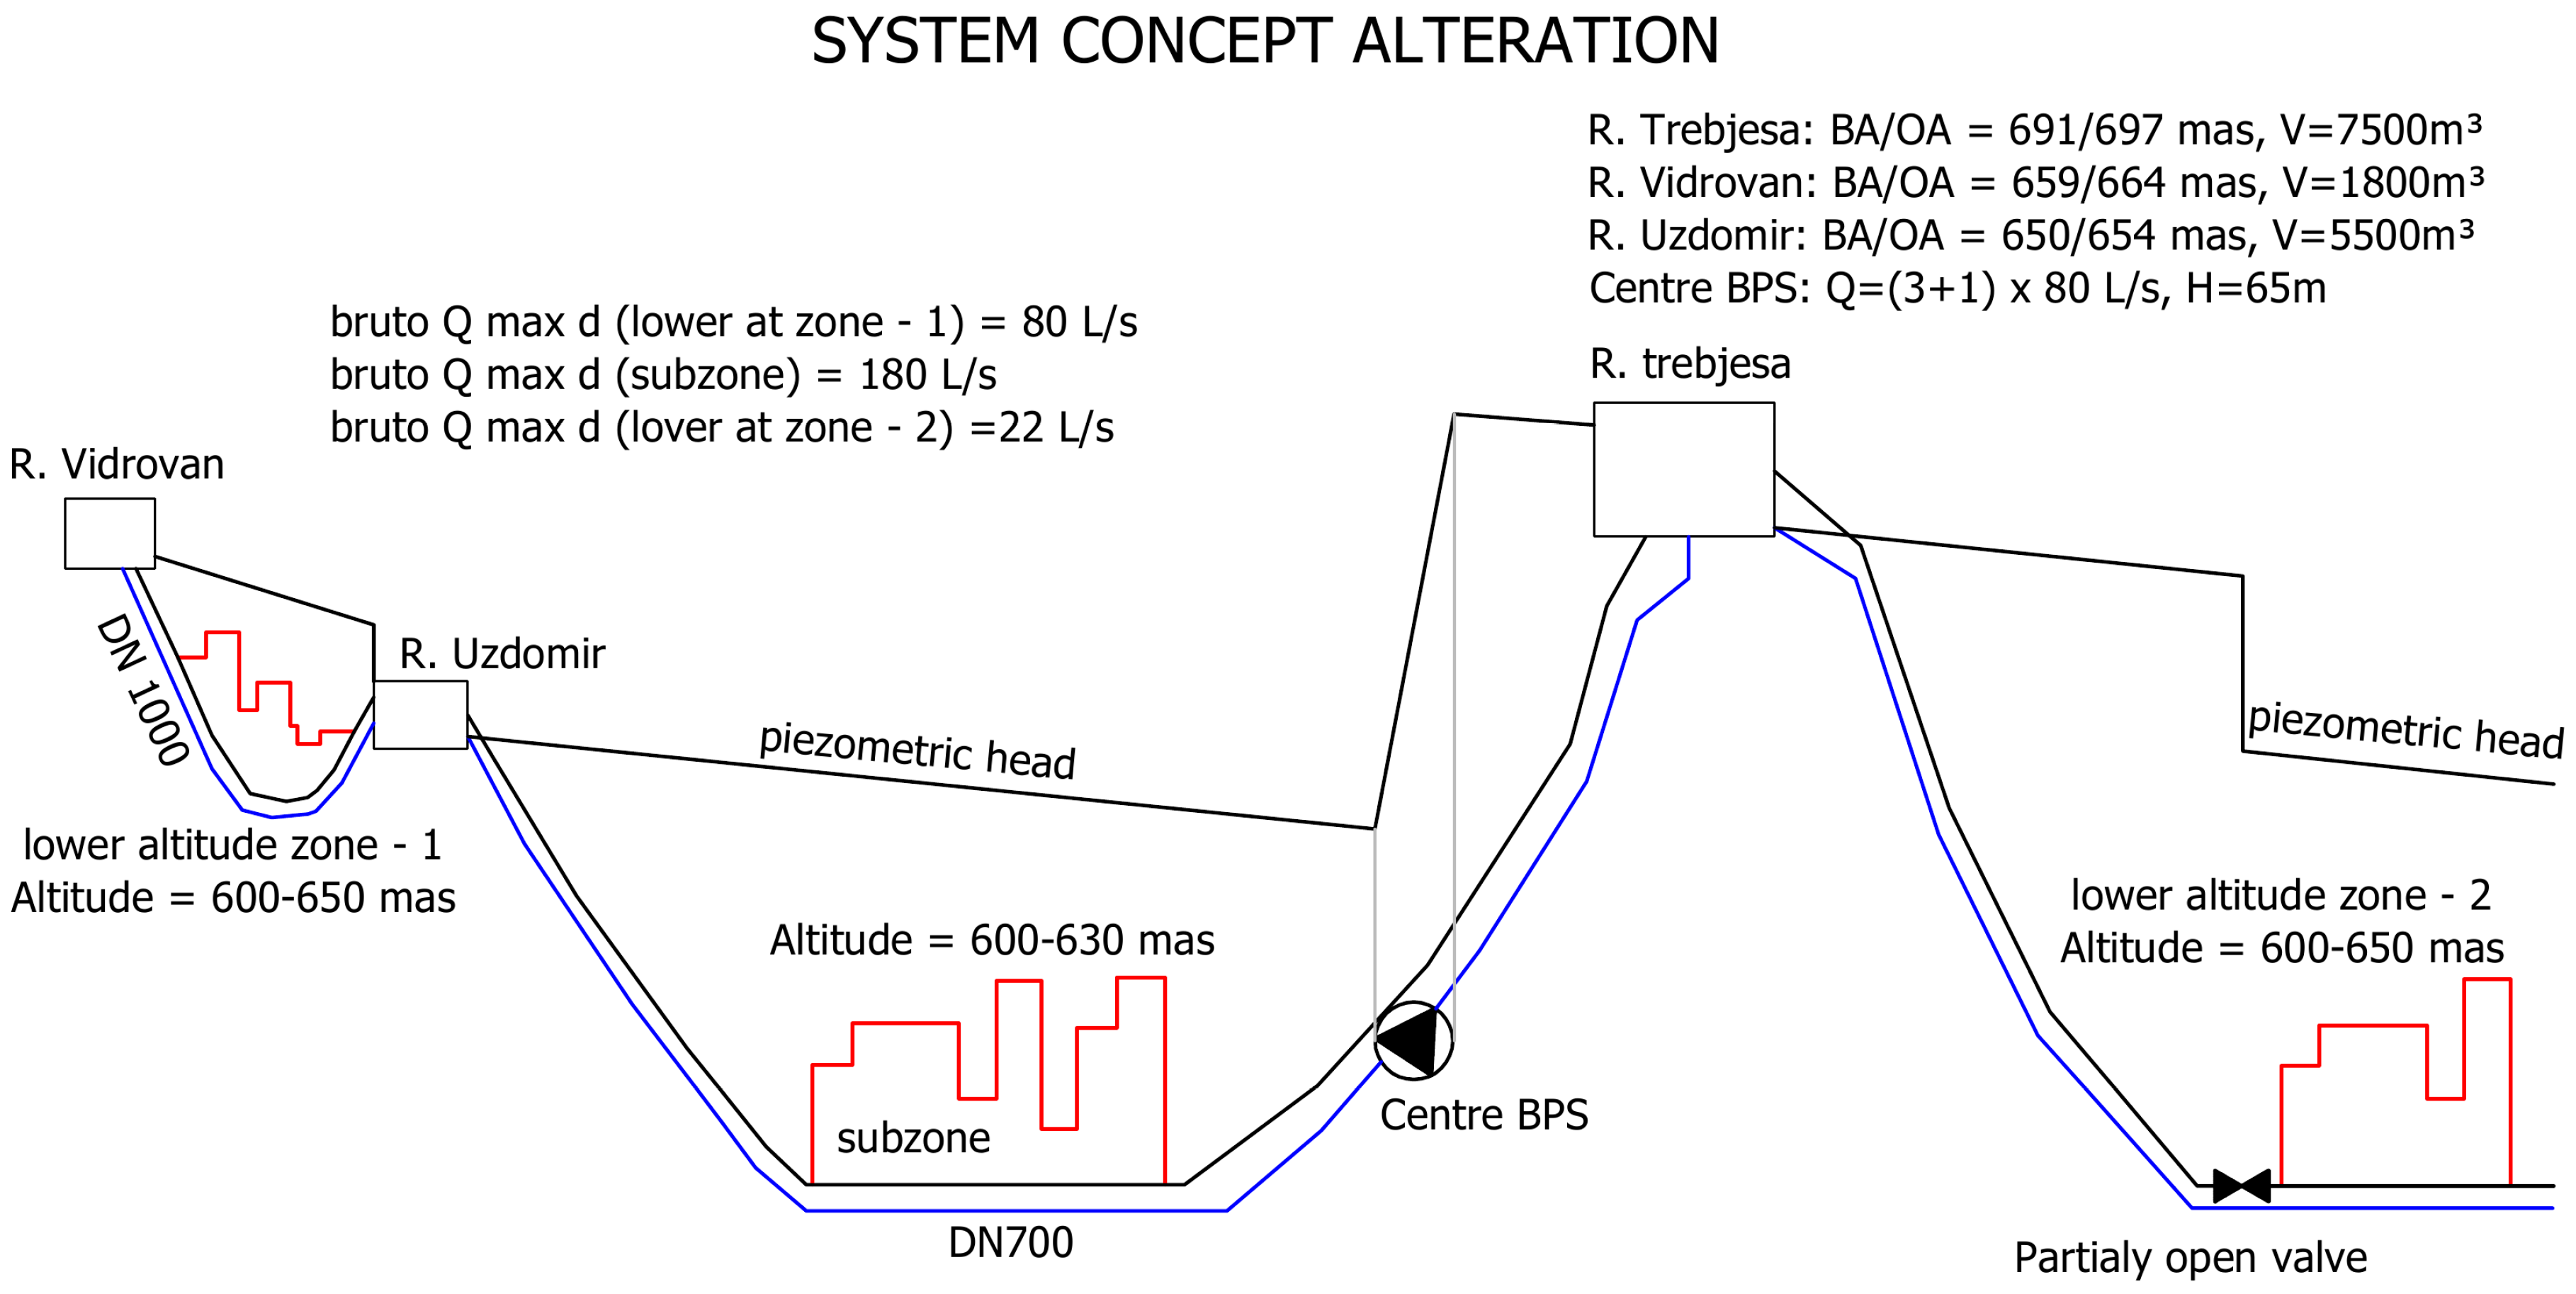
Figure 5. General system longitudinal profile after realization of the concept alteration.
Environsciproc 02 00037 g005
  • Realization of booster pump station BPS Centre: (Q = (3 + 1) × 80 L/s, H = 65 m), below the Trebjesa hill, which will allow transport of excess water during the night from the central area to R Trebjesa. Water, accumulated in the R Uzdomir (400 L/s at the level of today’s average production), will be placed gravitationally into the central subzone. After satisfying consumption in the central area (about half of the production), the remaining part will be transported to R Trebjesa, through the BS Center (also about 200 L/s).
  • With installation of a pressure reducing valve at the entrance to each of the peripheral zones of consumption—R Trebjesa will be activated as a distribution tank for the peripheral part of the system, which will be separated from the central subzone (high people density area with R Uzdomir as a vital facility) by the closing on/off valves in the network (Figure 6). The future area, where R Trebjesa will be activated as a vital structure, will cover a much greater surface, but the water amount of consumption is similar—about 200 L/s in each. In that way the central area will be out of the R Trebjesa impact where such an approach is quite difficult due to the presence of a multi-ring network and basically a two-way flow of water. Some areas under the future R Trebjesa covering are already zoned with a single entrance and, generally, a one-way flow of water.
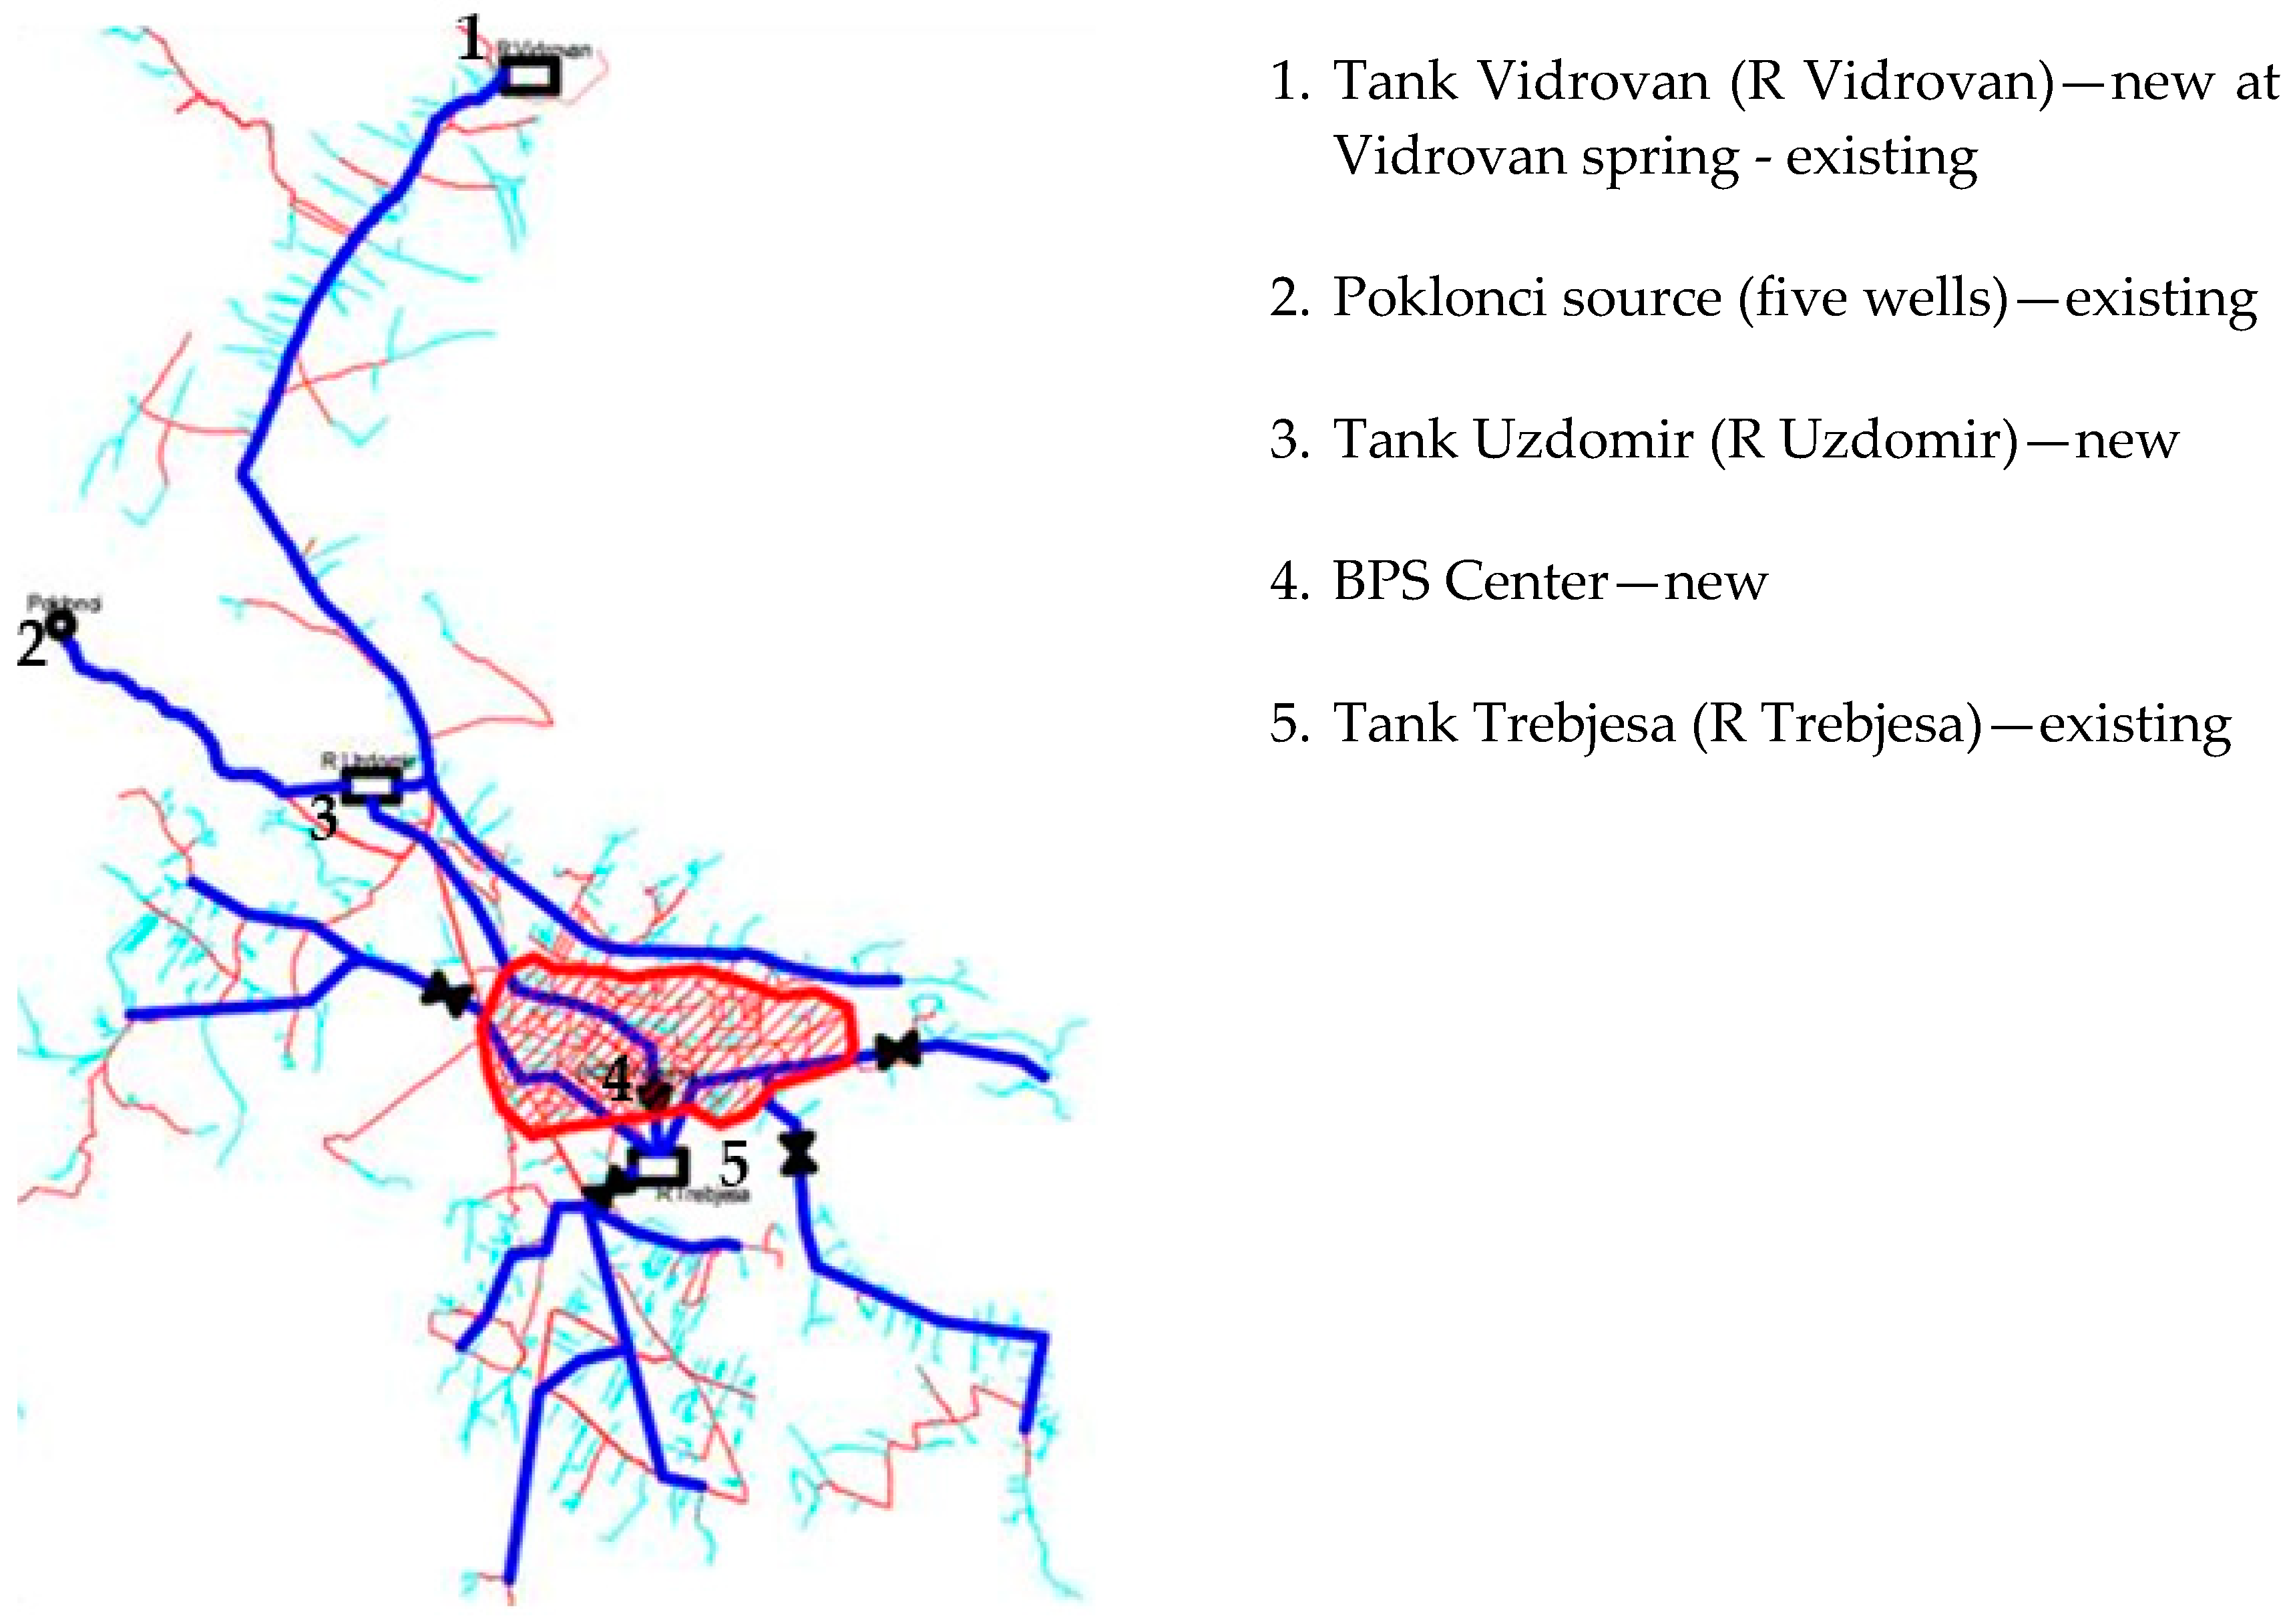
Figure 6. Central subzone (red net) and the position of the main structure in Nikšić WSS after realization of the concept alteration.
Environsciproc 02 00037 g006
  • Proposed measures will allow both lower pressures in all parts of the system and good subzoning of the whole network. That will further allow more successful leakage detection in the subzones, and generally better loss control in the WSS.
  • Exclusion of BPS Duklo from the operating mode—realization of the described measures will eliminate the need for its regular work. Duklo BPS will stay only in terms of securing the hot reserve in WSS.
Realization of the described above measures will achieve the following positive effects:
  • Gravitation as a dominant mode of flow in the distribution system will be established, which will be followed by a stable pressure regime and, in total, a significantly higher level of service,
  • Significant pressure reduction in the network (a lower operating level—produced by the presence of R Uzdomir in the central subzone). The reduction of pressure, produced by an inlet from R Trebjesa, will be realized at the entrance to each of the peripheral zones (Figure 5),
  • The only reservoir capacity in the existing system will be activated, and WSS will be operating with enough capacity for equalization of consumption unevenness,
  • The available source capacity will be used to its full extent and according to the actual needs,
  • The reasons that produce systemic failure will be eliminated—the implementation of the proposed measures represents a showdown with the causes of defects and they are not designed as a simple recovery of consequences.
It is emphasized that the solution with the closed valves (Figure 6), located at the border line between areas of the R Trebjesa influence and central subzone (R Uzdomir covering), although unusual, seems to be very flexible. In accordance with the possible changes of the consumption amount in WSS, and with the hopefully significant decrease of losses, the real value of needs in each subzone of the system will change. This will likely produce the consumption rate change between these two areas (covering by two tanks) of the future system network. However, in accordance with the actual situation in the system, if it would be necessary, the separation line between the two subzones could be easy to move—by simple manipulation of existing valves in the network.
It is shown that the operating mode of Nikšić WSS is critical, not only from the point of occurrence of an alarmingly high level of losses. The described measures, aimed at redefining the flow concept of the system, are very small in terms of cost and time of implementation compared to the expected corresponding profit.

Author Contributions

All authors have read and agreed to the published version of the manuscript. The author and first co-author wrote the paper, while the second and third co-author gave relevant data and checked the paper.

Funding

This research has been funded by IPA funds for the Adrian-Ionian region, through the DrinkAdria Project.

Acknowledgments

To the International Project DrinkAdria (2013–2016), funded by EU IPA funds.

Conflicts of Interest

The authors declare no conflict of interest.

References

  1. Pilot Areas and Papers for DRINKADRIA EU Project 2013–2016. 2016. Available online: https://www.researchgate.net/project/DRINKADRIA-http-wwwdrinkadriaeu-project (accessed on 30 August 2020).
  2. DRINKADRIA Shared Platform. Available online: http://drinkadria.fgg.uni-lj.si/ (accessed on 30 August 2020).
  3. Kanakoudis, V.; Tsitsifli, S.; Papadopoulou, A.; Curk, B.C.; Karleusa, B. Estimating the Water Resources Vulnerability Index in the Adriatic Sea Region. Procedia Eng. 2016, 62, 476–485. Available online: http://www.sciencedirect.com/science/article/pii/S1877705816334002 (accessed on 30 August 2020). [CrossRef]
  4. UN Water. Capacity Development for Drinking Water Loss Reduction: Challenges and Experiences; August Dreesbach Verlag: München, Germany, 2011; ISBN 978-3-940061-51-5. [Google Scholar]
  5. Federal ministry for economic cooperation and development, Guidelines for water loss reduction.
  6. Radivojević, D. Tehnički Pokazatelji za Ocenu Stanja i Predlog Mera za Unapređenje Uspešnosti Funkcionisanja Manjih Vodovodnih Sistema u Republici Srbiji, Doktorska Disertacija, On Serbian. 2013. Available online: http://nardus.mpn.gov.rs/handle/123456789/3848 (accessed on 30 August 2020).
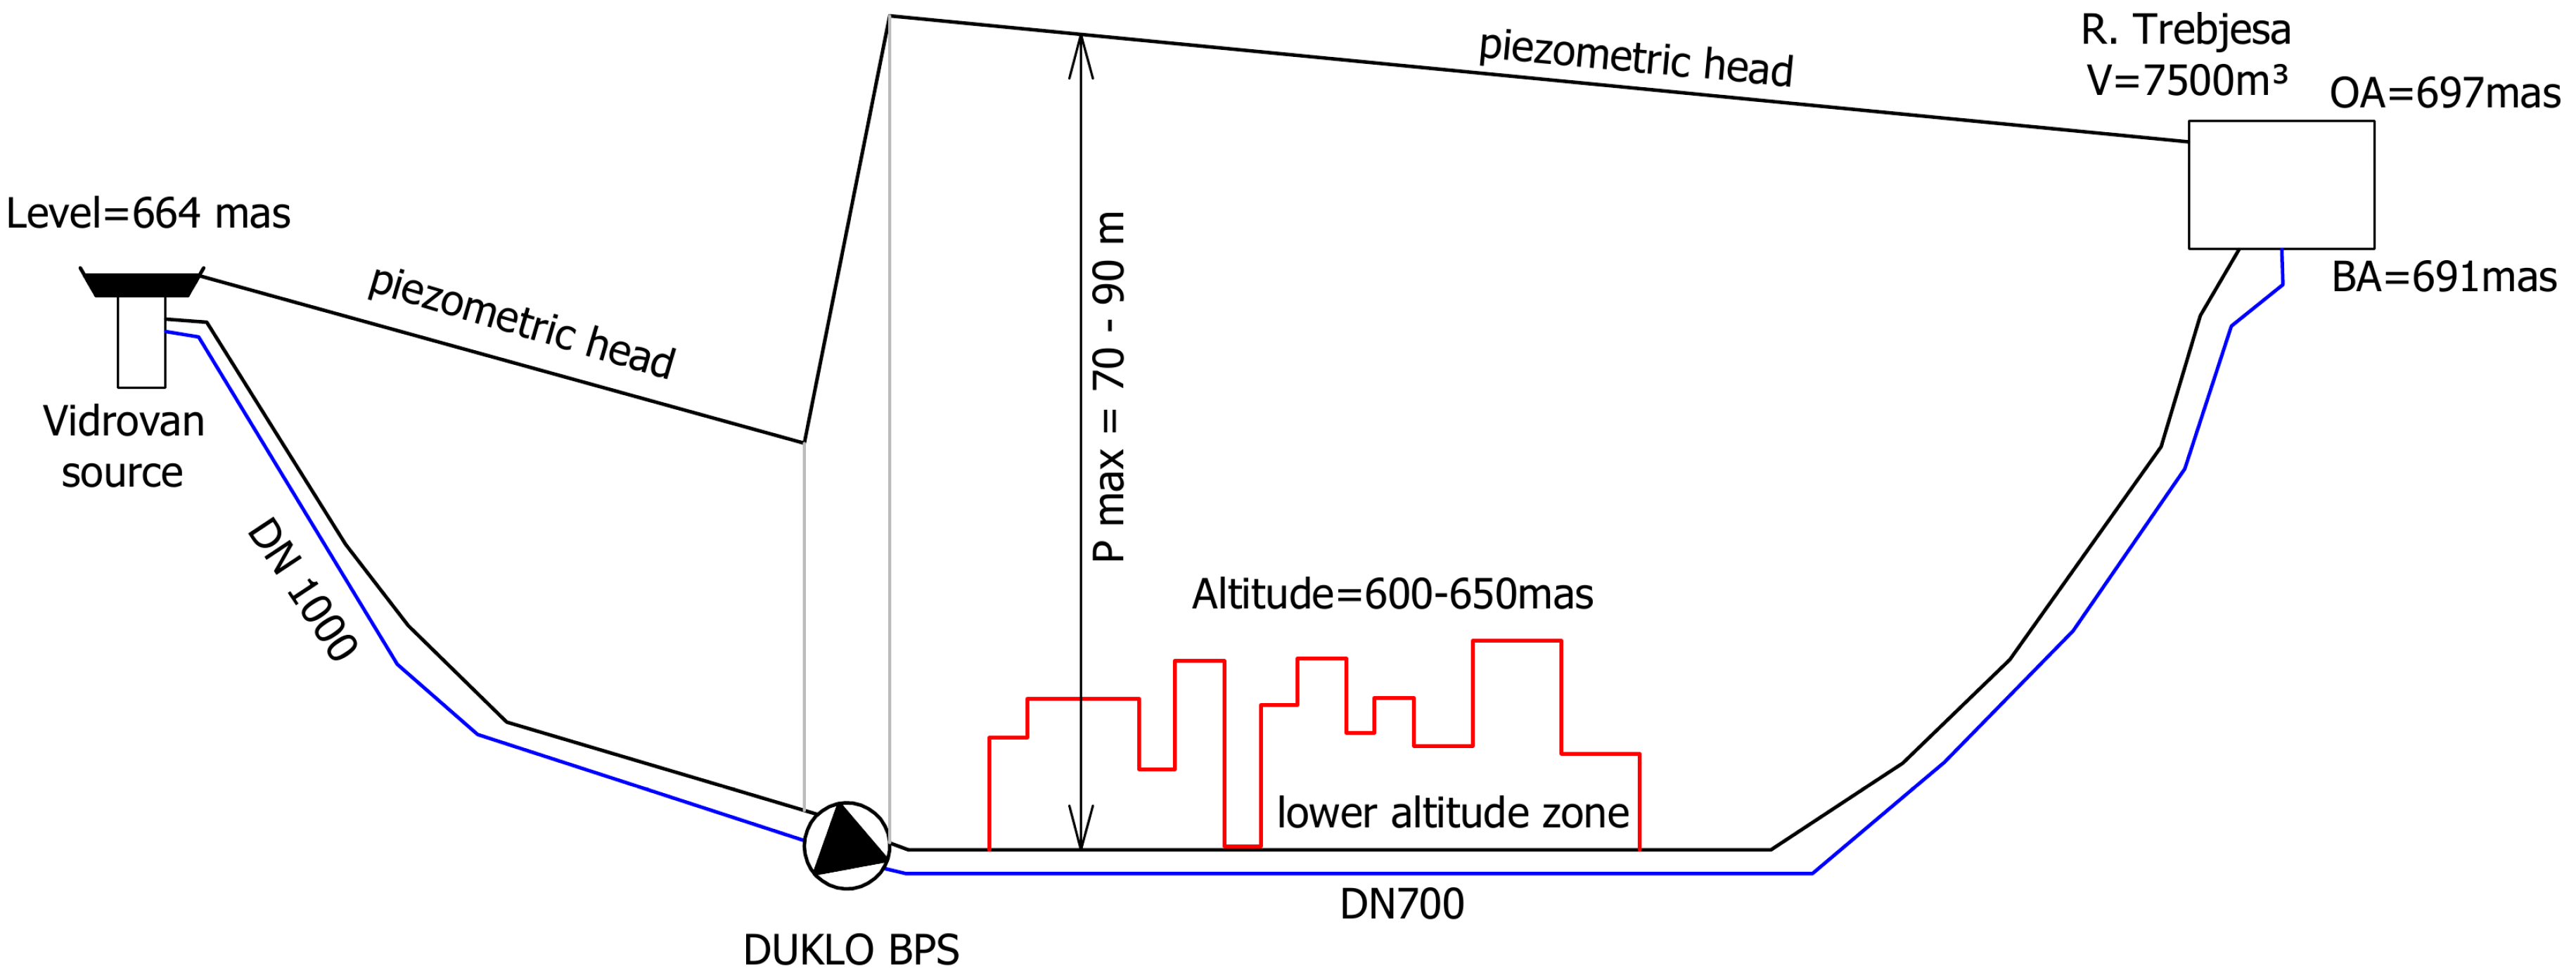
Figure 1. Longitudinal profile from the Vidrovan source to tank Trebjesa (R Trebjesa in the operating mode).
Environsciproc 02 00037 g001
Figure 2. Longitudinal profile from the Vidrovan source to tank Trebjesa (R Trebjesa out of order).
Environsciproc 02 00037 g002
Figure 3. Nikšić water supply system (WSS)—measurement points for the purpose of calibration.
Environsciproc 02 00037 g003
Figure 4. Results of calibration on the few measurement points.
Environsciproc 02 00037 g004
Publisher’s Note: MDPI stays neutral with regard to jurisdictional claims in published maps and institutional affiliations.