1. Introduction
Today, a planet in which the whole electric energy demand is completely satisfied by renewable energy technologies is still chimeric and difficult to imagine. For instance, in 2017, the world gross electricity production from renewables accounted for only 25.3% of the total [
1]. However, probably, we are already on the right path. Jacobson et al. [
2] presented energy transition roadmaps to 2050 for 139 countries of the world. These roadmaps, less aggressive than those of the Paris agreement, are technically and economically feasible, with the aim to electrify all energy sectors and generate all electricity from 100% wind, water, and solar power. On this topic, Singer et al., in collaboration with WWF [
3], showed that such a transition would be not only possible but also cost-effective, providing energy that is affordable for all and producing it in ways that can be sustained by the global economy and the planet.
Among the various renewable energy sources, the hydro-electric sector maintains a respectable position. Hydropower supplies around 16% of the world’s electricity, a share that has remained stable since the 1990s. Most larger projects under construction today are located in developing countries where the hydro potential is unexploited and the power demand is increasing [
4]. An interesting and promising perspective is related to small and mini hydropower plants. Specifically, an opportunity is represented nowadays by the possibility to insert a turbine into an existing water distribution network (WDN) for energy recovery, where an excess of pressure is available and, actually, in many cases, is wasted by using pressure reduction valves (PRVs) [
5]. Several studies and efforts have been carried out on this theme [
6,
7,
8,
9,
10,
11] with promising results, which highlighted the technical feasibility of this technology and the return in terms of the recovered energy and economic viability of the investment. Generally, the collection of reliable information about the costs and benefits of a specific renewable energy technology is an essential phase in the assessment of the most appropriate renewable energy technology to be used. In distributed generation, pumps as turbines (PaTs), thanks to their very low cost compared with conventional turbines, represent an irrefutable opportunity to recover energy from unconventional energy sources. However, despite promising results, currently, installations of PaTs in real WDNs are rare due to the lack of information provided by pump manufacturers, which do not usually test their machine in reverse mode. For this reason, water management authorities prefer to install a PRV to reduce and control water pressure in the system rather than a PaT. From this perspective, this paper summarizes the results of previous studies [
6,
7,
8] about the possibility to substitute existing PRVs with PaTs for two Italian case studies in order to convert the excess pressure into energy, with a careful techno-economic analysis.
2. PaT Selection
Nowadays, there are still some limits of this technology due to the absence of technical information provided by pump manufacturers about their machines operating under reverse mode, since this would require pump testing also in turbine mode operation. For this reason, a significant contribution can be found in the technical literature on the prediction of PaT performance with theoretical [
12,
13,
14] and experimental approaches [
15,
16,
17,
18,
19,
20]. For the sake of clarity, the best efficiency point (BEP) parameters in turbine mode (BEP
T) are quite different from those in pump mode (BEP
P). The common aim in all these studies is to develop models which are able to predict the BEP
T by determining the BEP
P, obtained from the manufacturer catalogue. The relationships between the parameters at both BEPs are usually given in terms of head,
, and flow rate,
, conversion factors, as stated in Equations (1) and (2):
Stefanizzi et al. [
7] proposed a methodology to select the most suitable pump to install and to be used as a turbine in a WDN. When the daily flow rate and pressure patterns of a WDN are known, it is possible to define the design operating conditions and consequently the BEP
T (
vs.
) and the machine specific speed (
). Starting from these data, it is possible to estimate the BEP
P (
vs.
) in order to select the pump from any commercial pump catalogue. This can be done by applying the empirical model proposed by Stefanizzi et al. [
19], obtained by a literature survey that summarized the performance of 27 pumps operating at a wide range of specific speeds
. The model is based on empirical correlations that allow the prediction of the BEP
P in pump mode as a function of the BEP
T. From the BEP
T (
vs.
), the specific speed in turbine mode of the turbine,
, then is obtained. Knowing
, it is possible to estimate
by applying Equation (3):
Subsequently, the head ratio,
, can be evaluated as a function of
by means of a further correlation (Equation (4)). Hence, the head and flow rate in pump mode can be calculated respectively by using the definitions of the head ratio,
, and the specific speed,
(Equations (5) and (6)).
Knowing , , and , any pump manufacturer can then select the machine from its catalogue. At this point, having no experimental characteristic curves of the selected pump operating as a turbine, it is possible to predict its characteristic curve in reverse mode by applying a performance prediction model, as proposed in a previous work [0], considering detailed geometric information on the machine (only in possession of the manufactures).
In the following, the results of the above-mentioned methodology are summarized.
3. Case Studies
The WDNs of two towns in the Apulia region (Southern Italy) have been used as case studies, with the aim to select PaTs that are useful for energy recovery. In the following, these WDNs are indicated as Murgia Network and Central Apulia Network.
3.1. Murgia Network WDN
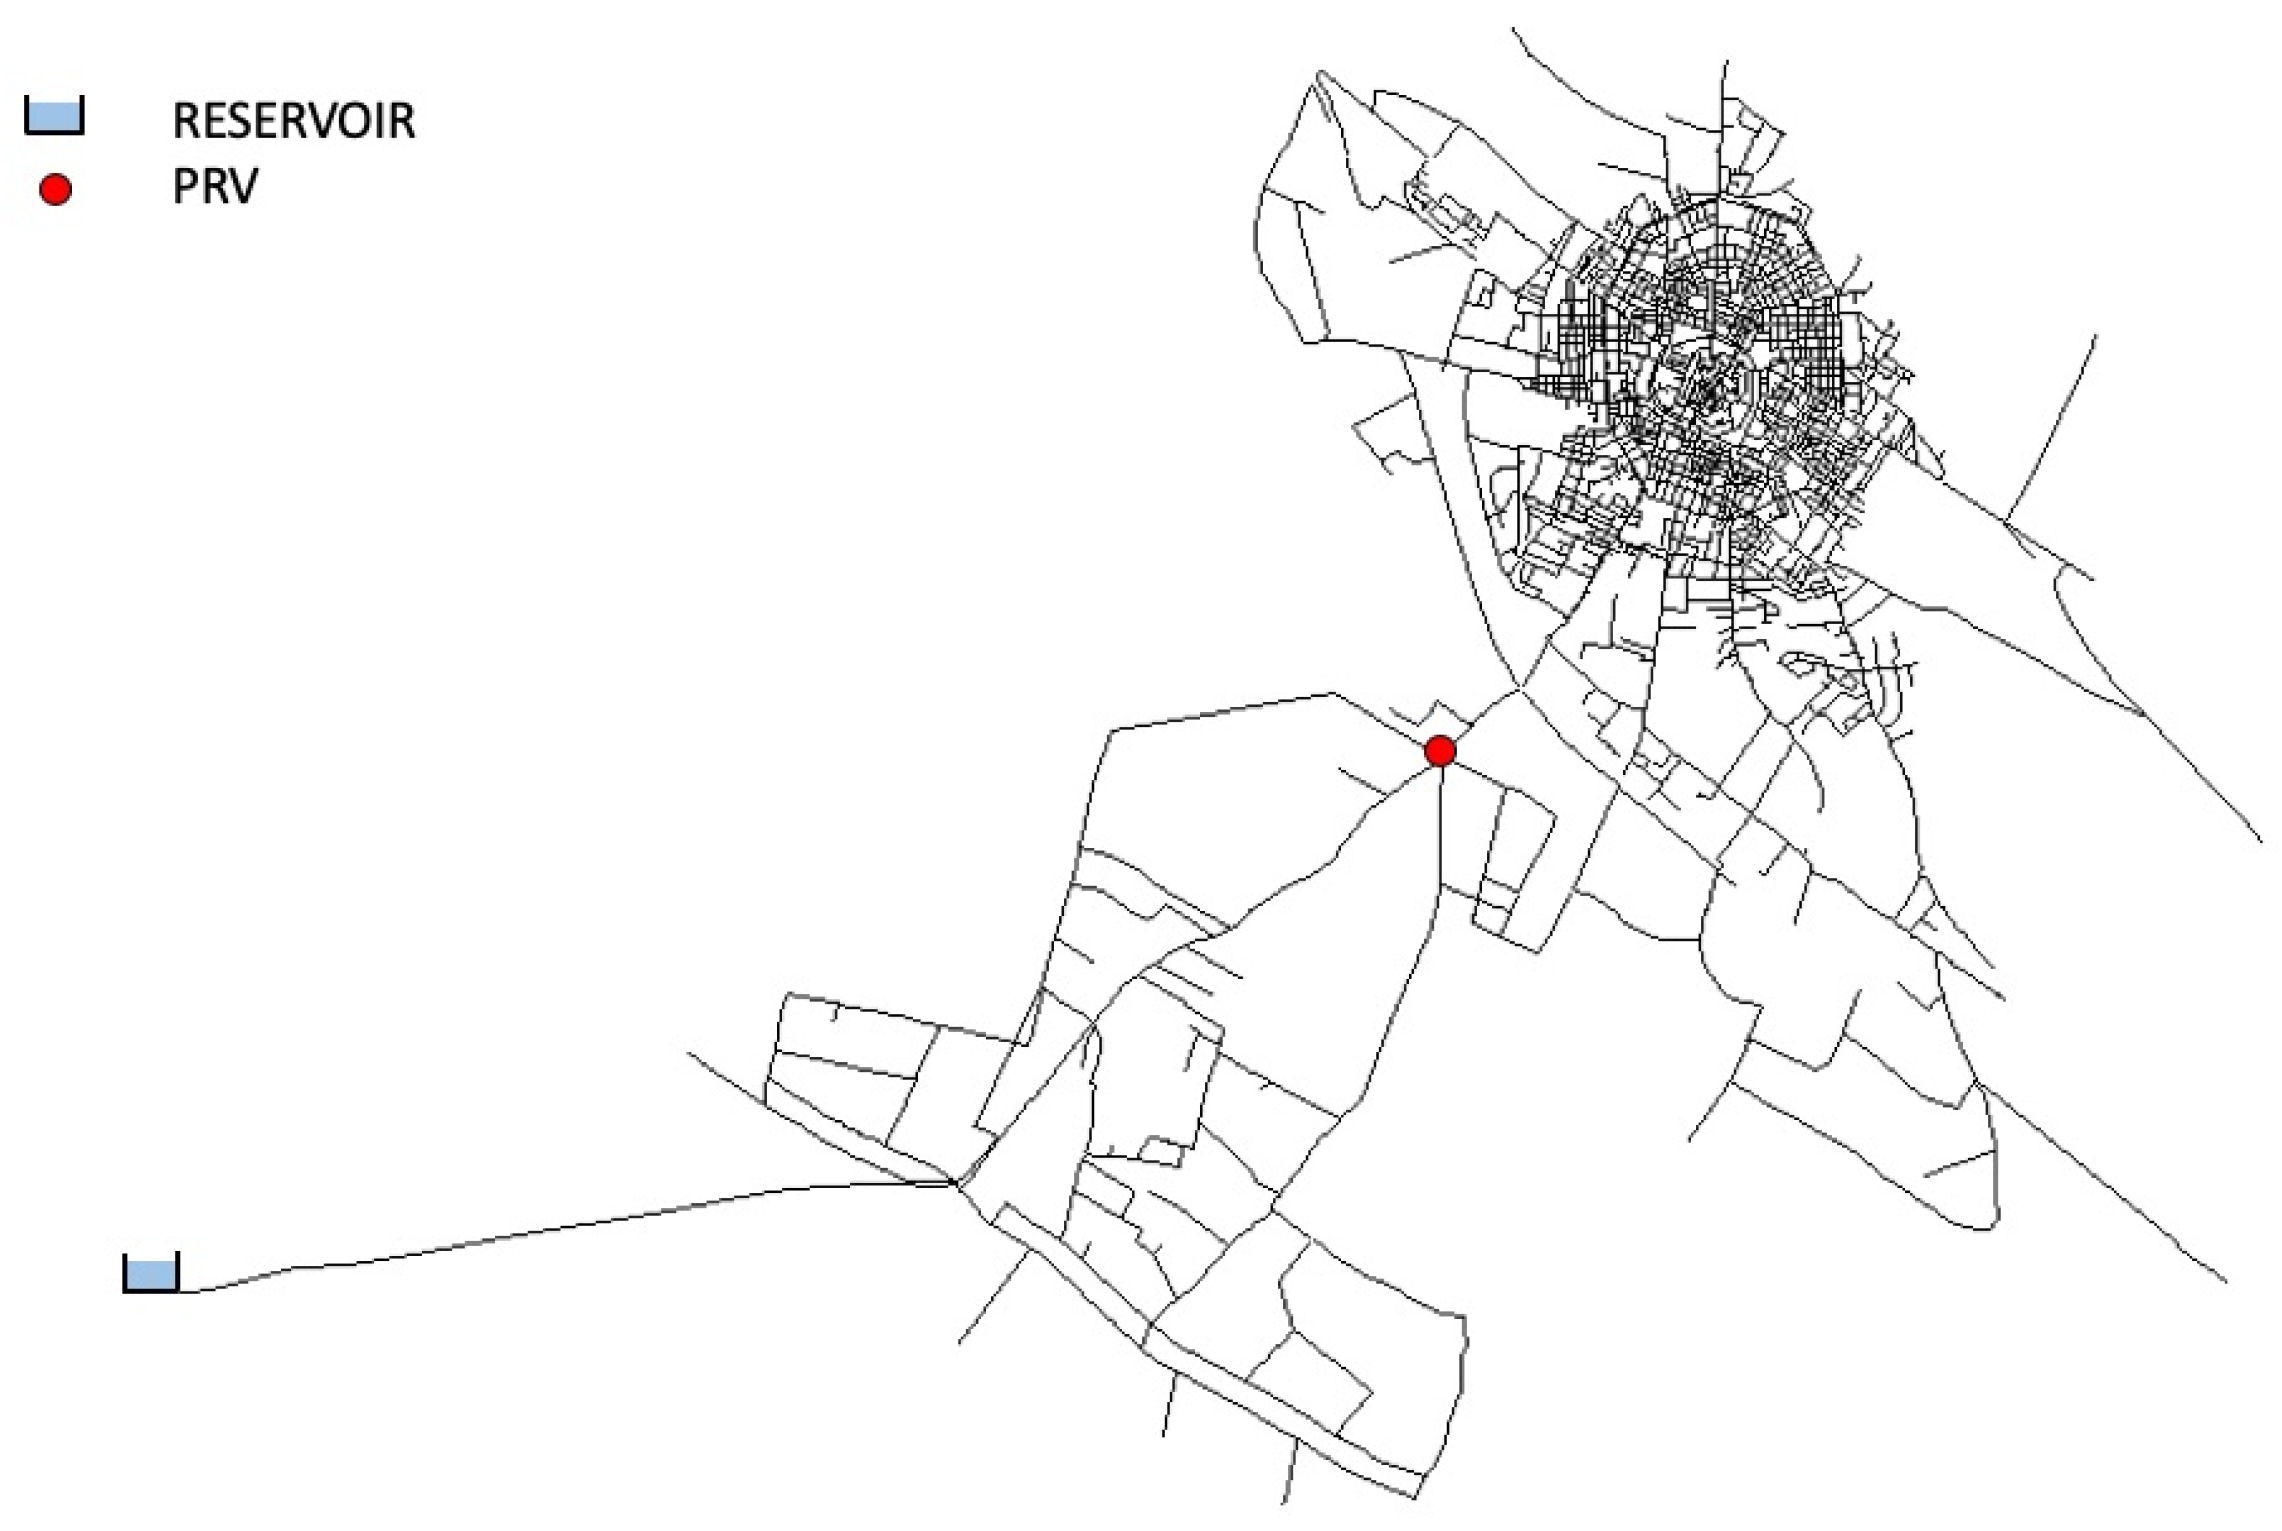
The first, called Murgia Network
, counts approximately 50,000 inhabitants and it is supplied by a unique reservoir. As shown in
Figure 1, the PRV was installed at the entrance of the town, precisely at the origin of the water distribution network, downstream of a small, built-up area. Actually, the water management authority applied a double regulation in order to guarantee the necessary daily water demand and to reduce leakages.
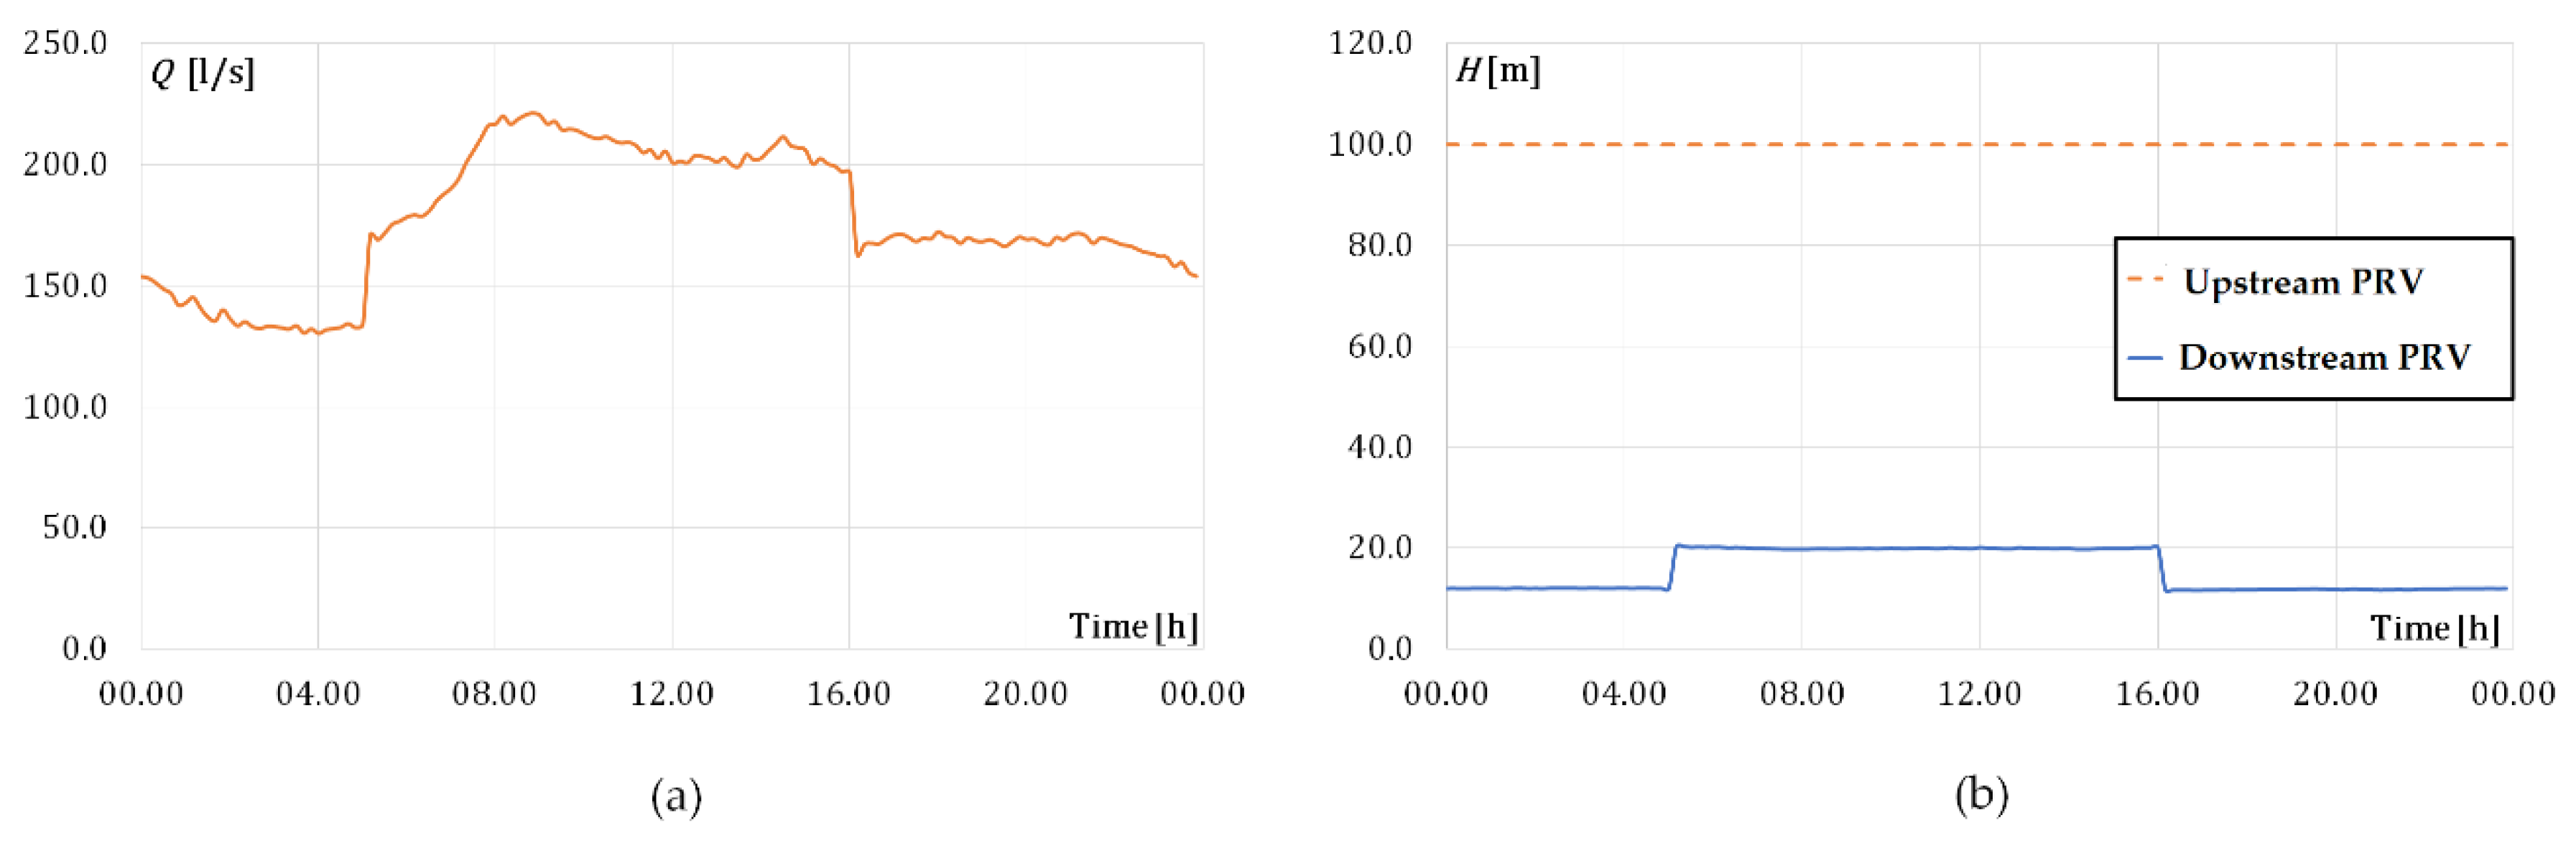
Figure 2 reports the flow rate values and pressure pattern measured downstream of the tank and downstream of the PRV in a typical day. During the daytime, the WDN is characterized by an available pressure drop of around 80 m, whereas during the night, the available pressure drop is higher, approximately 90 m, since, by night, the pressure in the WDN can be lowered in order to reduce leakages. Observing
Figure 2b, it is clear that around 80% of the water head is dissipated by the PRV.
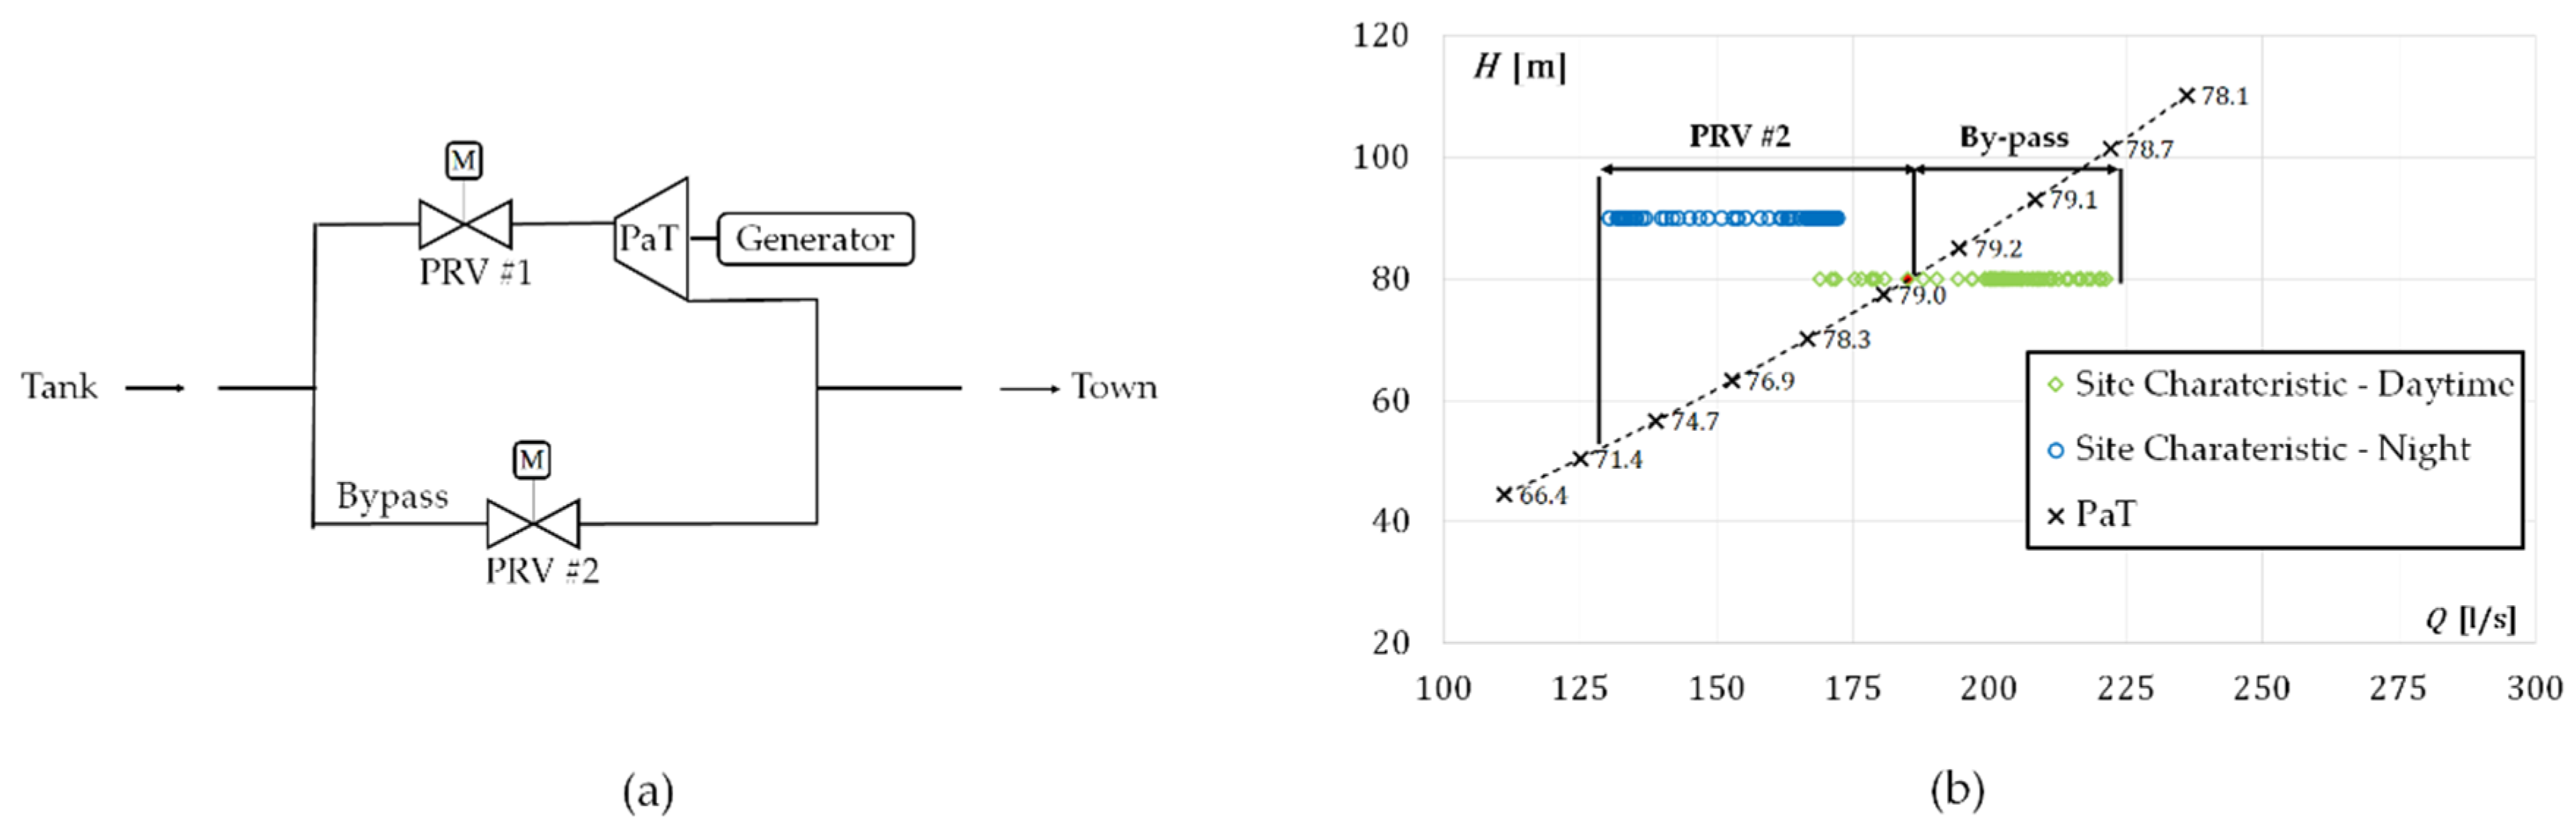
Starting from this setting, Stefanizzi et al. [
7] performed a preliminary technical assessment by proposing the installation scheme of
Figure 3a. The PaT is installed in series to a PRV (PRV #2), and a bypass with another PRV (PRV #1) is contemplated in parallel. The proposed system can be installed upstream of the main PRV, which is left for safety reasons but is normally fully open. In order to design the plant system and to define the operational point of the PaT, it is necessary to start from the two different hydraulic patterns of the WDN (daytime and night) that entail a more complex PaT design. Considering this variability, the PaT has been selected, referencing the mean daytime data (
= 80 m,
=176.8 l/s) in order to define a unique specific speed. In this way, the PaT can work in the proximity of its BEP when the flow rate is higher. Then, it is possible to evaluate the BEP of the corresponding pump (
vs.
), as previously suggested (Equations (3)–(6)). As a result,
= 122.1 l/s and
= 48.8 m. At this point, knowing
and
, the pump can be selected from the catalogue. The resulting specific speed identifies the machine within the family of centrifugal pumps—in particular, a mixed flow centrifugal pump. In detail, in this study, the selected pump has been identified with the Xylem
® NSC 150-400/900, which provided geometrical details related to the impeller and its geometry. In this way, adopting the above indicated methodology, the characteristic curve of the pump operating as the turbine has been estimated (see
Figure 3).
Then, two different installations have been compared in terms of hydraulic energy harvesting and power output: case #1 is characterized by the presence of only a regulation valve, whereas in case #2, a pump speed regulation system is added. For this specific case study, the electric regulation did not involve a remarkable benefit in terms of daily power production. Indeed, the overall increase in the daily energy production of this case with both hydraulic and electric regulations is equal to 7% with respect to the case with only the hydraulic regulation [
7]. For the sake of brevity, only the results of the first solution (i.e., case #1) are presented in this paper, and
Figure 3 shows, respectively, the hydraulic scheme of the proposed installation plant and the predicted characteristic curve of the PaT. Overall, the total energy production amounts to 2241 kWh/day.
3.2. Central Apulia Network WDN
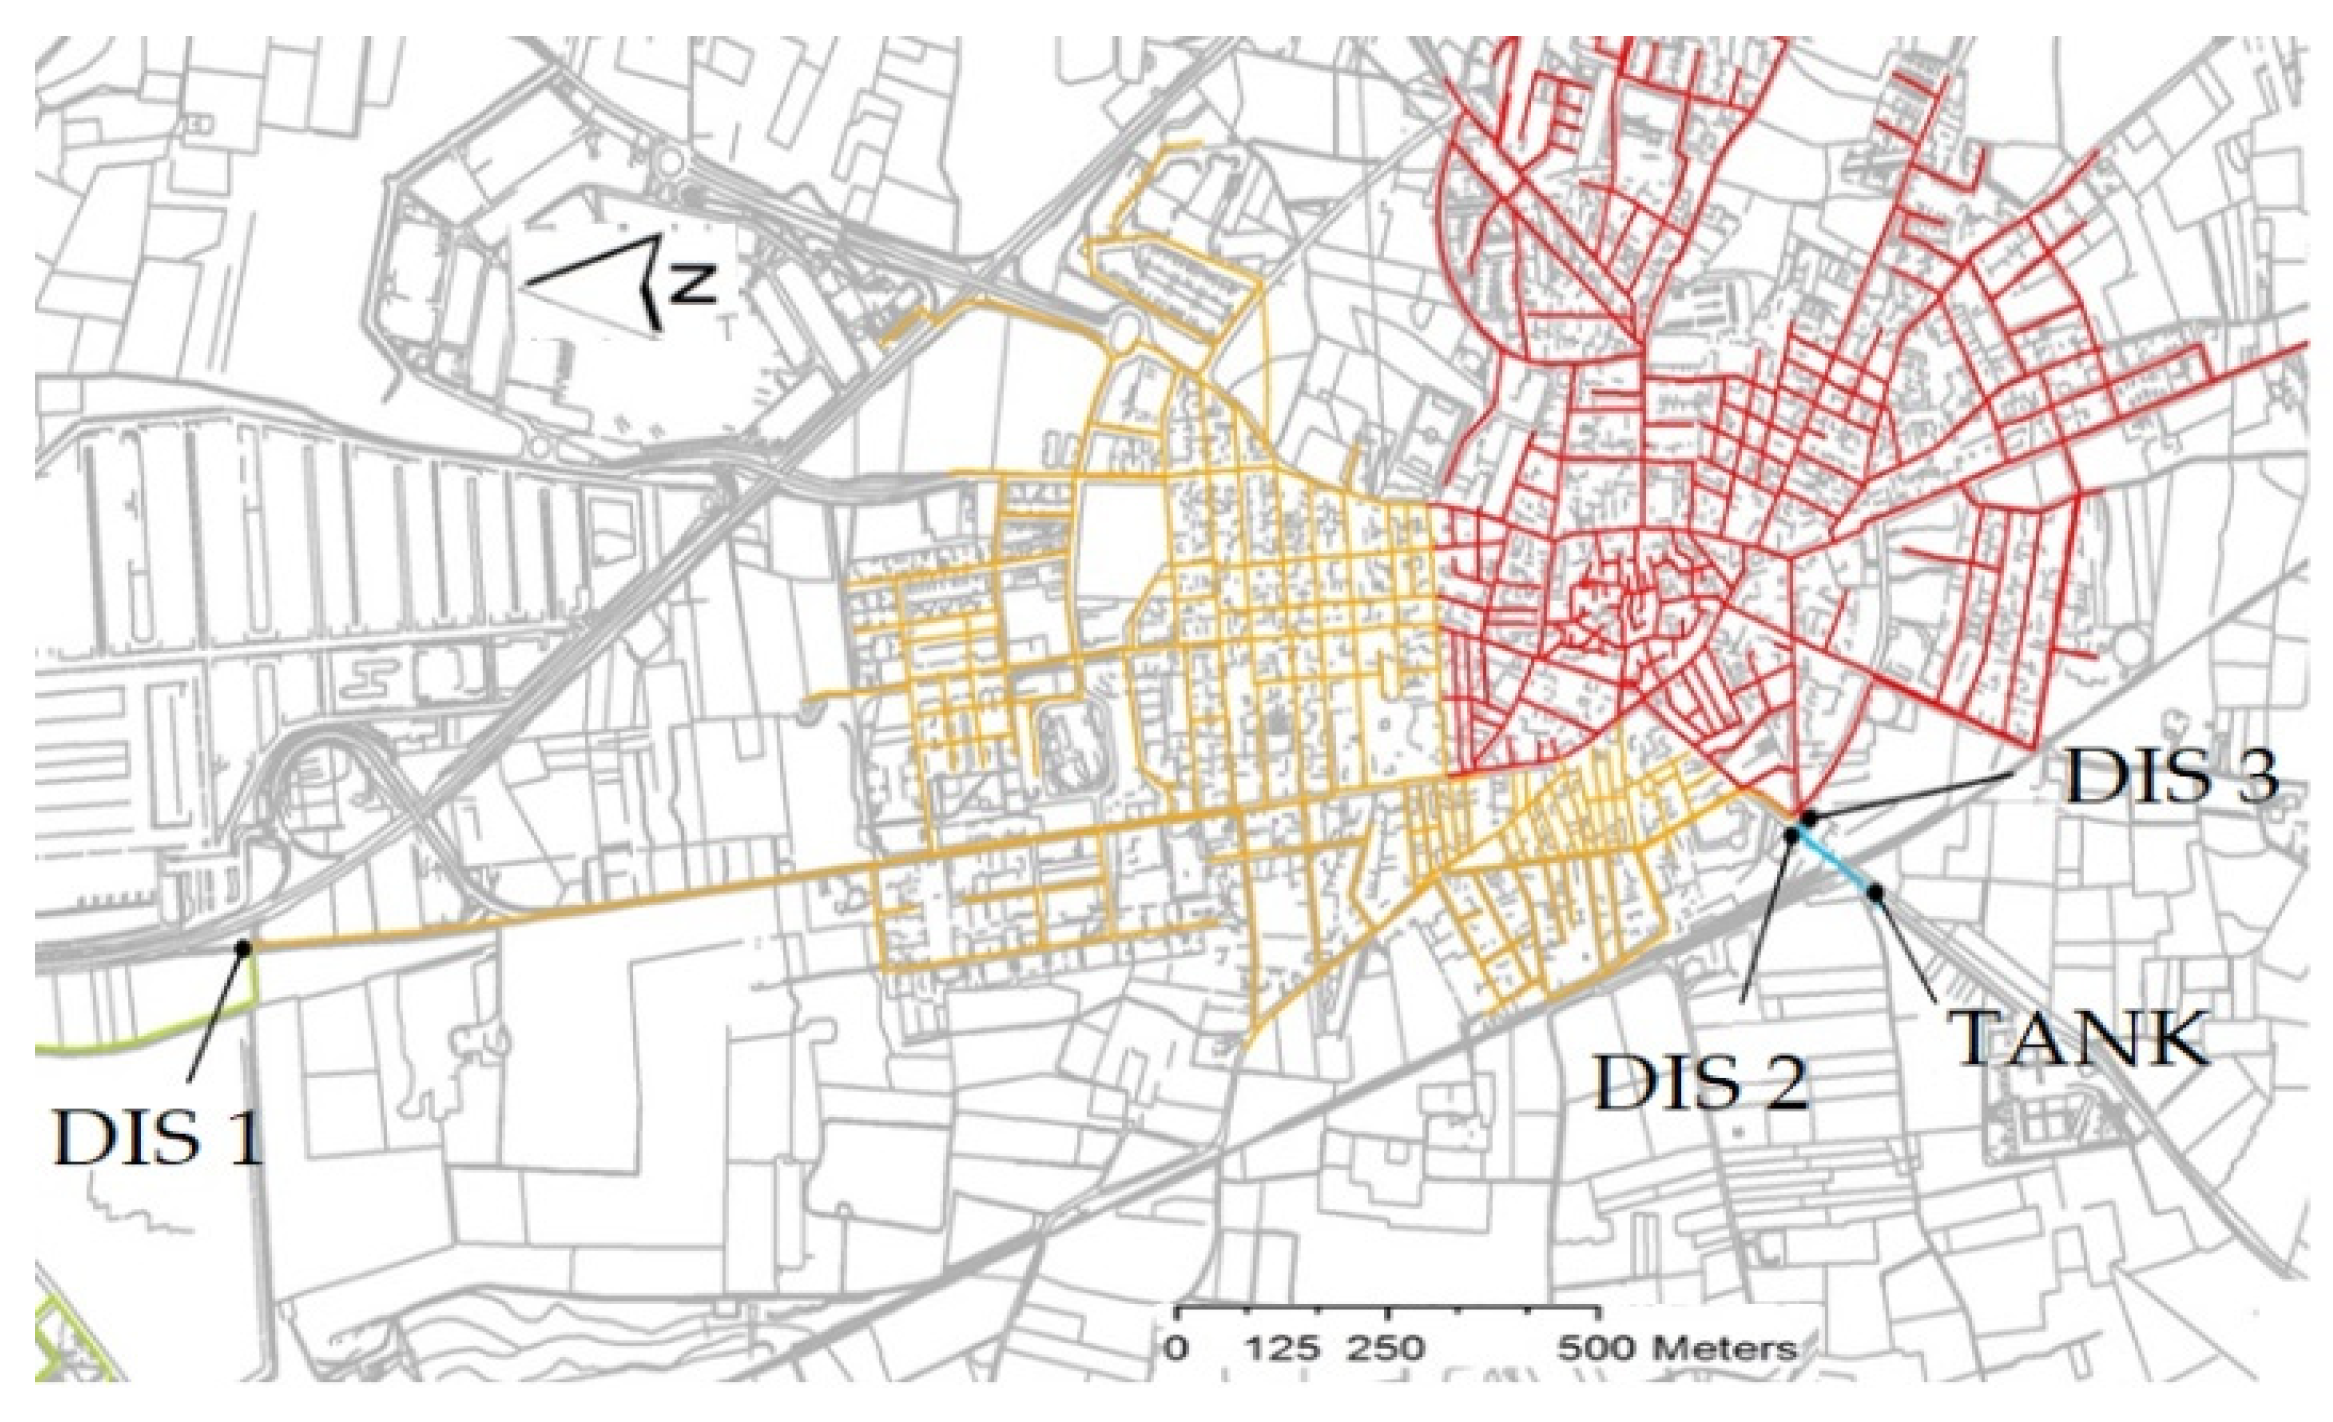
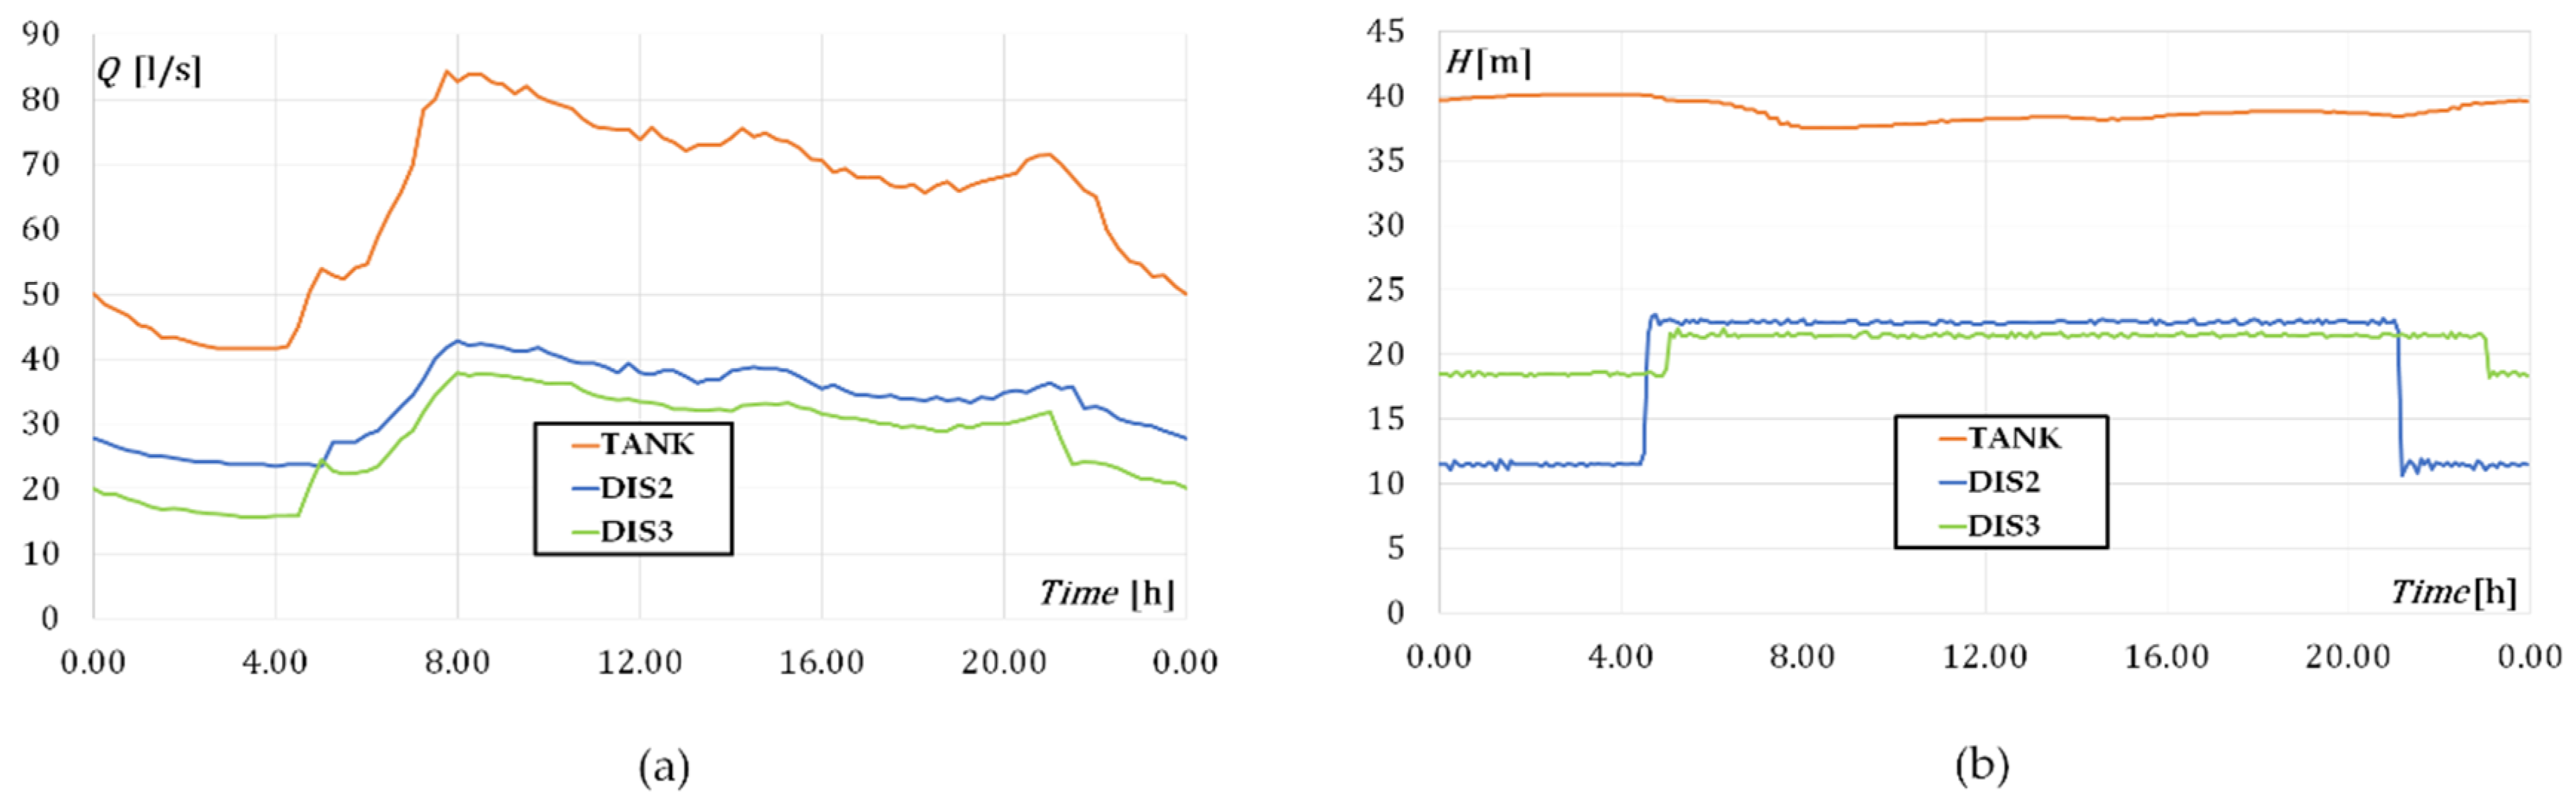
The second case study is the Central Apulia Network. As depicted in
Figure 4, a unique tank supplies this WDN (around 20,000 inhabitants), which is subdivided into three district metering areas (DMAs). The two main PRVs are installed at the entrance to the city, subdividing the WDN into two main DMAs (DIS 2 and DIS 3), which are almost comparable. The latter DMA (DIS 1) is in cascade to DIS 2 and it supplies a few residential buildings and a golf course. In this analysis, DIS 1 has been neglected due to limited inhabitants.
Figure 5 highlights how each PRV is designed to guarantee two different pressure patterns (daily and nightly). Each PRV is regulated with two different downstream pressure patterns due to different DMA heights and water drinking demands.
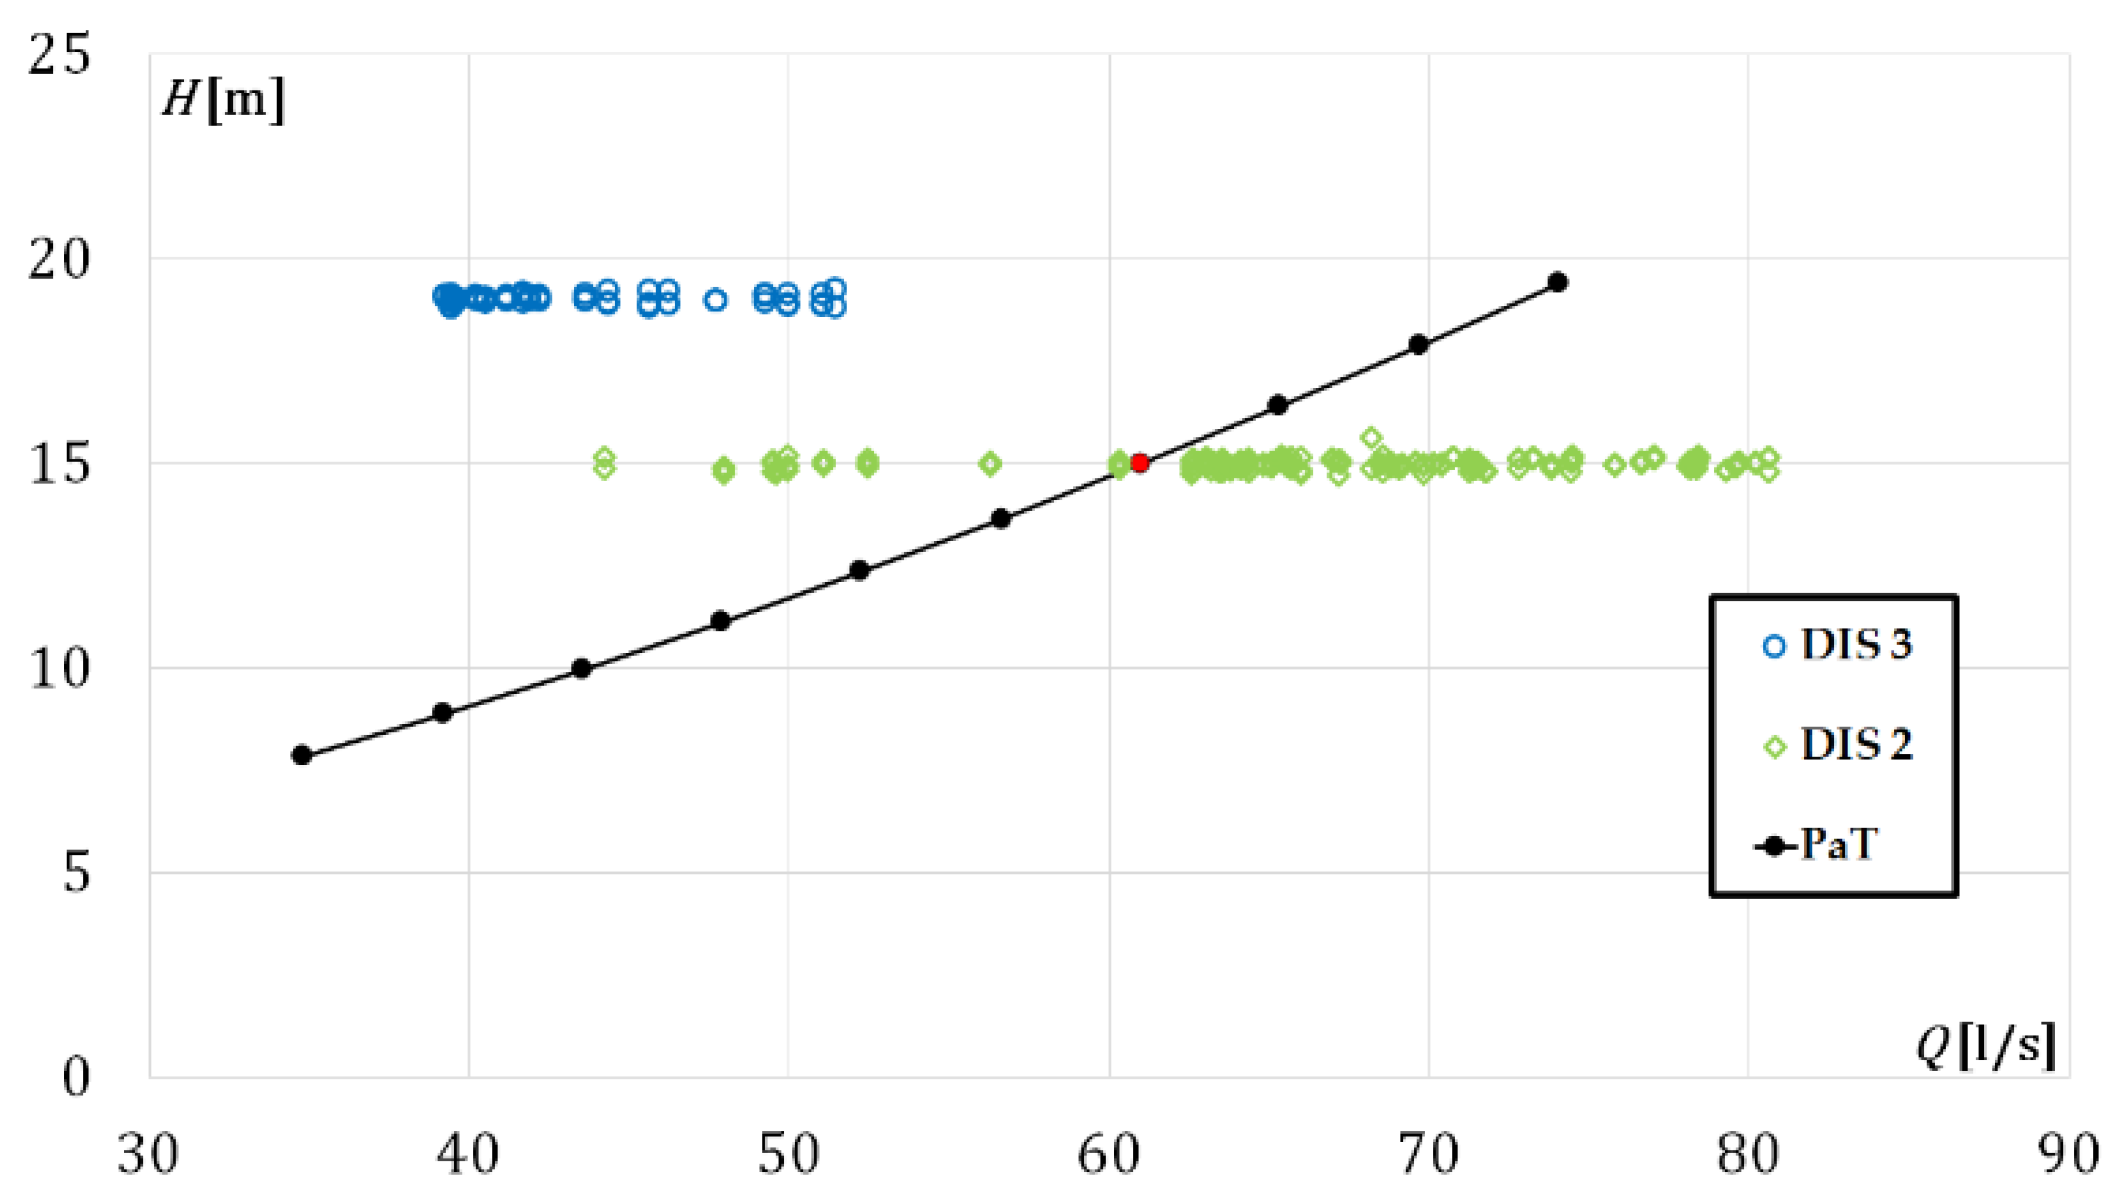
In this case, rather than considering another PaT with the correct
, the authors decided to scale the PaT selected in the first case study in order to guarantee the daily mean flow rate and its corresponding head (
= 60.98 L/s and
= 15 m). The scaling has been performed by modifying the outer diameter
and the rotational speed
. The characteristic curves have been scaled to define a pump that is geometrically similar to the Xylem
® NSC 150-400/900. However, it could be possible to select the specific machine from the manufacturer catalogue. As a result, the machine requires
= 345.7 mm and
= 740 rpm.
Figure 6 shows the characteristic curve of the scaled PaT (with the BEP condition highlighted with a filled red dot) and the characteristic curve of the installation site.
3.3. Economic Analysis
Starting from the effective energy production related the two case studies (2241 kWh/day for the Murgia Network and 142 kWh/day for the Central Apulia Network), an economic analysis has been carried out. The cost analysis has been conducted for the expected life of the PaT (estimated in 15 years). A cost-benefit analysis was conducted by evaluating the payback period, return of investment (ROI), net present value (NPV), and internal rate of return (IRR). The capital costs are the sum of all the equipment costs necessary to realize the system; the annual operation cost, due to the maintenance of every device, and civil works are estimated to be equal to 0.5% and 2.5% of the capital costs, respectively [
21]. In more detail, the hydraulic equipment consists of the by-pass, valves, and pipes, whereas the electrical equipment consists of a PLC-based control system and the measurement devices with their SCADA connections (see
Table 1).
Moreover,
Table 2 shows the environmental benefits and revenues, while
Table 3 presents the results of the economic analysis for both case studies. Stefanizzi et al. [
7] estimated that the annual energy production by the PaT system for the Murgia Network is 818,028 kWh/year and the annual revenue for this produced energy was computed as 127,612 €/year, considering a complete feed-in of the produced electricity and a reference sales price fixed by the Italian Energy Manager (GSE) in 2019. Balacco et al. [
6] verified that the annual energy production by PaT system for the Central Apulia Network is 51,830 kWh/year and the annual revenue for this produced energy was computed as 8085 €/year.
However, a comprehensive cost-benefit analysis must also include the estimation of environmental benefits and consequently revenues derived from the use of a PaT in a WDN. The analyzed WDNs are very old and their pipes are largely corrupted; for this reason, the water management authority has installed recently PRVs on the main pipes and, after this, water leakages have been drastically reduced, with a consequent water savings volume of around 1.57 Mm3/year and a full-recovery cost of water of around 1,261,440 €/year for the Alta Murgia Network and around 0.50 Mm3/year and a full-recovery cost of water of around 100,000 €/year for the Central Apulia Network. Moreover, a similar power generating system with renewable energy involves a CO2 reduction; the evaluation of the total reduction in CO2 emissions due to green energy production has been estimated to be 327,211 kgCO2/year and 20,732 kgCO2/year, respectively, considering an emission factor of 400 gCO2/kWh obtained from Italian national data from the last ten years.
The PaT installation could achieve the same results of a PRV in terms of water savings by recovering energy at the same time. In fact, for this analysis, the water saving is already guaranteed by the existing PRVs. For this reason,
Table 3 summarizes the results of the economic analysis, considering environmental benefits only due to CO
2 reduction in the first column and including water saving revenue in the second. This comparison allows us to understand the additional benefits that arise by adding water saving for the technical assessment of new plants where no PRVs are installed.
Focusing on the economic indicators of
Table 3, significant economic revenues can be observed for the Alta Murgia Network. Indeed, the payback period was estimated to be around 15 months, a very short time compared with the Central Apulia Network scenario. ROI amounts to 73% and B/C is equal to 7. Meanwhile, NPV amounts to 1,554,525 € and, finally, IRR for this study is equal to 31%. The same analysis applied also to the Central Apulia Network shows a payback period of around 5.25 years, a ROI equal to 15.14%, a B/C equal to 1.59, an NPV equal to 37,120 €, and an IRR of around 2.27%.
4. Conclusions
This study presents and summarizes the results of a technical and economic analysis with the aim of evaluating the possibility of inserting PaTs into real WDNs. Two Italian case studies, very different from each other in terms of extension and pressure in excess, have been analyzed and compared in terms of energy and economic results, adopting an effective methodology for the pump selection based on the pump specific speed number. Starting from the evaluation of the daily pressure and water demand patterns of the WDN, the BEP of the pump used as the turbine has been estimated and consequently its specific speed. From these data, and adopting the proposed methodology, the BEP that characterizes the same machine in pump mode has been estimated and consequently the pump selected among commercial ones. An economic analysis has been carried out for both case studies and the results show an economic revenue which is less evident for the smaller town but which however permits a payback time of nine years compared to a lifetime of the machineries of fifteen years. Clearly, also evaluating the environmental benefits, including the reduction in CO2 emission and water savings due to the pressure reduction in the WDN thanks to the PaT, the payback is reduced to a few months for both case studies. Finally, the results confirm the indisputable economical revenues of similar plants but, overall, the environmental benefits that nowadays play a key role in our society can no longer be ignored.


 ,
, 


