Proceeding Paper

Projection of Thermal Bioclimate Conditions over West Bengal, India in Response to Global Warming Based on Climate Model †

1
Department of Physics, Swami Vivekananda Institute of Science & Technology, Kolkata 700145, India
2
Institute for Meteorology, Freie Universitat, 12165 Berlin, Germany
*
Author to whom correspondence should be addressed.
Presented at the 5th International Electronic Conference on Atmospheric Sciences, 16–31 July 2022; Available online: https://ecas2022.sciforum.net/.
Environ. Sci. Proc. 2022, 19(1), 28; https://doi.org/10.3390/ecas2022-12820
Published: 14 July 2022
(This article belongs to the Proceedings of The 5th International Electronic Conference on Atmospheric Sciences)

Abstract

:
The study of human bioclimatic conditions is becoming popular in climate perception for the improvement of the public health system. The objective of the present study is to analyze the past and future thermal bioclimate conditions over 15 stations in West Bengal (WB), India. The bioclimate conditions are measured by the daily Physiologically Equivalent Temperature (PET) based on climate data extracted from the Coordinated Regional Downscaling Experiment (CORDEX)-South Asia. The initial purpose of this study is to present the interannual distribution of PET classes over the considered stations of WB for the past period (1986–2005) and two future time periods, namely (i) near future (2016–2035) and (ii) mid-21st century (2046–2065). The results from the monthly distribution of PET reveal heat stress conditions from April to June and acceptable thermal conditions from November that persist till March for all the stations except Darjeeling, a hill station. To focus on future PET changes over WB in context to the reference period (1986–2005), warm and hot PET classes show prominent rises in the future epochs under the RCP4.5 and RCP8.5 emission scenarios. The highest percentage in the warm PET class (35.7–43.8 °C) appears in stations near the Bay of Bengal such as Digha, Diamond Harbour, Canning, and Baruipur during the mid-21st century time slice under RCP8.5 conditions. Simultaneously, hot PET class (>43.8 °C) records up to 10% for Kolkata, Dum Dum, Kharagpur, Siliguri and more than 10% in Sriniketan, Malda, Asansol, and Birbhum. Darjeeling will experience the greatest decrease in the very cool PET class (<3.3 °C) in the medium term. The explicit amount of change in temperature is seemingly connected to the increasing levels of heat stress over WB, as is evident from the relative mean monthly changes in PET.

1. Introduction

Several climate models along with the report of the Intergovernmental Panel for Climate Change (IPCC), suggest that there will be a rise in global air temperature in the future [1,2,3]. The temperature over India has shown significant warming trends in tune with the global warming pattern. Heat wave trends in India based on daily maximum temperature showed a significant increase in some stations in the North, Northwest, and Central India as investigated by several studies [4,5,6,7].
It has been reported that many states in India, including Gangetic West Bengal, have observed average heatwave spells for 8 days [8,9]. Every year, hundreds of citizens are admitted to hospitals due to heat-related illnesses in India. During the last few decades, numerous human bio-meteorological indices have been established based on human heat budget models to define and scale human thermal stress. Physiologically Equivalent Temperature (PET) [10,11,12], Perceived Temperature (PT) [13,14], Standard Effective Temperature (SET) [15], and the recently developed Universal Thermal Climate Index (UTCI) [16,17] are a few examples. These indices have been extensively used and categorized for estimation of human bio-meteorological conditions and other aspects such as worldwide tourism [18,19,20,21]. Of these indices, PET and UTCI have been extensively employed in recent studies because of their simple, sophisticated, and economical approach. The PET, in particular, fits well within a wide range of topography and has also proved efficient in different climate zones. Several studies examined the frequency of heat stress days, focusing on a particular region of WB for a short time [22,23,24,25,26].
Therefore, this study focuses on the past human bio-meteorological environment in WB reproduced from a climate model. Furthermore, the purpose of this study is to project the spatial extent of human thermal comfort in 15 WB stations under various carbon dioxide emission concentration pathway scenarios in context to PET. The results from this study will support enhancing the human thermal environment in the study region and potentially advise the local administrators to make policies to improve human health, urban design, planning, population migration, tourism development, social culture, and the economy.

2. Study Regions

West Bengal (WB) is situated in the eastern part of India (20°31′–27°12′ N and 85°50′–89°52′ E) and comprises an area of approximately 88,752 km2. Kolkata (formerly known as Calcutta) is the capital city of West Bengal, India. Kolkata is the third most populous city in India and the 13th most populous city in the world [27]. The state of West Bengal experiences varied climatic conditions that can be classified into four major seasons, namely (a) Winter: (December to February), (b) Summer: (March to May), (c) South-West Monsoon: (June to September), (d) Retreating South-West Monsoon: (October to November). During the summer months, the daily temperature varies between 24 °C and 40 °C and from 7 °C to 26 °C in the winter. The state of West Bengal is divided into 23 districts, and a few districts, especially in the western part, endure frequent heat waves in the summer when the maximum temperature rises to 45 °C or above, whereas the northern hilly districts experience infrequent snowfall when the minimum temperature reaches sub-zero. The average annual rainfall in West Bengal is approximately 1700 mm with significant variation between districts, with more than 5000 mm in some places of the foothills of the Himalayas and somewhat drier western regions with average annual precipitation less than 1300 mm [8].

3. Data

To understand the historical PET during the period from 1986 to 2005 over WB, daily meteorological data from general climate models from the suite of the Coordinated Regional Downscaling Experiment (CORDEX) have been used to estimate the heat stress [28]. For the future evolution of PET under the two Representative Concentration Pathways (RCPs), RCP4.5 and RCP8.5, the meteorological variables required to compute PET are extracted from CORDEX. The time series of each variable was extracted for a station. The grid nearest to that station was selected, corresponding to the coordinates defined in Table 1. The variables from the model include near surface temperature (K), surface relative humidity (%), total cloud cover (%), and near surface wind speed (ms−1).

4. Applied Methodology

In this study, PET was calculated for the 15 stations in WB with RayMan Pro Model Version 3.1 (Prof. Dr. Andreas Matzarakis and group, Freiburg, Germany) for the past period and future years [29,30]. PET is frequently used in human biometeorological studies to estimate human thermal comfort and is also recommended by the German VDI-Guidelines 3787, Part 2. In addition to the atmospheric variables, physiological aspects of the human body such as clothing, gender, and age were taken into account [12]. Personal data such as height, weight, age, and sex were taken as 1.6m, 75 kg, 35 years, and male respectively in each simulation. The clothing, activity, and position have been taken as 0.60, 80, and standing, respectively. Even a change in personal data does not have a significant impact on the PET value [26]. Retaining the mean radiant temperature and personal data in each simulation, daily PET has been obtained for all the 15 stations in WB for the past period (1986–2005) and future period (2016–2065). The present work adapted the same range of corrected PET, adjusted for Kolkata in particular, and exhibited in Table 2. To capture the relative changes of future PET and its classes under different emissions conditions for all the 15 sites in WB, two future periods are preferred with respect to the past period (1986–2005). The selected two future periods are (i) the near future (2016–2035) and (ii) the mid future (2046–2065). Additionally, the mean monthly PET differences for all the three future periods under RCP4.5 and RCP8.5 in comparison to past years are presented. The relative changes in each PET class and the mean monthly PET differences [22] have been expressed as (ΔPET)class and (ΔPET) respectively for all the future time slices. As temperature has considerable weightage in deciding the bioclimatic indices, the difference in mean monthly temperature (ΔTemp) was compared with the difference in mean monthly PET for any station for three future time slices under RCP4.5 and RCP8.5.

5. Results

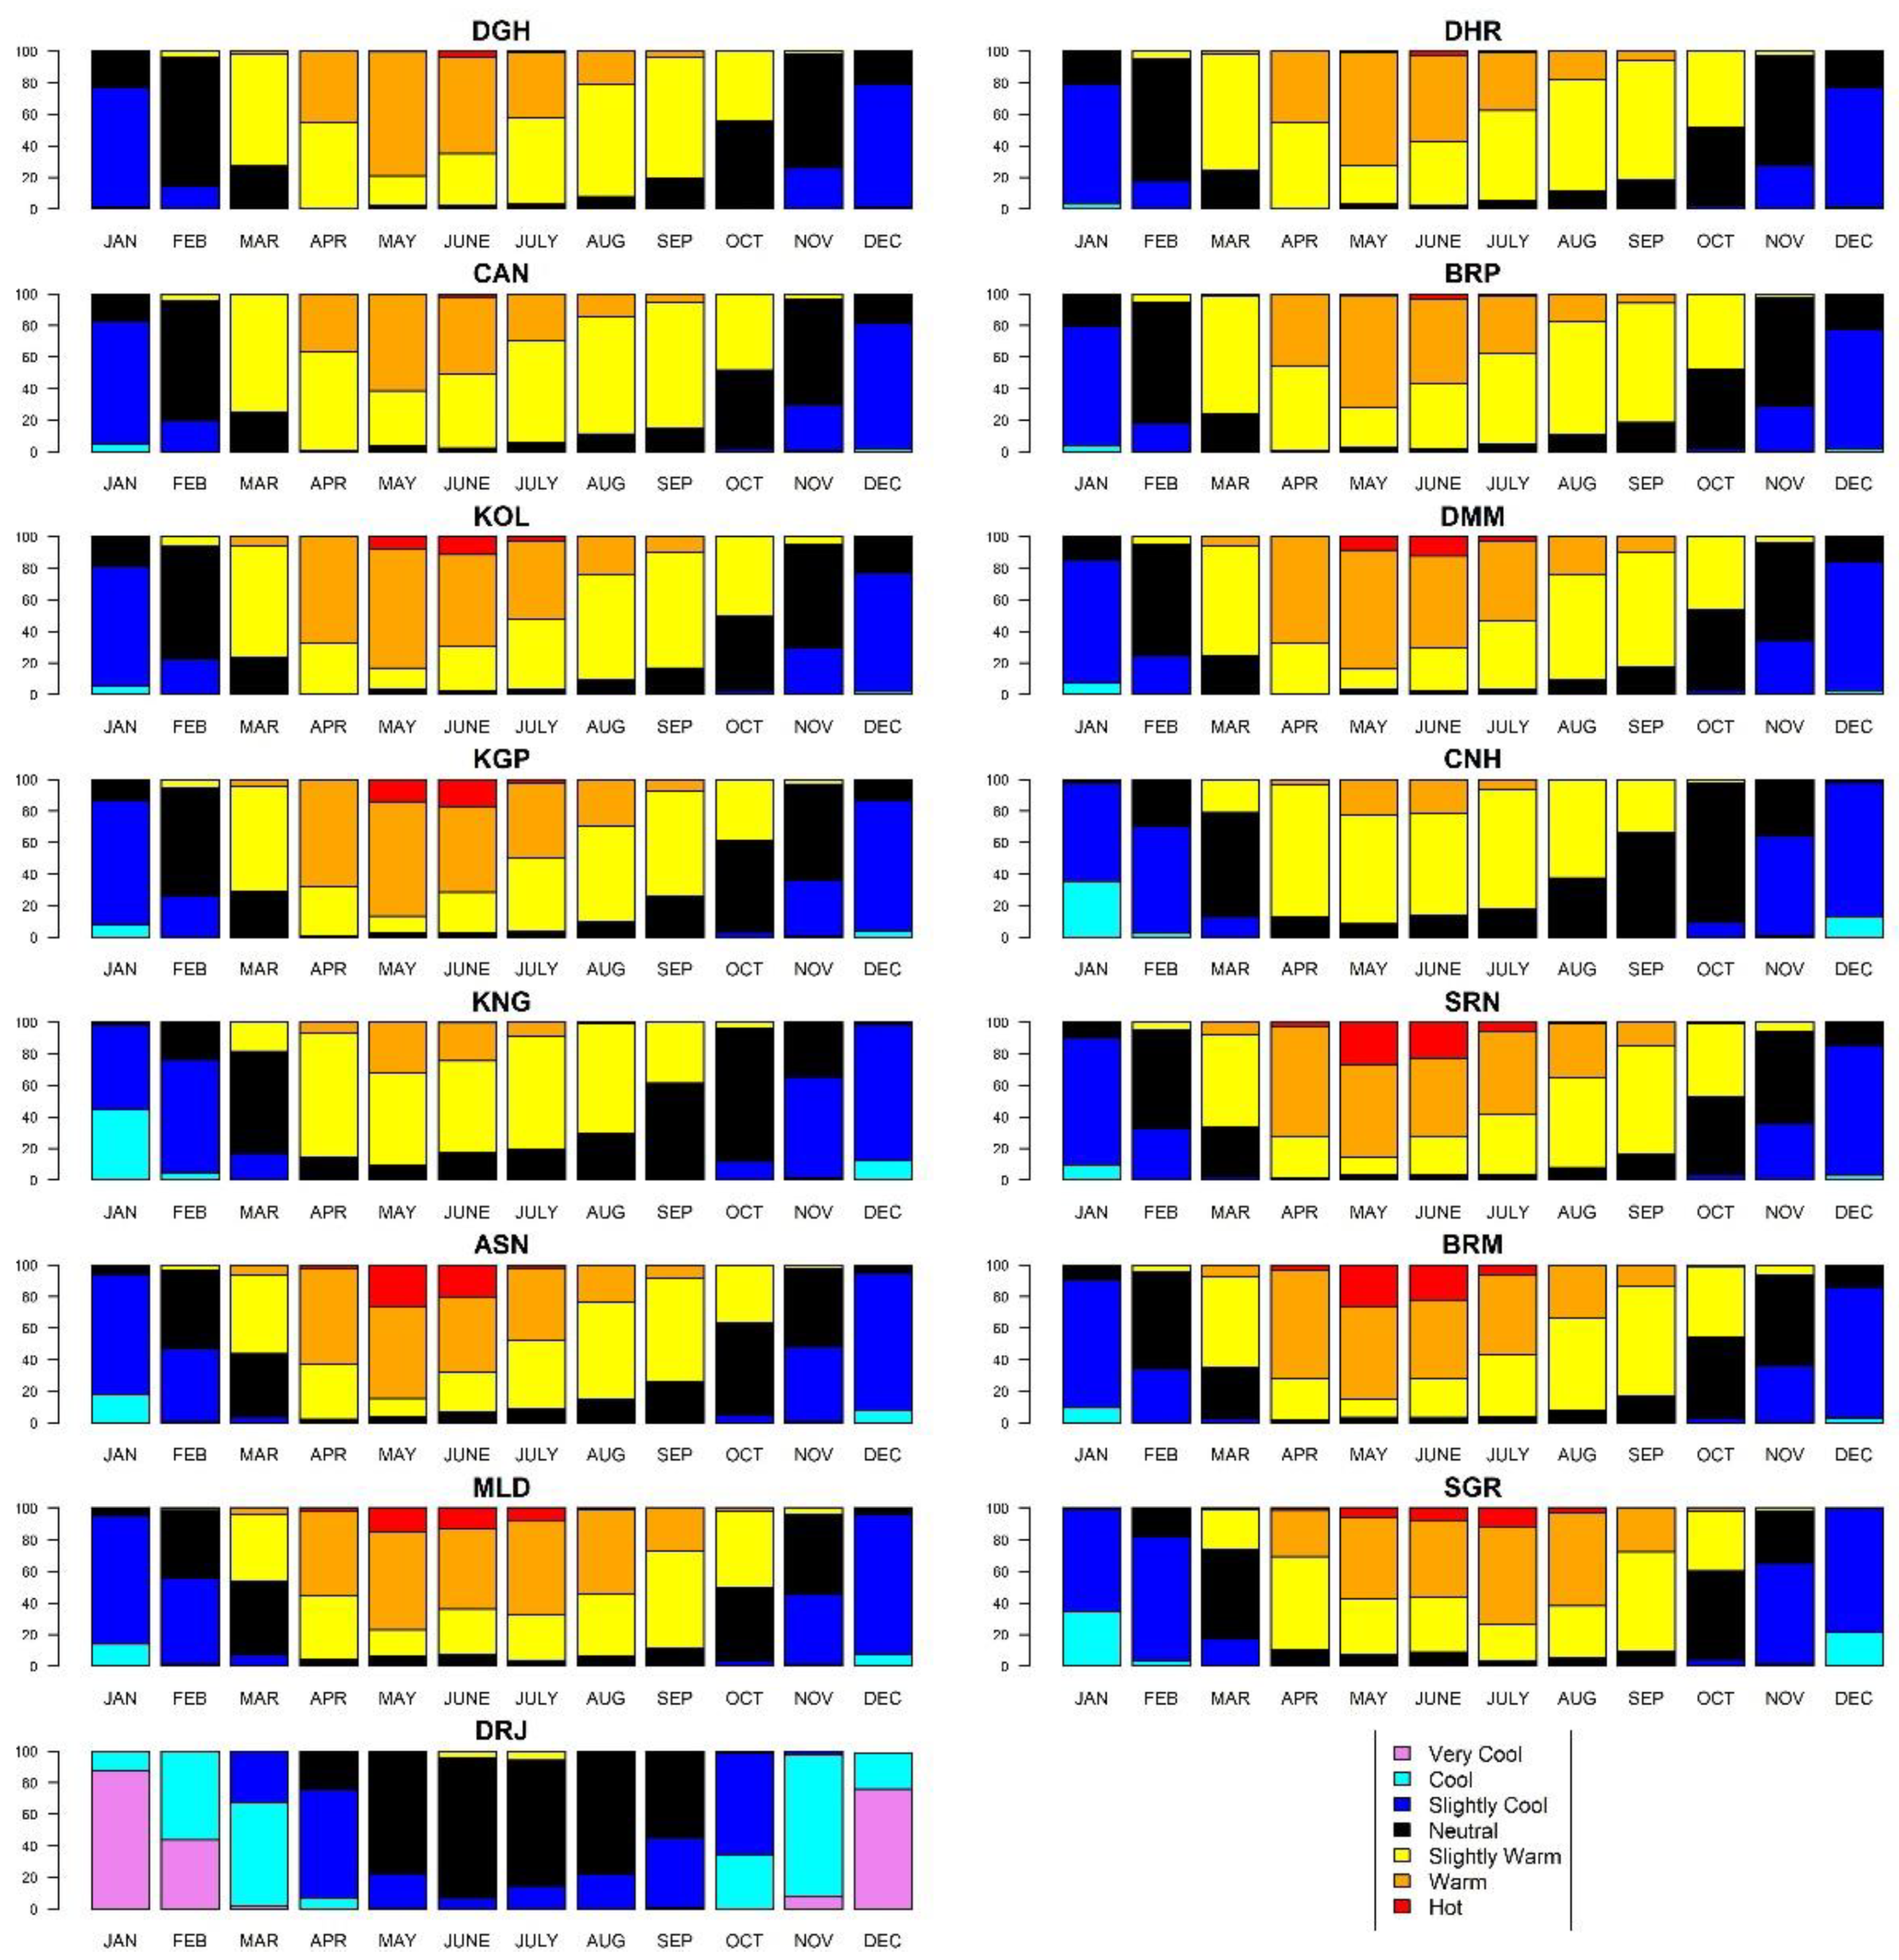
5.1. Intra-Annual Variation of PET

The bioclimate diagram of PET classes for all the considered stations in WB during the historical period (1986–2005) depicts various PET classes ranging from very cool to hot conditions (not shown). Darjeeling, being a hill station, does not experience any heat stress conditions. The thermal acceptability conditions in Darjeeling comprise neutral and slightly cool and are observed from March to September. The thermal acceptability shift towards very cool conditions in Darjeeling begins in October and remains till February. The percentage of hot stress conditions (not shown) for the stations such as Kolkata, Dum Dum, Kharagpur, Sriniketan, Asansol, Birbhum, Malda, and Siliguri increases largely in both the scenarios. Even though the hot conditions appear for the noted stations in May, in addition to June, during the near future for both the emission scenarios. The aforementioned changes will be further increased in the mid-future. In particular, in the mid-future (2046–2065), under the RCP4.5 scenario (not shown), percentage share of hot stress condition (>43.8 °C), for Kolkata (7.3% in May, 12% in June), Dum Dum (7.4% in May, 13.3% in June), Kharagpur (12.4% in May, 17.2 in June), Sriniketan (20.3% in May, 23.6% in June), Asansol (20.8% in May, 22.3% in June), Birbhum (21.1% in May, 23.3% in June), Malda (9.3% in May, 16.2% in June), and Siliguri (9.8% in June, 7.4% in July). In the higher emission scenario, the aforementioned stations will experience a two-to-three-fold rise in hot stress conditions (Figure 1).

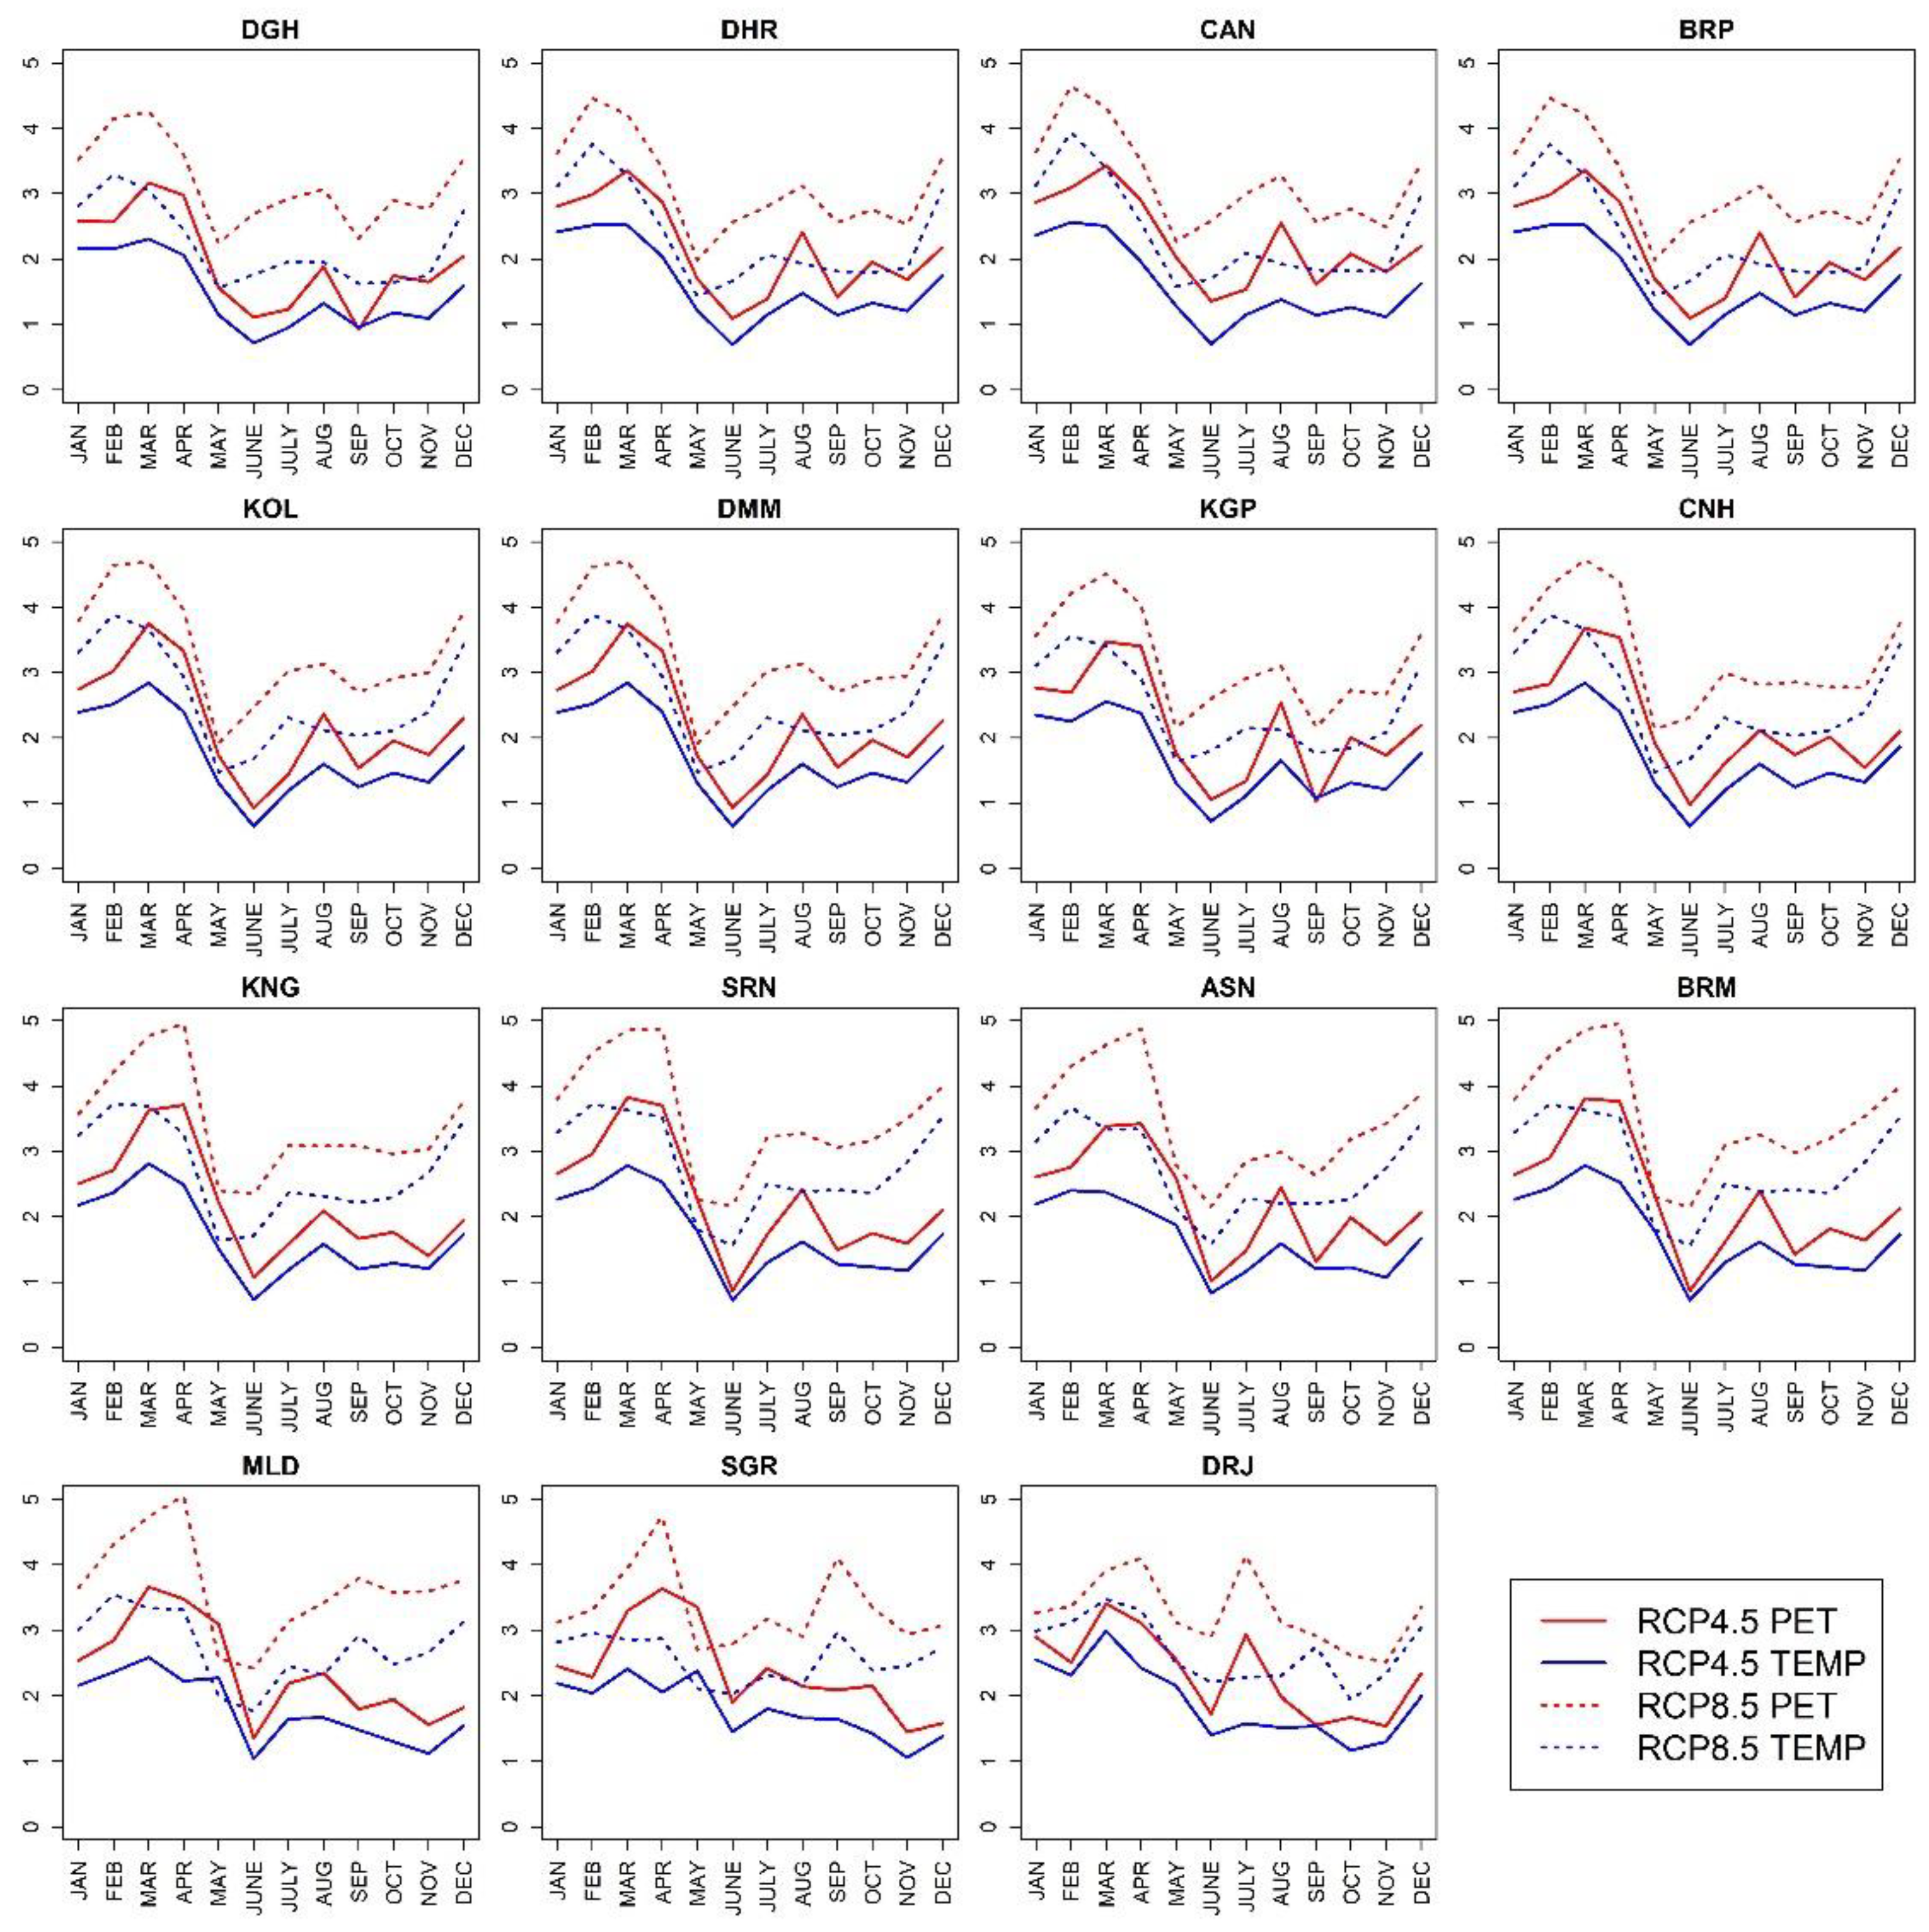
5.2. Monthly Temperature and PET Differences under Different RCP Scenarios

In this section, mean monthly PET and temperature differences between the two future time slices and historical periods for all the stations are presented for two emission scenarios.
In the mid-future period (2046–2065), mean PET and temperature differences for each month are shown in Figure 2. Like the first future time slice (not shown), anomalies in PET increase from November to March, reaching a maximum in March and starting to decrease till October, with a secondary peak appearing in July and August except for Siliguri in both the emission scenarios. In Darjeeling, maximum PET changes appear in July, with temperature changes remaining constant. Even the PET changes, particularly in Malda and Siligrui during the monsoon months, are not associated with an increase in temperature changes. This could be due to the humidity factor. During March and April, PET changes for each station under RCP4.5 conditions range between 3 and 4 °C. The highest PET changes in RCP8.5 range between 4 and 5 °C during the post-winter months for all stations, with Malda having the greatest prominence in April. The largest PET changes in the high greenhouse emission scenario, which occurs from January to April, varies between 5 and 9 °C, as a result of temperature changes ranging from 4.9 to 7.0 °C.

6. Discussion

The human biometeorological conditions were determined by daily PET values estimated from daily mean values of meteorological variables. Both the present and future input variables to calculate PET were obtained from CORDEX-South Asia. The present research on the human thermal bioclimate evaluation based on PET is considered for the 15 stations over WB. Monthly future PET and temperature changes against the past period under different emission scenarios were examined. The results obtained are consistent with recent studies in eastern India that identified December and January as the most comfortable months, while March and April experience thermal stress conditions using different thermal indices [5,26]. To explore the spatial variability of relative future PET changes of different classes in the future, time slices, each consisting of a 20-year time window against the base period (1986–2005) were used. It has been observed that for the future years, particularly in RCP8.5, stations close to the sea such as Digha, Diamond Harbour, Canning, and Baruipur show the largest positive warm stress changes. This pattern of coastal areas being exposed to increased heat stress has already been reported by [31]. The former study recognizes south east coastal regions as vulnerable in summer and north west coast and Indo Gangetic plain in monsoon [5]. A recent study also projected heat stress over India under different emission scenarios and reported that the east coast region suffers more heat stress days than the west coastal regions [31].

Author Contributions

Corresponding author, conceptualization, data analysis and results, manuscript preparation, S.B.; data interpretation and results, manuscript preparation, I.K. All authors have read and agreed to the published version of the manuscript.

Funding

This research received no funding.

Institutional Review Board Statement

Not applicable.

Informed Consent Statement

Meteorological datasets used in this study can all be obtained from publicly accessible archives.

Data Availability Statement

The codes and visualizations required for the study were made in R software. The data and code are available from the corresponding author upon reasonable request.

Acknowledgments

The authors would like to thank the Indian Meteorological Department, Kolkata, for the station data. Climate model data are provided by the CORDEX-South Asia. The editor and the anonymous reviewers are acknowledged for the comments that helped to improve this work.

Conflicts of Interest

The authors declare no conflict of interest.

References

  1. Solomon, S.; Qin, D.; Manning, M.; Chen, Z.; Marquis, M.; Averyt, K.B.; Tignor, M.; Miller, H.L. (Eds.) Climate Change 2007: The Physical Science Basis; Contribution of Working Group I to the Fourth Assessment Report of the Intergovernmental Panel on Climate Change; Cambridge University Press: Cambridge, UK, 2007; pp. 1–996. [Google Scholar]
  2. Flato, G.; Abiodun, P.; Braconnot, S.C.; Chou, W.; Collins, P.; Cox, F.; Driouech, S.; Emori, V.; Eyring, C.; Forest, P.; et al. Evaluation of Climate Models. In Climate Change 2013: The Physical Science Basis. Contribution of Working Group I to the Fifth Assessment Report of the Intergovernmental Panel on Climate Change; Cambridge University Press: Cambridge, UK, 2014; pp. 741–866. [Google Scholar]
  3. Van Oldenborgh, G.; Collins, M.; Arblaster, J.; Christensen, J.H.; Marotzke, J.; Power, S.B.; Rummukainen, M.; Tianjun, Z. Annex I: Atlas of Global and Regional Climate Projections; Cambridge University Press: Cambridge, UK, 2013; pp. 1311–1393. [Google Scholar]
  4. Dube, R.K.; Rao, G.S.P. Extreme weather events over India in the last 100 years. J. Ind. Geophys. Union 2005, 9, 173–187. [Google Scholar]
  5. Jaswal, A.; Padmakumari, B.; Kumar, N.; Kore, P. Increasing trend in temperature and moisture induced heat index and its effect on human health in climate change scenario over the Indian sub-continent. J. Clim. Chang. 2017, 3, 11–25. [Google Scholar] [CrossRef]
  6. Pai, D.; Nair, S.; Ramanathan, A. Long term climatology and trends of heat waves over India during the recent 50 years (1961–2010). Mausam 2013, 64, 585–604. [Google Scholar] [CrossRef]
  7. Rohini, P.; Rajeevan, M.; Srivastava, A.K. On the variability and increasing trends of heat waves over India. Sci. Rep. 2016, 6, 26153. [Google Scholar] [CrossRef]
  8. Das, B.; Chakraborty, R. Climate Change Scenario of West Bengal, India: A Geo-Environmental Assessment. Indian Cartogr. 2016, 36, 425–441. [Google Scholar]
  9. Singh, J.; Kumar, M. Solar radiation over four cities of India: Trend analysis using Mann-Kendall statistical test. Int. J. Renew. Energy Res. 2016, 6, 1385–1395. [Google Scholar]
  10. Höppe, P. The physiological equivalent temperature–a universal index for the biometeorological assessment of the thermal environment. Int. J. Biometeorol. 1999, 43, 71–75. [Google Scholar] [CrossRef]
  11. Matzarakis, A.; Mayer, H.; Iziomon, M. Applications of a universal thermal index: Physiological equivalent temperature. Int. J. Biometeorol. 1999, 43, 76–84. [Google Scholar] [CrossRef]
  12. Mayer, H.; Höppe, P. Thermal comfort of man in different urban environments. Theor. Appl. Climatol. 1987, 38, 43–49. [Google Scholar] [CrossRef]
  13. Jendritzky, G.; Bucher, K.; Laschewski, G.; Walther, H. Atmospheric heat exchange of the human being, bioclimate assessments, mortality and thermal stress. Int. J. Circumpolar Health 2000, 59, 222. [Google Scholar]
  14. Staiger, H.; Laschewski, G.; Grätz, A. The perceived temperature–a versatile index for the assessment of the human thermal environment. Part A: Scientific basics. Int. J. Biometeorol. 2012, 56, 165–176. [Google Scholar] [CrossRef] [PubMed]
  15. Gagge, A.P.; Fobelets, A.; Berglund, L. A standard predictive Index of human reponse to thermal enviroment. Trans. Am. Soc. Heat. Refrig. Air-Cond. Eng. 1986, 92, 709–731. [Google Scholar]
  16. Fiala, D.; Havenith, G.; Bröde, P.; Kampmann, B.; Jendritzky, G. UTCI-Fiala multi-node model of human heat transfer and temperature regulation. Int. J. Biometeorol. 2012, 56, 429–441. [Google Scholar] [CrossRef] [PubMed]
  17. Jendritzky, G.; de Dear, R.; Havenith, G. UTCI—Why another thermal index? Int. J. Biometeorol. 2012, 56, 421–428. [Google Scholar] [CrossRef] [PubMed]
  18. Matzarakis, A. Weather-and climate-related information for tourism. Tour. Hosp. Plan. Dev. 2006, 3, 99–115. [Google Scholar] [CrossRef]
  19. Rodríguez-Algeciras, J.; Algeciras, J.A.R.; Chaos-Yeras, M.; Matzarakis, A. Tourism-related climate information for adjusted and responsible planning in the tourism industry in Barcelona, Spain. Theor. Appl. Climatol. 2020, 142, 1003–1014. [Google Scholar] [CrossRef]
  20. Chen, Y.-C.; Chen, W.-N.; Chou, C.; Matzarakis, A. Concepts and new implements for modified physiologically equivalent temperature. Atmosphere 2020, 11, 694. [Google Scholar] [CrossRef]
  21. Lin, T.-P.; Matzarakis, A. Tourism climate information based on human thermal perception in Taiwan and Eastern China. Tour. Manag. 2011, 32, 492–500. [Google Scholar] [CrossRef]
  22. Banerjee, S.; Middel, A.; Chattopadhyay, S. Outdoor thermal comfort in various microentrepreneurial settings in hot humid tropical Kolkata: Human biometeorological assessment of objective and subjective parameters. Sci. Total Environ. 2020, 721, 137741. [Google Scholar] [CrossRef]
  23. Das, M.; Das, A.; Mandal, S. Outdoor thermal comfort in different settings of a tropical planning region of Eastern India by adopting LCZs approach: A case study on Sriniketan-Santiniketan Planning Area (SSPA). Sustain. Cities Soc. 2020, 63, 102433. [Google Scholar] [CrossRef]
  24. De, B.; Mukherjee, M. Optimisation of canyon orientation and aspect ratio in warm-humid climate: Case of Rajarhat Newtown, India. Urban Clim. 2018, 24, 887–920. [Google Scholar] [CrossRef]
  25. Sen, J.; Nag, P.K. Human susceptibility to outdoor hot environment. Sci. Total Environ. 2019, 649, 866–875. [Google Scholar] [CrossRef] [PubMed]
  26. Ziaul, S.; Pal, S. Assessing outdoor thermal comfort of English Bazar Municipality and its surrounding, West Bengal, India. Adv. Space Res. 2019, 64, 567–580. [Google Scholar] [CrossRef]
  27. INDIA, P. Census of India 2011 Provisional Population Totals; Office of the Registrar General and Census Commissioner: New Delhi, India, 2011.
  28. Sanjay, J.; Krishnan, R.; Shrestha, A.B.; Rajbhandari, R.; Ren, G.-Y. Downscaled climate change projections for the Hindu Kush Himalayan region using CORDEX South Asia regional climate models. Adv. Clim. Chang. Res. 2017, 8, 185–198. [Google Scholar] [CrossRef]
  29. Matzarakis, A.; Rutz, F.; Mayer, H. Modelling radiation fluxes in simple and complex environments—Application of the RayMan model. Int. J. Biometeorol. 2007, 51, 323–334. [Google Scholar] [CrossRef]
  30. Matzarakis, A.; Rutz, F.; Mayer, H. Modelling radiation fluxes in simple and complex environments: Basics of the RayMan model. Int. J. Biometeorol. 2010, 54, 131–139. [Google Scholar] [CrossRef]
  31. Rao, K.K.; Kumar, T.V.L.; Kulkarni, A.; Ho, C.-H.; Mahendranath, B.; Desamsetti, S.; Patwardhan, S.; Dandi, A.R.; Barbosa, H.; Sabade, S. Projections of heat stress and associated work performance over india in response to global warming. Sci. Rep. 2020, 10, 16675. [Google Scholar]
Figure 1. Intra-annual frequency diagram of various PET classes over the investigated stations extracted from the CORDEX (2046–2065) under RCP8.5 conditions. The abbreviations of each station are explained in Table 1.
Environsciproc 19 00028 g001
Figure 2. Mean monthly differences of PET and temperature for 15 WB stations considered under CORDEX RCP4.5 and RCP8.5 during 2046–2065 compared to the reference period (1986–2005). The abbreviations of all the investigated stations are described in Table 1.
Environsciproc 19 00028 g002
Table 1. List of the 15 selected sites with position coordinates in WB for this study.
Sl. No.StationAbbreviated Station CodeLongitudeLatitude
1.Digha DGH87.50° E21.62° N
2.Diamond Harbour DHR88.20° E22.17° N
3.Canning CAN88.67° E22.25° N
4.Baruipur BRP88.44° E22.38° N
5.Alipore (Kolkata)KOL88.32° E22.52° N
6.Dum Dum DMM88.45° E22.63° N
7.Kharagpur KGP87.32° E22.32° N
8.ChinsurahCNH88.44° E22.90° N
9.Krishnanagar KNG88.49° E23.41° N
10.Sriniketan SRN87.70° E23.63° N
11.AsansolASN86.95° E23.67° N
12.Birbhum BRM87.59° E23.81° N
13.MaldaMLD88.12° E25.02° N
14.Siliguri SGR88.43° E26.48° N
15.Darjeeling DRJ88.27° E27.05° N
Table 2. PET classification of Kolkata [22] has been used for all the sites in the present study.
Thermal SensationPET Range for Kolkata (°C)
Very cool/Cold˂3.31
Cool3.31–11.42
Slightly cool11.42–19.48
Neutral19.48–27.59
Slightly warm27.59–35.73
Warm35.73–43.83
Hot>43.83
Publisher’s Note: MDPI stays neutral with regard to jurisdictional claims in published maps and institutional affiliations.

