Next Article in Journal
NDVI Analysis for Monitoring the Spatial and Temporal Variability of the Vegetation Cover in Sardinia: A Proposal to Support Natural Hazard Management
Previous Article in Journal
Improvement of Wildland Fire Management with ArcGIS
 
 
Please note that, as of 4 December 2024, Environmental Sciences Proceedings has been renamed to Environmental and Earth Sciences Proceedings and is now published here.
Proceeding Paper

Environmental and Water-Use Efficiency of Indirect Evaporative Coolers in Southern Europe †

by
María Jesús Romero-Lara
1,*,
Francisco Comino
2 and
Manuel Ruiz de Adana
1
1
Departamento de Química-Física y Termodinámica Aplicada, Escuela Politécnica Superior, Universidad de Córdoba, Campus de Rabanales, Antigua Carretera Nacional IV, km 396, 14071 Córdoba, Spain
2
Departamento de Mecánica, Escuela Politécnica Superior, Universidad de Córdoba, Campus de Rabanales, Antigua Carretera Nacional IV, km 396, 14071 Córdoba, Spain
*
Author to whom correspondence should be addressed.
Presented at Innovations-Sustainability-Modernity-Openness Conference (ISMO’22), Bialystok, Poland, 26–27 May 2022.
Environ. Sci. Proc. 2022, 18(1), 13; https://doi.org/10.3390/environsciproc2022018013
Published: 1 September 2022
(This article belongs to the Proceedings of Innovations-Sustainability-Modernity-Openness Conference (ISMO’22))

Abstract

:
Heating, ventilation, and air-conditioning (HVAC) systems are responsible for about 20% of energy consumption in buildings. In terms of energy saving, evaporative cooling technology presents an interesting solution to conventional vapor compression systems. However, few studies have analyzed water-related indexes in indirect evaporative coolers (IECs). The main objective of this work was to evaluate the environmental impact and water-use efficiency of IECs in Southern Europe. Several models of performance indexes for the evaluated IEC system were developed via experimental tests. Based on energy simulations, the IEC system reached the highest values of annual SEER (7.6), K P I C-W (0.28 kWh/L), and K P I C-CO2 (16.2 kWh/kg CO2) for Lampedusa weather conditions. These results show that the IEC system for hot climate zones reached the highest environmental and water-use efficiency values.

1. Introduction

According to several studies conducted in the last decade, heating, ventilation, and air-conditioning (HVAC) systems are responsible for about 20% of energy consumption in buildings [1]. Evaporative cooling technology presents an interesting solution to conventional cooling technologies based on vapor compression systems. Most of the experimental studies of indirect evaporative coolers (IECs) focused on the analysis of energy performance. However, few studies have analyzed water-related indexes in this type of air-cooling system. In a previous study, a methodology to determine the water-use efficiency of evaporative coolers was developed [2]. Another work showed high values of water-use efficiency for IEC technology and combined systems with IECs [3].
The main objective of this work was to evaluate the environmental impact and water-use efficiency of indirect evaporative coolers in different countries in Southern Europe.

2. Materials and Methods

2.1. Experimental Setup

An indirect evaporative cooler (IEC) was experimentally studied in the present work. The IEC system was mainly composed of a counterflow heat exchanger, a process fan, a gross 60% filter, and an ePM1 65% filter. The inlet air conditions were adjusted with an AHU, as shown in Figure 1.
The evaluated IEC system worked with a single inlet air stream (100% outdoor air), IA, which was divided into two air streams: exhaust air (EA) and outlet air (OA). This air-cooling system consisted of alternative wet and dry channels separated by thin plates. The inlet air flow was cooled without increasing its humidity ratio, and the exhaust air flow was humidified and then exhausted outside. The most important characteristics of this IEC are shown in Table 1.

2.2. Description of IEC Evaluation

Each experimental test was carried out under different working conditions during a steady-state period of thirty minutes. The experimental tests were used to obtain the models of the output parameters: cooling capacity ( Q ˙ cooling) energy consumption ( W ˙ cons), and water consumption ( V ˙ W). Different values of inlet air temperature (TIA), inlet air humidity ratio (ωIA), inlet volumetric air flow ( V ˙ IA), and exhaust air ratio (REX) were considered to develop the mathematical models; see Table 2.
Second-order polynomial equations were used to obtain the relationship between the input parameters and the output parameters; see Equation (1).
Y ^ = b 0 + i = 1 k b i X i ˙ + i = 1 k b i i X i 2 + i = 1 k = 1 i = 2 ; j > i k b i j · X i ˙ · X j ,
where Y ^ is the estimated output value; X is the input parameters; b0 is the average response in each model; and bi, bii, and bij are the estimated parameters of the linear, quadratic, and second-order terms, respectively.
However, energy simulations were carried out to compare the environmental impact of the IEC system under different climate zones in Southern Europe. TRNSYS software was used in the energy simulations. It should be noted that the annual cooling periods and CO2 emission factors considered, FCO2, for each city were taken from a recently published article [4]. The values of the inlet volumetric air flow rate ( V ˙ IA) and REX were constant for the energy simulations; see Table 1.

2.3. IEC Evaluation Indexes

The IEC system was evaluated in terms of the output parameters of the experimental tests N1–N9 (see Equations (2)–(4)) and environmental impact indexes during annual cooling periods (see Equations (5)–(9)):
Cooling   capacity :   Q ˙ cooling = ρ air · V ˙ OA · ( h IA h OA )   [ kW ]
Energy   consumption :   W ˙ c o n s = W ˙ P r o c e s s   fan + W ˙ P u m p   [ kW ]
Water   consumption :   V ˙ W = Measurement   of   IEC   water   consumption   [ L/h ]
Annual   seasonal   energy   efficiency   ratio :   SEER =   Q ˙ c o o l i n g W ˙ c o n s   [ - ]
CO 2   emissions :   E ˙ CO 2   = F CO 2 · W ˙ c o n s   [ kg   CO 2 / year ]
Cooling   capacity   per   CO 2   emission :   K P I C - CO 2   =   Q ˙ c o o l i n g E ˙ C O 2   [ kWh / kg   CO 2 ]  
Cooling   capacity   per   unit   of   water   consumed :   K P I C - W   =   Q ˙ c o o l i n g   V ˙ W   [ kWh / L ]  
Water   consumption   per   CO 2   emission :   K P I W - CO 2   =   V ˙ W E ˙ C O 2   [ L / kg   CO 2 ]  

3. Results and Discussion

3.1. Experimental Results

Cooling capacity, energy consumption, and water consumption were the output parameters evaluated in the IEC system. The results of these performance indexes for each experimental test are shown in Table 3. It can be observed that high values of Q ˙ cooling were achieved under the working conditions of tests N4 and N7. In both cases, the values of ωIA and REX were 11 g/kg and 0.3, respectively. However, the value of Q ˙ cooling,N7 was higher than the value of Q ˙ cooling,N4 due to the higher inlet air flow rate and, thus, a higher outlet air flow rate. The lowest values of W ˙ cons and V ˙ W were reached when REX was 0.7.
The experimental results allowed for mathematical models of the output parameters to be obtained. The coefficients of determination (R2) for the Q ˙ cooling model, the W ˙ cons model, and the V ˙ W model of the evaluated IEC were greater than 0.987 for all output parameters.

3.2. Annual Results of Environmental Impact

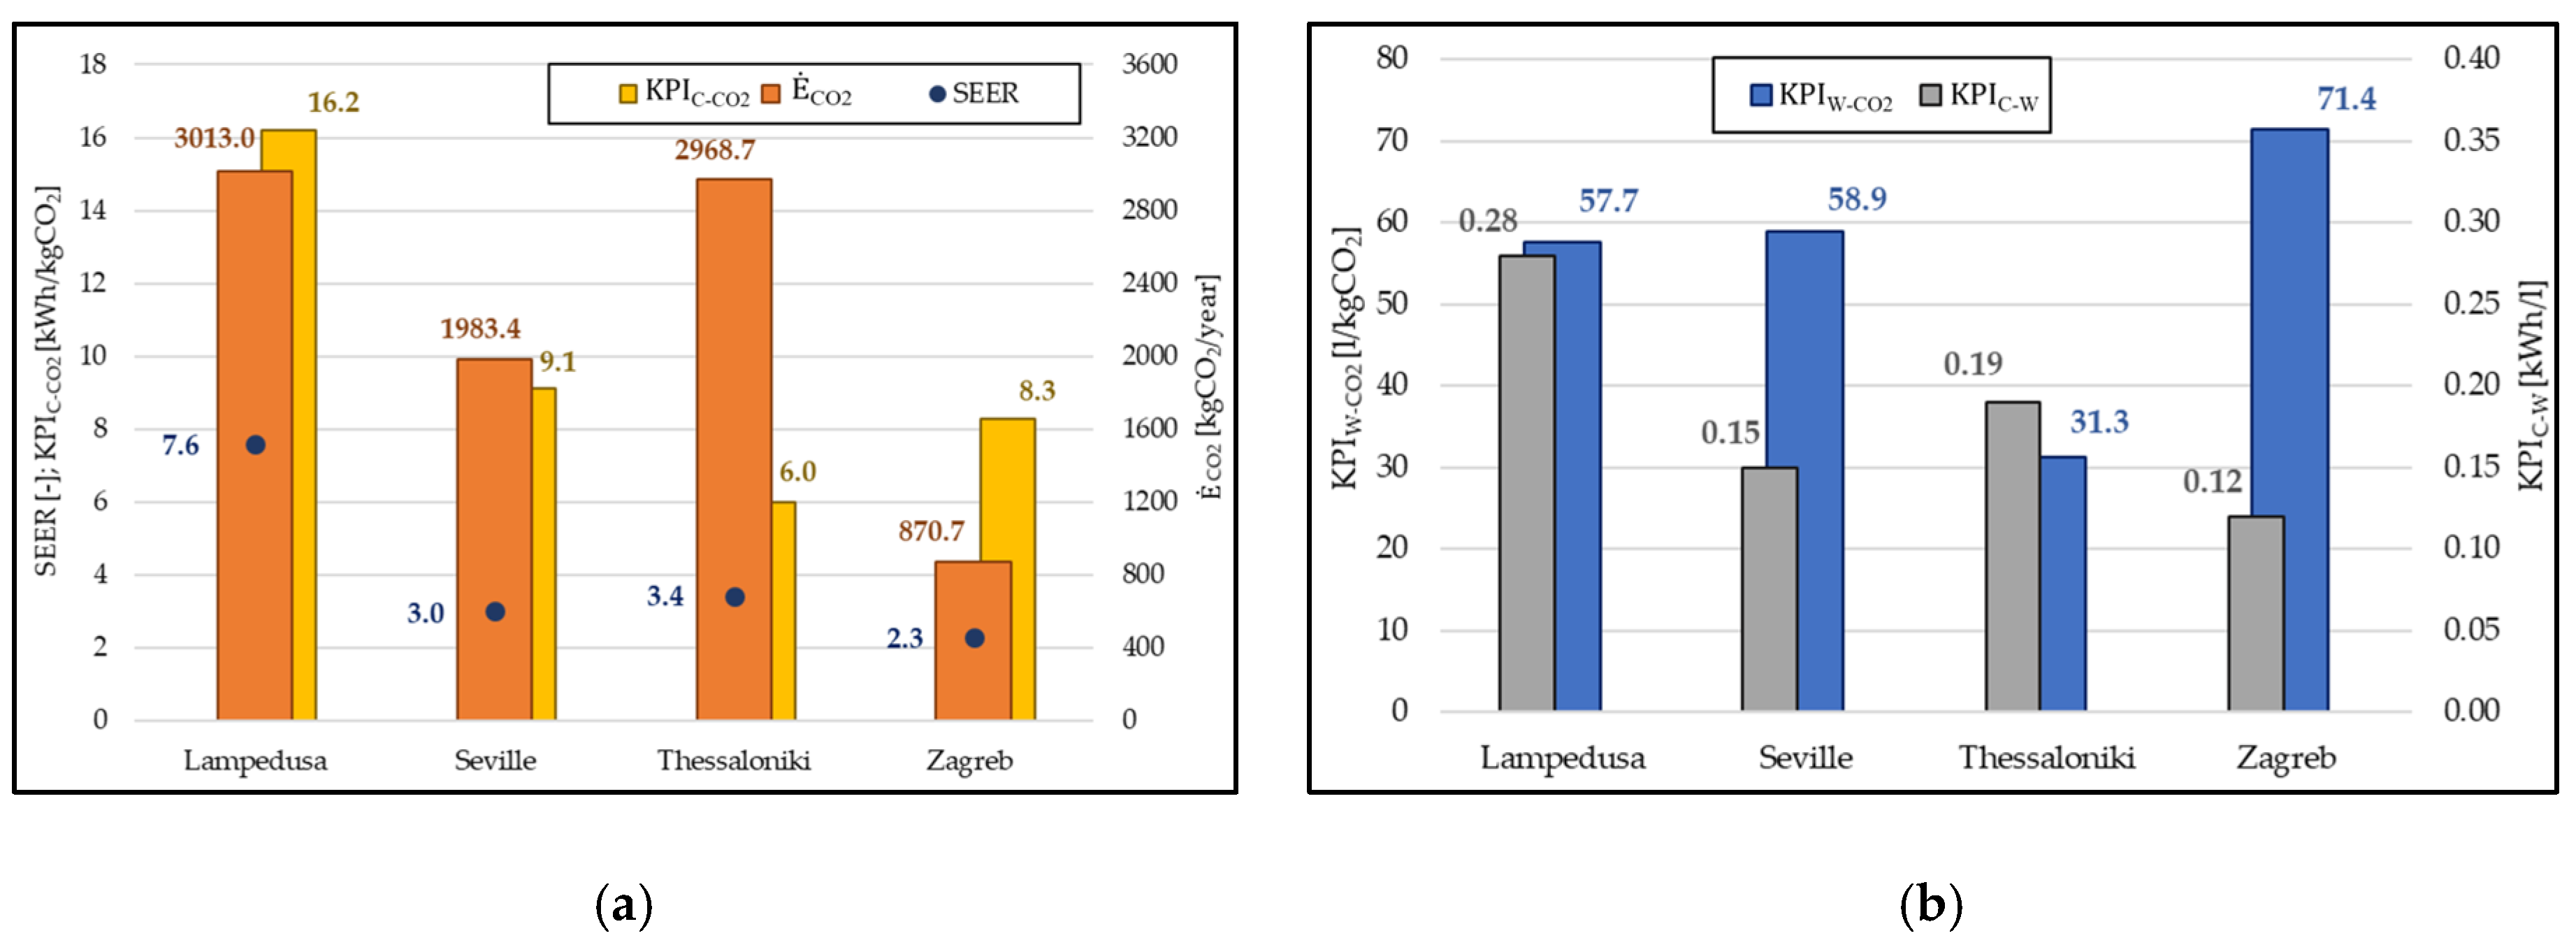
The annual values of several indexes related to environmental impact were obtained (see Figure 2) according to Equations (5)–(9). The cooling period considered for each climate zone (Lampedusa, Seville, Thessaloniki, and Zagreb) was defined as the number of hours in which TIA exceeded 18 °C.
It can be observed that, for all the selected cities, the results of K P I C-W and E ˙ CO2 increased when the SEER value increased. The IEC system in Lampedusa weather conditions, with the longest cooling period, reached the highest values of SEER (7.6) and K P I C-W (0.28 kWh/L) but also the highest value of E ˙ CO2 (3013 kg CO2/year); see Figure 2. According to K P I W-CO2, the results were similar for the Seville and Lampedusa climate zones. The IEC for Zagreb weather conditions showed the highest K P I W-CO2 value (71.4 L/kg CO2) due to low CO2 emissions; see Figure 2. The K P I C-CO2 values for Seville, Thessaloniki, and Zagreb were 1.8, 2.7, and 2.0 times lower than the K P I C-CO2 value for the Lampedusa climate zone, respectively; see Figure 2.

4. Conclusions

In the present work, the environmental impact and water-use efficiency of indirect evaporative coolers (IECs) in Southern Europe were analyzed. Mathematical models of several performance indexes for the evaluated IEC system were developed via experimental tests, showing good agreement. Based on the annual results obtained, the IEC for Lampedusa weather conditions reached the highest values of SEER (7.6), K P I C-W (0.28 kWh/L), and K P I C-CO2 (16.2 kWh/kg CO2). The IEC system for Zagreb weather conditions showed the highest value of K P I W-CO2 (71.4 L/kg CO2) due to the lowest value of E ˙ CO2 that IEC also showed (870.7 kg CO2/year). These results show that the IEC system for hot climate zones reaches the highest environmental and water-use efficiency values.

Author Contributions

M.J.R.-L. carried out the experimental tests and wrote the paper; F.C. discussed the results and revised the paper’s writing; M.R.d.A. conceptualized the idea of the paper, discussed the results, and contributed to the paper’s development. All authors have read and agreed to the published version of the manuscript.

Funding

This research was funded by European Union’s Horizon 2020 research and innovation programme through the research project WEDISTRICT, reference H2020-WIDESPREAD2018-03-857801.

Institutional Review Board Statement

Not applicable.

Informed Consent Statement

Not applicable.

Data Availability Statement

Not applicable.

Acknowledgments

The authors acknowledge the financial support received by European Union’s Horizon 2020 research and innovation programme through the research project WEDISTRICT, reference H2020-WIDESPREAD2018-03-857801.

Conflicts of Interest

The authors declare no conflict of interest.

References

  1. Mohammed, R.H.; El-Morsi, M.; Abdelaziz, O. Indirect evaporative cooling for buildings: A comprehensive patents review. J. Build. Eng. 2022, 50, 104158. [Google Scholar] [CrossRef]
  2. Sahai, R.; Shah, N.; Phadke, A. Addressing Water Consumption of Evaporative Coolers with Greywather; Lawrence Berkeley National Laboratory: Berkeley, CA, USA, 2012. [Google Scholar]
  3. Pistochini, T.; Modera, M. Water-use efficiency for alternative cooling technologies in arid climates. Energy Build. 2011, 43, 631–638. [Google Scholar] [CrossRef]
  4. Romero-Lara, M.J.; Comino, F.; Ruiz de Adana, M. Seasonal analysis comparison of three air-cooling systems in terms of thermal comfort, air quality and energy consumption for school buildings in Mediterranean climates. Energies 2021, 14, 4436. [Google Scholar] [CrossRef]
Figure 1. Experimental configuration for the study of IEC.
Environsciproc 18 00013 g001
Figure 2. Results of IEC annual environmental impact: (a) SEER,   E ˙ CO2,   K P I C-CO2; (b) K P I C-W,   K P I W-CO2.
Environsciproc 18 00013 g002
Table 1. Main characteristics of evaluated IEC system.
ParameterValueUnit
Nominal cooling capacity18kW
Nominal inlet air flow rate5000m3 h−1
Exhaust   air   ratio   ( R E X = V ˙ E A / V ˙ I A ) 0.45-
Nominal power consumption1.5kW
Maximum water consumption44l h−1
Table 2. Summary of experimental tests in IEC system.
TestTIA (°C)ωIA (g/kg) V ˙ I A (m3/h)REX (-)TestTIA (°C)ωIA (g/kg) V ˙ I A (m3/h)REX (-)
N1321130000.3N6401137000.7
N232830000.5N7321145000.3
N3321130000.7N8321445000.5
N4401137000.3N9321145000.7
N540837000.5
Table 3. Experimental results of the output parameters for the studied IEC.
Test Q ˙ cooling (kW) W ˙ cons (kW) V ˙ W (L/h) Test Q ˙ cooling (kW) W ˙ cons (kW) V ˙ W (L/h)
N117.50.37714.6N622.20.66943.7
N216.70.39921.3N733.51.13017.2
N313.30.37637.8N826.81.12640.8
N430.00.69217.3N924.31.07942.5
N528.30.70323.2
Publisher’s Note: MDPI stays neutral with regard to jurisdictional claims in published maps and institutional affiliations.